Skip all navigation and jump to content Jump to site navigation Jump to section navigation.
NASA Logo - Goddard Space Flight Center + Visit NASA.gov
HOME PROJECTS RESOURCES SEARCH MAP

+ Advanced Search
Home
Home
View Most Recently Released Imagery
View Gallery of Imagery: A topical collection of SVS Imagery
Search Imagery by the keywords assigned to it
Search Imagery by the instruments that supplied data for a visualization product
Search Imagery by the series of visualizations that have been produced
Search Imagery by the scientist providing the data used in a visualization product
Search Imagery by the animator that created the product
Search Imagery by the identification number assigned to the visualization product
See other search options
Learn about the SVS Image Server
  + About the Server
  + Animation List
  + How to Use the Server


  + RSS Feeds
blank image
Previous Animation
Next Animation
Global Surface Air Temperature during Hurricane Frances (WMS)

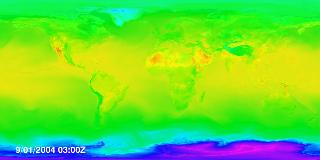
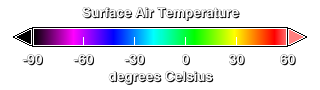
As the Sun's energy reaches the Earth, it is either reflected, absorbed by the clouds, or absorbed by the Earth's surface. The part absorbed by the Earth's surface heats the Earth, which then heats the air just above the surface. This process occurs rapidly in the case of dry land and slowly in the case of the oceans. This animation shows the surface air temperature at an altitude of 2 meters for the whole globe from September 1, 2004, through September 5, 2004, during the period of Hurricane Frances in the western Atlantic Ocean and Typhoon Songda in the western Pacific Ocean. The animation clearly shows the air over land reacting rapidly to solar heating during the day and cooling at night, while the daily solar cycle is not visible in the temperature of the air over the ocean. A very dynamic region of changing air temperature is visible in the interaction between the cold air over Antarctica and the warmer mid-latitude air over the southern oceans during this region of polar night. Hurricane Frances and Typhhon Songda are just barely visible as circulating temperature patterns in the western Atlantic and Pacific Oceans.

Global surface air temperature from the 0.25 degree resolution fvGCM atmospheric model for the period 9/1/2005 through 9/5/2005.
   Global surface air temperature from the 0.25 degree resolution fvGCM atmospheric model for the period 9/1/2005 through 9/5/2005.
Duration: 20.0 seconds
Available formats:
  320x160     JPEG         7 KB
  160x80       PNG           20 KB
  80x40         PNG           5 KB
  1000x721   Frames
  640x320 (29.97 fps) MPEG-1   5 MB
How to play our movies

This product is available through our Web Map Service.   Click here to learn more.


Legend for the surface air temperature
   Legend for the surface air temperature

Available formats:
  320 x 90           PNG   1 KB

Animation Number:3198
Animator:Horace Mitchell (SVS) (Lead)
Completed:2005-07-25
Scientist:William Putman (NASA/GSFC)
Data set:fvGCM
Data Collected:2005-09-01T03:00 -- 2005-09-05T24:00
Series:WMS
 fvGCM
Keywords:
DLESE >> Atmospheric science
DLESE >> Natural hazards
GCMD >> EARTH SCIENCE >> Atmosphere >> Atmospheric Phenomena >> Hurricanes
GCMD >> EARTH SCIENCE >> Atmosphere >> Atmospheric Phenomena >> Typhoons
GCMD >> EARTH SCIENCE >> Atmosphere >> Atmospheric Temperature >> Surface Air Temperature
GCMD >> EARTH SCIENCE >> Human Dimensions >> Natural Hazards >> Meteorological Hazards
GCMD >> Location >> Global
SVS >> Hurricane Frances
View Animation in Google Earth Google Earth KML file is available here.
DEPC Metadata is available here.
 
 
Please give credit for this item to
NASA/Goddard Space Flight Center Scientific Visualization Studio


Back to Top

USA.gov logo - the U.S. Government's official Web portal. + Privacy Policy and Important Notices
+ Reproduction Guidelines
NASA NASA Official:
SVS Contact:
Curator: