Outgoing Shortwave Flux Compared to Clouds (WMS)
|
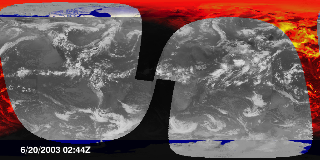
The Earth's climate is determined by energy transfer from the sun to the Earth's land, oceans, and atmosphere. As the Earth rotates, the sun lights up only part of the Earth at a time, and some of that incoming solar energy is reflected and some is absorbed, depending on type of area it lights. The amount of reflection and absorption is critical to the climate. An instrument named CERES orbits the Earth every 99 minutes and measures the reflected solar energy. This animation shows the reflected solar radiation measured by CERES during 29 orbits on June 20 and 21 of 2003 over infrared cloud images for the same period. Reflected solar radiation is shortwave radiation, and the most intense reflection comes from clouds.
|
|
|
|
This animation shows 29 orbits (2 days) of CERES measurements of outgoing shortwave radiation, from June 20-21, 2003. The measurements are superimposed over a global infrared cloud cover composite from the same period.
Duration: 29.0 seconds
Available formats:
1024x512
Frames
320x160
PNG
67 KB
160x80
PNG
19 KB
80x40
PNG
6 KB
640x320 (29.97 fps)
MPEG-1
5 MB
How to play our movies
|
|
This product is available through our Web Map Service.
Click here to learn more.
|
|
|
|
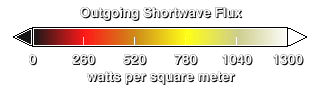
This is the legend for the outgoing shortwave radiation, indicating the magnitudes of the reflected energy flux.
Available formats:
320 x 90
PNG
1 KB
|
|
|
Back to Top
|


