Skip all navigation and jump to content Jump to site navigation Jump to section navigation.
NASA Logo - Goddard Space Flight Center + Visit NASA.gov
HOME PROJECTS RESOURCES SEARCH MAP

+ Advanced Search
Home
Home
View Most Recently Released Imagery
View Gallery of Imagery: A topical collection of SVS Imagery
Search Imagery by the keywords assigned to it
Search Imagery by the instruments that supplied data for a visualization product
Search Imagery by the series of visualizations that have been produced
Search Imagery by the scientist providing the data used in a visualization product
Search Imagery by the animator that created the product
Search Imagery by the identification number assigned to the visualization product
See other search options
Learn about the SVS Image Server
  + About the Server
  + Animation List
  + How to Use the Server


  + RSS Feeds
blank image
Previous Animation
Next Animation
Urban Signatures: Thermal Radiation (WMS)

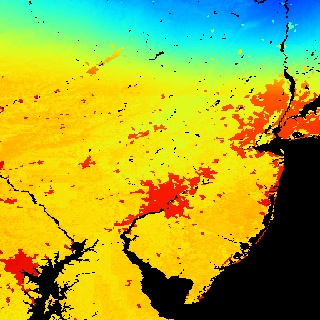
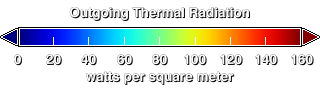
Big cities influence the environment around them. For example, urban areas are typically warmer than their surroundings. Cities are strikingly visible in computer models that simulate the Earth's land surface. This visualization shows outgoing thermal radiation predicted by the Land Information System (LIS) for a day in June 2001. Cities are warmer, so they emit more longwave (infrared) radiation. Only part of the global computation is shown, focusing on the highly urbanized northeast corridor in the United States, including the cities of Boston, New York, Philadelphia, Baltimore, and Washington.

This image shows outgoing thermal radiation
(watts per square meter) predicted by LIS for 2001/06/11. The
urban areas stand out very distinctly against their less
radiative surroundings.    This image shows outgoing thermal radiation (watts per square meter) predicted by LIS for 2001/06/11. The urban areas stand out very distinctly against their less radiative surroundings.

Available formats:
  1000 x 1000     PNG 413 KB
  320 x 320         JPEG 62 KB
  80 x 40             PNG   5 KB
  160 x 80           PNG 20 KB

This product is available through our Web Map Service.   Click here to learn more.


Thermal radiation color bar ranging from 0 to 160 W/m2.
   Thermal radiation color bar ranging from 0 to 160 W/m2.

Available formats:
  320 x 90           PNG   1 KB

Animation Number:3155
Animator:Jeff de La Beaujardiere (SVS) (Lead)
Completed:2005-05-16
Data set:LIS/Longwave Net Flux
Data Collected:2001/06/11
Series:WMS
 Land Information System
Keywords:
DLESE >> Human geography
GCMD >> EARTH SCIENCE >> Atmosphere >> Atmospheric Radiation >> Outgoing Longwave Radiation
GCMD >> EARTH SCIENCE >> Biosphere >> Terrestrial Ecosystems >> Urban Lands
GCMD >> EARTH SCIENCE >> Human Dimensions >> Environmental Impacts >> Urbanization
GCMD >> Location >> United States Of America
View Animation in Google Earth Google Earth KML file is available here.
DEPC Metadata is available here.
 
 
Please give credit for this item to
NASA/Goddard Space Flight Center
Scientific Visualization Studio. Additional credit should go to NASA GSFC Land Information System (http://lis.gsfc.nasa.gov/)


Back to Top

USA.gov logo - the U.S. Government's official Web portal. + Privacy Policy and Important Notices
+ Reproduction Guidelines
NASA NASA Official:
SVS Contact:
Curator: