Heavy Rainfall Leads to Southern California Mudslides (WMS)
|
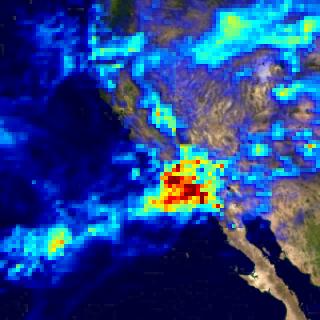
In January 2005, heavy rains in southern California caused flooding and mudslides. A flow of moisture known as a 'Pineapple Express' because it originates in the Pacific subtropics near Hawaii can cause severe winter storms in California when conditions are right. NASA's Tropical Rainfall Measuring Mission (TRMM) observered heavy rainfall near San Diego during a five-day period in January 2005. This visualization shows accumulation of rainfall--each frame shows the total amount of rain since the start of the measurement period.
|
|
|
|
This animation shows accumulated rainfall from
2005-01-06 through 2005-01-11. Each frame covers a three-hour
period. Each image pixel is 0.25 degrees on a side; the total
area covered is 20x20 degrees in longitude and latitude (80x80
pixels).
Duration: 1.0 seconds
Available formats:
320x320 (29.97 fps)
MPEG-1
362 KB
320x320
JPEG
18 KB
80x40
PNG
7 KB
160x80
PNG
25 KB
How to play our movies
|
|
This product is available through our Web Map Service.
Click here to learn more.
|
|
|
|
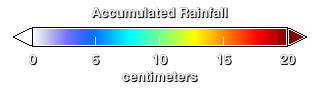
Color scale for accumulated rainfall. Values
above 20cm are shown as dark red. Values below 5cm are
increasingly transparent to allow a background image to show
through.
Available formats:
320 x 90
PNG
828 B
|
|
|
Back to Top
|


