Global Lightning Flash Rate Density (WMS)
|
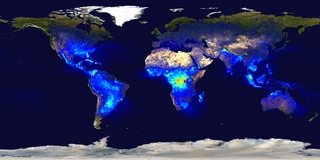
Lightning is a brief but intense electrical discharge between positive and negative regions of a thunderstorm.The Lightning Imaging Sensor (LIS) on the Tropical Rainfall Measuring Mission (TRMM) satellite was designed to study the distribution and variability of total lightning on a global basis. The Optical Transient Detector (OTD) was an earlier lightning detector flying aboard the Microlab-1 spacecraft. The data shown here are compiled from LIS (1998-2002) and OTD (1995-1999) observations. Because each satellite saw only a part of the Earth at any one time, these data use complex algorithms to estimate total flash rate density (number of flashes per square kilometer per year) based on the flashes observed and the amount of time the satellite views each area.
|
|
|
|
This image shows the global lightning flash
rate density for the entire observing period. The data pixels
are 0.5deg on a side (720x360 pixels globally). This single
image is equivalent to the final frame of animation #3143, but
at a spatial resolution that is 5 times
better.
Available formats:
720 x 360
PNG
462 KB
320 x 160
JPEG
8 KB
80 x 40
PNG
16 KB
160 x 80
PNG
53 KB
|
|
This product is available through our Web Map Service.
Click here to learn more.
|
|
|
|
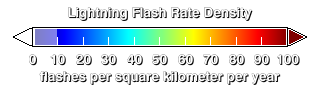
This color scale for the lighting flash rate density image ranges from deep blue (less than 10 flashes per square kilometer per year) through deep red (more than 100 flashes per square
kilometer per year).
Available formats:
320 x 90
PNG
1 KB
|
|
|
Back to Top
|

