Transatlantic Dust from North Africa (WMS)
|
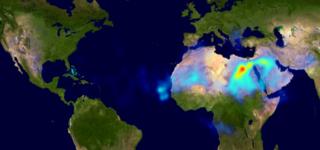
Desert storms in northern Africa raise dust that is carried in the upper atmosphere across the Atlantic Ocean. The dust, which may carry potentially hazardous bacteria and fungi, can land as far west as the Caribbean and the Americas.
|
|

|
|
This animation shows aerosol index over northern Africa and the Atlantic Ocean from July 1 through July 31, 2000. Each image pixel corresponds to an area 1 degree in longitude by 1.25 degrees in latitude.
Duration: 1.0 seconds
Available formats:
680x296 (29.97 fps)
MPEG-1
229 KB
680x300
PNG
522 KB
80x40
PNG
15 KB
320x150
JPEG
7 KB
160x80
PNG
54 KB
How to play our movies
|
|
This product is available through our Web Map Service.
Click here to learn more.
|
|
|
|
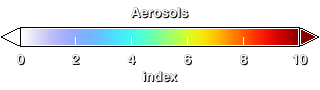
Color scale for this animation showing low aerosol values as shades of blue and green and higher values as yellow, orange or red. The units of aerosol index are dimensionless.
Available formats:
320 x 90
PNG
571 B
|
|
|
Back to Top
|


