Continental Effects of 2004 Alaskan Fires (WMS)
|
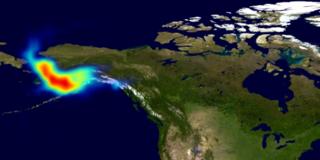
Wildfires started by lightning burned more than 80,000 acres in Alaska in June 2004. The effects of these fires can be seen across North America with the Total Ozone Mapping Spectrometer (TOMS) instrument on the Earth Probe spacecraft. TOMS detects the presence of UV-absorbing tropospheric aerosols across the globe.
|
|
|
|
This animation shows aerosol index over Alaska from June 21 through July 10, 2004. Each image pixel corresponds to an area 1 degree in longitude by 1.25 degrees in latitude.
Duration: 2.0 seconds
Available formats:
904x384 (29.97 fps)
MPEG-1
146 KB
904x384
PNG
674 KB
80x40
PNG
14 KB
320x160
JPEG
8 KB
160x80
PNG
52 KB
904x384
Frames (Composite)
How to play our movies
|
|
This product is available through our Web Map Service.
Click here to learn more.
|
|
|
|
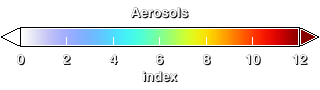
Color scale for this animation showing low aerosol values as shades of blue and green and higher values as yellow, orange or red. The units of aerosol index are dimensionless.
Available formats:
320 x 90
PNG
606 B
|
|
|
Back to Top
|


