

| include graphs NEW! | ||||||
Major Sector Productivity and Costs Index
Series Id: PRS85006092 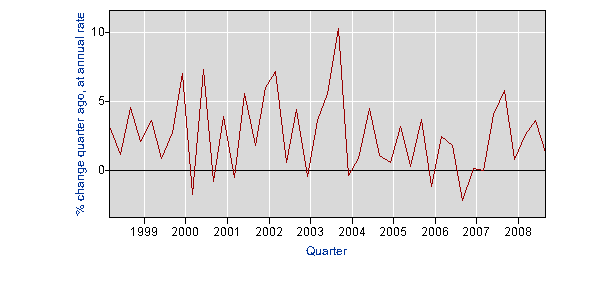 |
| Year | Qtr1 | Qtr2 | Qtr3 | Qtr4 | Annual |
|---|---|---|---|---|---|
| 1998 | 3.2 | 1.2 | 4.6 | 2.1 | 2.8 |
| 1999 | 3.6 | 0.9 | 2.8 | 7.0 | 2.9 |
| 2000 | -1.7 | 7.3 | -0.8 | 3.9 | 2.8 |
| 2001 | -0.5 | 5.6 | 1.8 | 6.0 | 2.5 |
| 2002 | 7.2 | 0.6 | 4.4 | -0.4 | 4.1 |
| 2003 | 3.6 | 5.6 | 10.3 | -0.3 | 3.7 |
| 2004 | 0.9 | 4.5 | 1.1 | 0.6 | 2.8 |
| 2005 | 3.2 | 0.3 | 3.7 | -1.1 | 1.8 |
| 2006 | 2.5 | 1.8 | -2.1 | 0.2 | 1.0 |
| 2007 | 0.0 | 4.1 | 5.8 | 0.8 | 1.4 |
| 2008 | 2.6 | 3.6 | 1.3 |