Skip all navigation and jump to content Jump to site navigation Jump to section navigation.
NASA Logo - Goddard Space Flight Center + Visit NASA.gov
HOME PROJECTS RESOURCES SEARCH MAP

+ Advanced Search
Home
Home
View Most Recently Released Imagery
View Gallery of Imagery: A topical collection of SVS Imagery
Search Imagery by the keywords assigned to it
Search Imagery by the instruments that supplied data for a visualization product
Search Imagery by the series of visualizations that have been produced
Search Imagery by the scientist providing the data used in a visualization product
Search Imagery by the animator that created the product
Search Imagery by the identification number assigned to the visualization product
See other search options
Learn about the SVS Image Server
  + About the Server
  + Animation List
  + How to Use the Server


  + RSS Feeds
blank image
Previous Animation
Next Animation
Tropical Storm Fay Inundates Florida

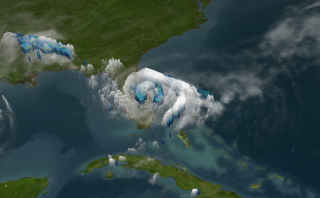
NASA's TRMM spacecraft observed this view of Tropical Storm Fay on August 20, 2008 at 0345Z as it crossed Florida. At this time the storm sustained winds of 45 knots (52 mph) and a pressure reading of 990 millibars. The storm stalled in this location for 24 hours and brought over 24 inches of rain to Eastern Florida. The cloud cover is taken by TRMM's Visible and Infrared Scanner(VIRS) and the GOES spacecraft. The rain structure is taken by TRMM's Tropical Microwave Imager (TMI) and TRMM's Precitation Radar(PR) instruments. TRMM looks underneath of the storm's clouds to reveal the underlying rain structure. Blue represents areas with at least 0.25 inches of rain per hour. Green shows at least 0.5 inches of rain per hour. Yellow is at least 1.0 inches of rain and red is at least 2.0 inches of rain per hour.

Tropical Storm Fay stalled over Eastern Florida dumping over 24 inches of rain. The blue region represents areas where the storm is dumping at least 0.25 inches of rain per hour and the green region is raining 0.5 inches of inches per hour.    Tropical Storm Fay stalled over Eastern Florida dumping over 24 inches of rain. The blue region represents areas where the storm is dumping at least 0.25 inches of rain per hour and the green region is raining 0.5 inches of inches per hour.
Duration: 28.0 seconds
Available formats:
  1280x720 (60 fps) Frames
  1280x720 (30 fps) Frames
  1280x720 (29.97 fps) MPEG-4   30 MB
  512x288 (30 fps) MPEG-1   3 MB
  3480x2160 TIFF         6 MB
  320x198     PNG           308 KB
  160x80       PNG           65 KB
  80x40         PNG           17 KB
How to play our movies


View the rain structure of Tropical Storm Fay. The blue region represents areas where the storm is dumping at least 0.25 inches of rain per hour. Green is 0.5 inches of rain per hour, yellow is 1.0 inches of rain and red is 2.0 inches of rain per hour.    View the rain structure of Tropical Storm Fay. The blue region represents areas where the storm is dumping at least 0.25 inches of rain per hour. Green is 0.5 inches of rain per hour, yellow is 1.0 inches of rain and red is 2.0 inches of rain per hour.

Available formats:
  3480 x 2160     TIFF 6 MB
  320 x 198         PNG 294 KB

Animation Number:3541
Animator:Lori Perkins (SVS) (Lead)
Completed:2008-08-08
Scientist:Scott Braun (NASA/GSFC)
Instruments:GOES
 TRMM/PR
 TRMM/TMI
 TRMM/VIRS
Data Collected:2005/10/20
Series:Hurricanes
 TRMM 3D Hurricanes
Keywords:
SVS >> HDTV
SVS >> Hurricane
DLESE >> Natural hazards
GCMD >> EARTH SCIENCE >> Atmosphere >> Atmospheric Phenomena >> Hurricanes
 
 
Please give credit for this item to
NASA/Goddard Space Flight Center Scientific Visualization Studio


Back to Top

USA.gov logo - the U.S. Government's official Web portal. + Privacy Policy and Important Notices
+ Reproduction Guidelines
NASA NASA Official:
SVS Contact:
Curator: