Tropical Storm Edouard
|
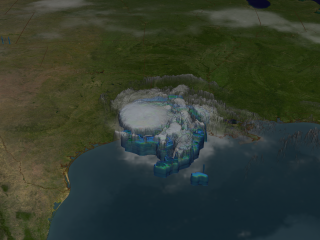
NASA's TRMM spacecraft observed this view of Tropical Storm Edouard on August 5, 2008 as it made landfall in Texas. At this time the storm sustained winds of 55 knots (63 mph). The cloud cover is taken by TRMM's Visible and Infrared Scanner(VIRS) and the GOES spacecraft. The rain structure is taken by TRMM's Tropical Microwave Imager (TMI) and TRMM's Precitation Radar(PR) instruments. TRMM looks underneath of the storm's clouds to reveal the underlying rain structure. Blue represents areas with at least 0.25 inches of rain per hour. Green shows at least 0.5 inches of rain per hour. Yellow is at least 1.0 inches of rain and red is at least 2.0 inches of rain per hour.
|
|

|
|
Tropical Storm Eduoard on August 5, 2008. Peer through the clouds to see the storms structure. The blue region represents areas where the storm is dumping at least 0.25 inches of rain per hour and the green region is raining 0.5 inches of inches per hour.
Duration: 28.0 seconds
Available formats:
1280x720 (29.97 fps)
MPEG-4
25 MB
2560x1920
TIFF
5 MB
1280x720 (60 fps)
Frames
320x240
PNG
359 KB
160x80
PNG
63 KB
80x40
PNG
16 KB
512x288 (30 fps)
MPEG-1
2 MB
How to play our movies
|
|

|
|
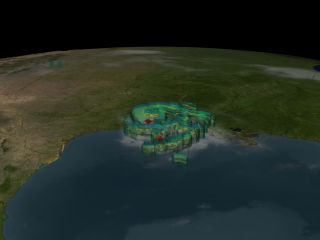
The blue region represents areas where the storm is dumping at least 0.25 inches of rain per hour. Green is 0.5 inches of rain per hour, yellow is 1.0 inches of rain and red is 2.0 inches of rain per hour.
Available formats:
2560 x 1920
TIFF
3 MB
320 x 240
PNG
269 KB
|
|
|
Back to Top
|

