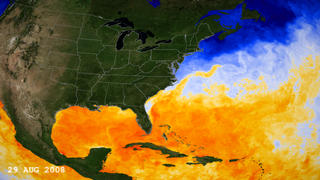
Current Sea Surface Temperatures Rising in the Gulf of Mexico
|
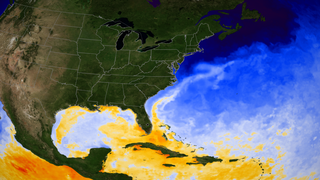
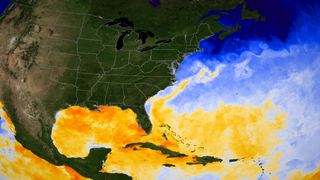
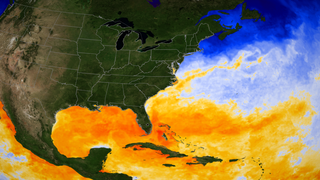
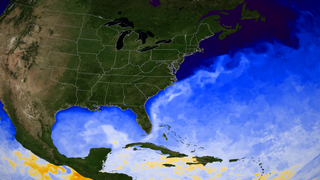
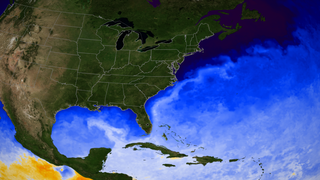
Sea surface temperatures in the Gulf of Mexico rise due to natural summer warming. These warm surface temperatures are a contributing factor to favorable conditions that can lead to the formation of tropical storms and hurricanes in the Gulf of Mexico and off the East Coast of the United States. In general, hurricanes tend to form over warm ocean water whose temperature is 82 degrees Fahrenheit (approximately 27.7 degrees Celsius) or higher. These areas are depicted in yellow, orange, and red. This blended microwave- and infrared-wavelength data was taken by the AMSR-E and MODIS instruments aboard the Aqua satellite, and the TMI instrument aboard the TRMM satellite. This animation updates every 24 hours.
|
|
|
|
This animation shows the progression of warm waters slowly filling the Gulf of Mexico (shown in yellow, orange, and red). This natural annual warming contributes to the possible formation of hurricanes in the Gulf. SST data shown here ranges from January 1 to the present.
Duration: 8.0 seconds
Available formats:
1280x720 (30 fps)
Frames (Images)
1280x720 (30 fps)
Frames (Dates)
1280x720 (30 fps)
MPEG-2
19 MB
640x480 (29.97 fps)
MPEG-1
18 MB
320x240 (29.97 fps)
MPEG-1
6 MB
2560x1920
TIFF
7 MB
320x180
PNG
294 KB
160x90
PNG
76 KB
80x45
PNG
19 KB
How to play our movies
|
|
|
|
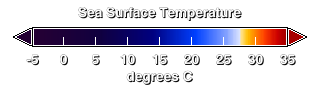
The legend for sea surface temperature. The color scale ranges from dark blue for areas below 15C to dark red for regions above 35C.
Available formats:
320 x 90
PNG
9 KB
|
|

|
|
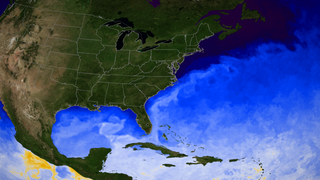
High definition version of sea surface temperature in the Gulf of Mexico and the Atlantic on 2008-01-01.
Available formats:
2560 x 1440
TIFF
3 MB
320 x 180
PNG
290 KB
|
|
|
|
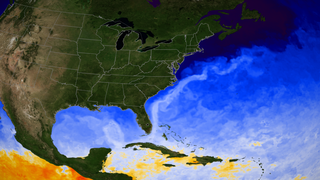
High definition version of sea surface temperature in the Gulf of Mexico and the Atlantic on 2008-02-01.
Available formats:
2560 x 1440
TIFF
3 MB
320 x 180
PNG
287 KB
|
|

|
|
High definition version of sea surface temperature in the Gulf of Mexico and the Atlantic on 2008-03-01.
Available formats:
2560 x 1440
TIFF
3 MB
320 x 180
PNG
288 KB
|
|

|
|
High definition version of sea surface temperature in the Gulf of Mexico and the Atlantic on 2008-04-01.
Available formats:
2560 x 1440
TIFF
3 MB
320 x 180
PNG
287 KB
|
|
|
|
High definition version of sea surface temperature in the Gulf of Mexico and the Atlantic on 2008-05-01.
Available formats:
2560 x 1440
TIFF
3 MB
320 x 180
PNG
289 KB
|
|
|
|
High definition version of sea surface temperature in the Gulf of Mexico and the Atlantic on 2008-06-01.
Available formats:
2560 x 1440
TIFF
4 MB
320 x 180
PNG
292 KB
|
|
|
|
High definition version of sea surface temperature in the Gulf of Mexico and the Atlantic on 2008-07-01.
Available formats:
2560 x 1440
TIFF
4 MB
320 x 180
PNG
295 KB
|
|
|
|
High definition version of sea surface temperature in the Gulf of Mexico and the Atlantic on 2008-08-01.
Available formats:
2560 x 1440
TIFF
4 MB
320 x 180
PNG
290 KB
|
|
|
Back to Top
|

