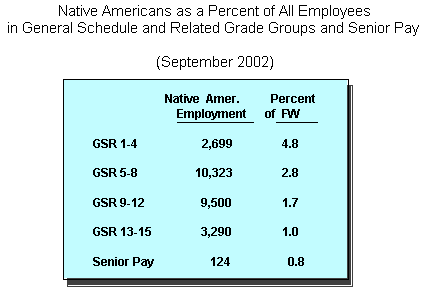
Native Americans represented 4.8 percent (2,699) of all employees in General Schedule and Related (GSR) grades 1 through 4. There were 606 Native American men and 2,093 Native American women at these grades in 2002. Native Americans in this grade group decreased by 41 since 2001.
Native Americans represented 2.8 percent (10,323) of all employees in GSR grades 5 through 8. There were 2,942 Native American men and 7,381 Native American women at these grades in 2002. Native Americans in this grade group increased by 307 since 2001.
Native Americans represented 1.7 percent (9,500) of all employees in GSR grades 9 through 12. There were 4,325 Native American men and 5,175 Native American women at these grades in 2002. Native Americans in this grade group increased by 260 since 2001.
Native Americans represented 1.0 percent (3,290) of all employees in GSR grades 13 through 15. There were 2,130 Native American men and 1,160 Native American women at these grades in 2002. Native Americans in this grade group increased by 118 since 2001.
Native Americans represented 0.8 percent (124) of all employees at the Senior Pay levels. There were 86 Native American men and 38 Native American women at these pay levels in 2002. Native Americans at Senior Pay levels increased by 4 since 2001.
|