 |
Flooding
|
 Brief Summary (20 Nov 1998 Update)
China suffered massive flooding concentrated in three areas during the 1998 summer: Along the Yangtze River in south central China; across extreme southern China in the area around the Gulf of Tonkin; and across the north near the former USSR border. The heaviest rainfall was reported at Qinzhou, with an incredible 68.28 inches of rain during the June-July period. According to official Chinese government reports, 3656 people have been killed by the floods, the second worst to hit the country in more than 130 years. Many observers believe the death toll is higher, although it is unlikely the casualty rate will reach 1954's level of 30,000 dead. The floods have left 14 million people homeless, affected 240 million people, destroyed 5 million houses, damaged 12 million houses, flooded 25 million hectares of farmland, and caused over $20 billion ($US) in estimated damages.
See the links under Additional Resources for more information.
 Images and Graphs
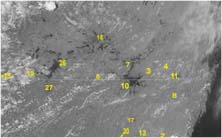
 400Kb Click on image for larger view. |
Figure 1 is a 1 km resolution image of the Yangtze River Basin taken by the NOAA-14 Polar-orbiting Operational Environmental Satellite (POES) on August 14, 1998. The numbers annotated on the image are correlated to precipitation totals for the June-July 1998 (see Table 1) period in descending order. All stations are in southeast China (WMO Blocks 53, 54, 57, 58, and 59). The satellite image does not include other areas where flooding has been a major problem; specifically, around the Gulf of Tonkin in the south, and in the Manchuria area across the north. Additional data are available in Tables 2, 3 and 4, which list rainfall data for southeast China during June 1998, July 1998, and the June-July 1998 period, respectively. Table 5 (2 mb file) provides the daily data for these stations for June-July (click here for format documentation, and here for a station ID list). |
 Figure 2 Click on image for larger view.
|
Figure 2 is a graph of the daily precipitation recorded at Qinzhou, near the Gulf of Tonkin, for June-July 1998. The precipitation plot shows several extreme rainfall episodes during the two-month period. For example, the greatest June event occurred over a three-day period with a total of over 12.00 inches, and the greatest one-day amount was over 9.00 inches. In July, there was an eight-day stretch of rain between the 2nd and the 9th when 29.18 inches of rain was recorded. Two tropical systems, Nichole and 01W, affected the extreme southern part of China during the month of July and contributed to the extraordinary rainfall amounts.
Figure 3 is another plot of daily precipitation for the city with the most precipitation in the Yangtze River basin, Jingdezhen, which reported 51.25 inches of precipitation. This station had a one-day total over 9.00 inches in June 1998; in July 1998, there was a ten-day period between the 17th and the 26th when 16.07 inches of rain was recorded. You can graph, plot and download data for over 250 stations in southeast China using our Global Summary of the Day WWW page. |
 Extreme Precipitation Table
Top 30 stations' rainfall amounts in southeast China for June-July 1998, in inches and hundredths. 'Days' indicates number of days with rainfall data for the 2 months. Lat/lon are in degrees and minutes; 'elev' is the elevation in meters. Ranking by rainfall amount (1-30) follows station name; stations with an * indicate they are not plotted in Figure 1 since they're outside the map area.
STATION  PRECIP DAYS  NAME                   LAT     LON      ELEV(M)
596320   68.28   61   QINZHOU (1)*           2157N   10837E   0006
587300   52.01   61   ZHENGHE (2)            2722N   11851E   0456
585270   51.25   61   JINGDEZHEN (3)         2918N   11712E   0060
584370   47.19   61   HUANG SHAN (MTNS)(4)   3008N   11809E   1836
575980   46.45   61   XIUSHUI (5)            2902N   11435E   0147
590580   43.29   61   MENGSHAN (6)*          2412N   11031E   0145
585060   42.36   61   LU SHAN (MOUNTAIN)(7)  2935N   11559E   1165
587310   41.89   61   PUCHENG (8)            2755N   11832E   0275
579570   41.47   61   GUILIN (9)*            2520N   11018E   0166
586060   39.91   61   NANCHANG (10)          2836N   11555E   0050
586330   36.15   61   QU XIAN (11)           2858N   11852E   0071
590870   36.10   61   FOGANG (12)*           2352N   11332E   0068
587250   35.52   61   SHAOWU (13)            2720N   11726E   0192
594560   34.16   61   XINYI (14)*            2221N   11056E   0084
576550   34.07   61   YUANLING (15)          2828N   11024E   0143
592090   33.91   61   NAPO (16)              2318N   10557E   0794
587150   33.30   61   NANCHENG (17)          2735N   11639E   0082
574940   32.52   61   WUHAN/NANHU (18)       3037N   11408E   0023
576620   32.29   61   CHANGDE (19)           2903N   11141E   0035
596730   32.26   61   SHANGCHUAN ISLAND (20)*2144N   11246E   0018
575540   31.64   61   SANGZHI (21)*          2924N   11010E   0322
596630   31.58   61   YANGJIANG (22)*        2152N   11158E   0022
592540   31.17   61   GUIPING (23)*          2324N   11005E   0044
590460   31.03   61   LIUZHOU (24)*          2421N   10924E   0097
574470   30.78   61   ENSHI (25)*            3017N   10928E   0458
575840   29.68   61   YUEYANG (26)           2923N   11305E   0052
576870   29.58   61   CHANGSHA (27)          2814N   11252E   0068
544970   29.18   61   DANDONG (28)           4003N   12420E   0014
594310   27.49   61   NANNING/WUXU (29)*     2249N   10821E   0073
588130   27.08   61   GUANGCHANG (30)        2651N   11620E   0142
 Additional Resources
NCDC Global Historical Climatology Network
NCDC Get/View On-Line Data Access Page
NESDIS Operational Significant Event Imagery Homepage
 Top of Page
http://lwf.ncdc.noaa.gov/oa/reports/chinaflooding/chinaflooding.html
Downloaded Saturday, 20-Sep-2008 06:03:25 EDT
Last Updated Thursday, 24-Aug-2006 11:51:15 EDT by Neal.Lott@noaa.gov, Tom.Ross@noaa.gov, Axel.Graumann@noaa.gov, Mark.Lackey@noaa.gov
Please see the NCDC Contact Page if you have questions or comments.
