|
 Global Analysis / Global Hazards / United States / U.S.
Drought / Extremes
Global Analysis / Global Hazards / United States / U.S.
Drought / Extremes
Use these links to
access detailed analyses of Global and U.S. data.

 Drought & Heat | Flooding | Storms | Tropical Cyclones | Extratropical Cyclones | Severe Winter Weather

| Severe to extreme drought was widespread
throughout much of the western United States. The most concentrated areas of extreme to exceptional drought classification were across the Northern Rockies and parts of New Mexico. |

larger image
|
| Long term drought continued across areas of Africa, including the Greater Horn and parts of the Southern Africa. Food shortages, caused by a number of factors including drought, affected Zimbabwe, Mozambique, Swaziland, Malawi, Zambia and Lesotho (WFP).
In Somalia, drought conditions in the Sool Plateau and Gebi Valley is reportedly the worst in living memory. Cumulative livestock losses have decimated herds, with pack camel mortality rates over 80 percent. Drought has particularly affected Somalia's nomadic inhabitants (OHCA). |

CAMS Rainfall Estimates
|

larger image
|
In Australia, rainfall during November was much below average across the eastern half of Queensland and over all of Tasmania. The statewide mean rainfall for November in Tasmania was the lowest on record since 1890 (Australian Bureau of Meteorology). More information can be found in the Bureau's November drought statement. |
|


larger image
|
In Indonesia, torrential rains caused flooding in a resort area near the capital of North Sumatra region, Medan. The flooding caused a large landslide, which affected the town of Bahorok on the 2nd. At least 151 people were killed, and the landslide was blamed partly on illegal logging in the area and the subsequent deforestation (AFP, Associated Press, BBC, OCHA). The flood destroyed dozens of guesthouses, restaurants and homes along the banks of the Bahorok River. |
Heavy rains struck the Muslim holy city of Mecca, Saudi Arabia, on the 10th. Flooding was widespread in the city, with water levels reportedly reaching as high as 6 meters (20 feet) in some areas. The flooding claimed 12 lives and injured 50 people (AFP).
| Thunderstorms developed in southern
California on the afternoon/evening of the 12th and produced
torrential downpours across parts of the Los Angeles area. More than 125 mm
(5 inches) of rain fell in just 2 hours in southern Los Angeles, producing
severe urban flooding. Small hail also accompanied the storms, accumulating
several inches deep in some areas of the city. Nearly 115,000 electrical
customers lost power as the storms affected the area (Associated Press).
|

Click for Animation (Courtesy UCAR)
|
Flooding affected the central Appalachians and Eastern Seaboard on the 19th, with some isolated 8-inch (200mm) rainfall totals across mountainous areas. There were 11 deaths caused by flooding in the region (Associated Press).

larger image
|
Heavy rains accentuated by the nearby passage of Typhoon Nepartak in the Gulf of Tonkin produced flooding throughout the central provinces of Vietnam during mid-November. Flooding and landslides claimed 61 lives in Vietnam and inundated over 32,000 houses (OCHA). Significant flooding was also observed in parts of the country last month. |
| Heavy rains in the Dominican Rebublic which began in mid-November produced significant flooding across northeastern and northwestern areas of the country. Flooding along the rivers Yaque del Nore and Yuna produced flooding that damaged homes, crops, and inundated more than 200,000 hectares (500,000 acres) of farmland. The floods displaced around 12,000 people and resulted in 9 deaths (IFRC). |

PDF document
|
For an archive of flood events worldwide, see the Dartmouth Flood Observatory.

| In the United States, severe thunderstorms produced a tornado near Darnestown, Maryland in Montgomery county. Wind damage was also reported in parts of northern Virginia and Maryland. |

larger image
|
Severe thunderstorms and several tornadoes accompanied a strong cold front through the southeastern United States during November 18-19.

larger image
|
Typhoon Melor developed in the western Pacific Ocean on October 30th as a tropical depression, reaching typhoon strength the next day. Melor struck the northern Philippines on the 1st, passing over the northern province of Isabela with maximum sustained winds near 140 km/hr (75 knots or 85 mph). The typhoon weakened to tropical storm strength as it passed just east of Taiwan on November 2-3, bringing locally heavy rains and gusty winds to the island.
|
| Typhoon Nepartak developed on the 12th in the Philippine Sea, and tracked through the Gulf of Tonkin during the 17th-18th. |
larger image
|

larger image
|
Nepartak reached maximum sustained winds of 140 km/hr (75 knots or 85 mph) as it skirted the west coast of Hainan on the 18th. Torrential rains produced flooding, especially through adjacent areas of Vietnam. In the Philippines, Nepartak was responsible for 4 deaths and loss of electricity to millions of people DisasterRelief.org
|
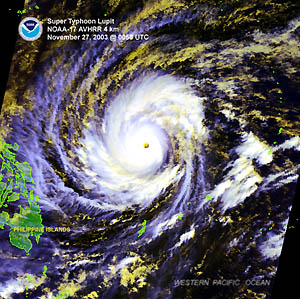
| Typhoon Lupit developed on the 19th in the western Pacific Ocean and passed through the Chuuk and Yap islands (Federated States of Micronesia) on the 23rd with maximum sustained winds near 175 km/hr (95 knots or 110 mph). The typhoon damaged or destroyed 200 homes and also damaged crops in northeastern and southern outlying islands (OCHA). Lupit increased in strength as it moved farther away over open ocean waters, finally weakening as it recurved well east of Japan. |
larger image
|

larger image
|
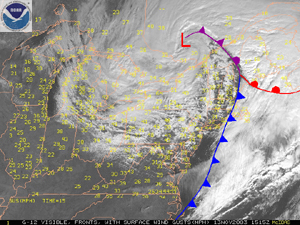
A strong storm system that moved across
the U.S. Great Lakes and into Quebec during the 12th-13th produced a variety of
weather impacts, including
severe
thunderstorms, strong winds and heavy snowfall. Winds gusting to 80-95 km/hr
(50-60 mph) across the Ohio Valley, Great Lakes, Northeast and Mid-Atlantic knocked out power to over 200,000 customers in the region (Associated Press). Heavy snows affected areas of southeastern Canada, including Quebec, while snow also fell downwind of the Great Lakes.
|

| While the eastern two-thirds of the United States was experiencing record-breaking warmth during early November, cold temperatures enveloped much of the northern Great Plains and Northern Rockies. Daily temperatures were more than 10°C (18°F) below normal across much of Montana and Wyoming. |

larger image
|

larger image
|
The first significant snowfall of the 2003-2004 winter season arrived early in November across parts of Montana, Wyoming and the Dakotas.
|
In the U.S. Pacific Northwest, strong winds on the 19th cut electricity service to around 67,000 homes and businesses in Washington and Oregon. The storm brought a rare November snowfall to the Seattle area, after 50mm (2 inches) of rain fell on the 18th (Reuters).
| Snow cover increased significantly across areas of Russia/Siberia during October-November, encouraged by below average temperatures across most of central Russia, Mongolia and and Kazakhstan during November 2003. |

Click for Animation
|
|
References:
Basist, A., N.C. Grody, T.C. Peterson and C.N. Williams, 1998: Using the Special Sensor Microwave/Imager to Monitor Land Surface Temperatures, Wetness, and Snow Cover. Journal of Applied Meteorology, 37, 888-911.
Peterson, Thomas C. and Russell S. Vose, 1997: An overview of the Global Historical Climatology Network temperature data base. Bulletin of the American Meteorological Society, 78, 2837-2849.
For all climate questions other than questions concerning this report, please contact the National Climatic Data Center's Climate Services Division:
Climate Services Division
NOAA/National Climatic Data Center
151 Patton Avenue, Room 120
Asheville, NC 28801-5001
fax: 828-271-4876
phone: 828-271-4800
email: ncdc.orders@noaa.gov
For more information, refer also to ...
Selected U.S. City and State Extremes
2003 Atlantic Hurricanes
2003 East Pacific Hurricanes
2003 U.S. Wildfire Summary
SSMI Derived Products
Global Historical Climatology Network (GHCN)
The Blended GHCN - SSM/I Product
The Global Temperature Anomalies
CLIMVIS - Global Summary of the Day
CAMS data provided by the Climate Prediction Center
Tropical Rainfall Measuring Mission (TRMM) - NASA
Geographic Reference Maps (pdf format)
For further information on the historical climate perspective presented in this report, contact:
Scott Stephens
NOAA/National Climatic Data Center
151 Patton Avenue
Asheville, NC 28801-5001
fax: 828-271-4328
email: Scott.Stephens@noaa.gov
-or-
Jay Lawrimore
NOAA/National Climatic Data Center
151 Patton Avenue
Asheville, NC 28801-5001
fax: 828-271-4328
email: Jay.Lawrimore@noaa.gov
 NCDC / Climate
Monitoring / Climate
of 2003 / Hazards / Search / Help NCDC / Climate
Monitoring / Climate
of 2003 / Hazards / Search / Help
http://lwf.ncdc.noaa.gov/oa/climate/research/2003/nov/hazards.html
Downloaded Saturday, 20-Sep-2008 00:30:16 EDT
Last Updated Friday, 18-Nov-2005 14:12:15 EST by Scott.Stephens@noaa.gov
Please see the NCDC Contact Page if you have questions or comments.
|


