

|
CONTACT: Media Interviews (415) 975-4373 (415) 975-4405 Internet address: http://www.bls.gov/ro9/news.htm Fax-On-Demand (415) 975-4567 - Code: # (9690) |
BLS 02-96 |
FATAL OCCUPATIONAL INJURIES IN THE PACIFIC STATES, 2001
Job-related fatal injuries in the Pacific states1 totaled 761 in 2001 accounting for just under 13 percent of the 5,900 fatalities that occurred nationwide2, according to the Census of Fatal Occupational Injuries conducted by the Bureau of Labor Statistics of the U.S. Department of Labor. Regional Commissioner Stanley P. Stephenson noted that, over the year, the number of fatal work injuries in the Pacific division increased by 8, or 1.1 percent; at the same time, overall employment increased 0.4 percent in the five-state area in 2001. Nationally, on-the-job fatal injuries were down slightly in 2001, declining less than 1 percent.
State and metropolitan area highlights
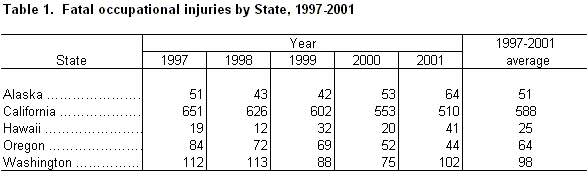
Overall, the number of fatal work injuries in the Pacific states was highest in California (510), the state with the largest workforce in the region. Among the other four states in the division, Washington had 102 job-related fatalities in 2001; Alaska, 64; Oregon, 44; and Hawaii, 41. Three states recorded an increase in fatal work injuries over the year--Washington (27), Hawaii (21), and Alaska (11). Washington’s increase reversed a two-year decline in its fatality count, while the number of fatalities in Hawaii exceeded 40 for the first time since collection of these data began in 1992. In the other two states, California reported 43 fewer deaths and Oregon, 8. (See table 1.)
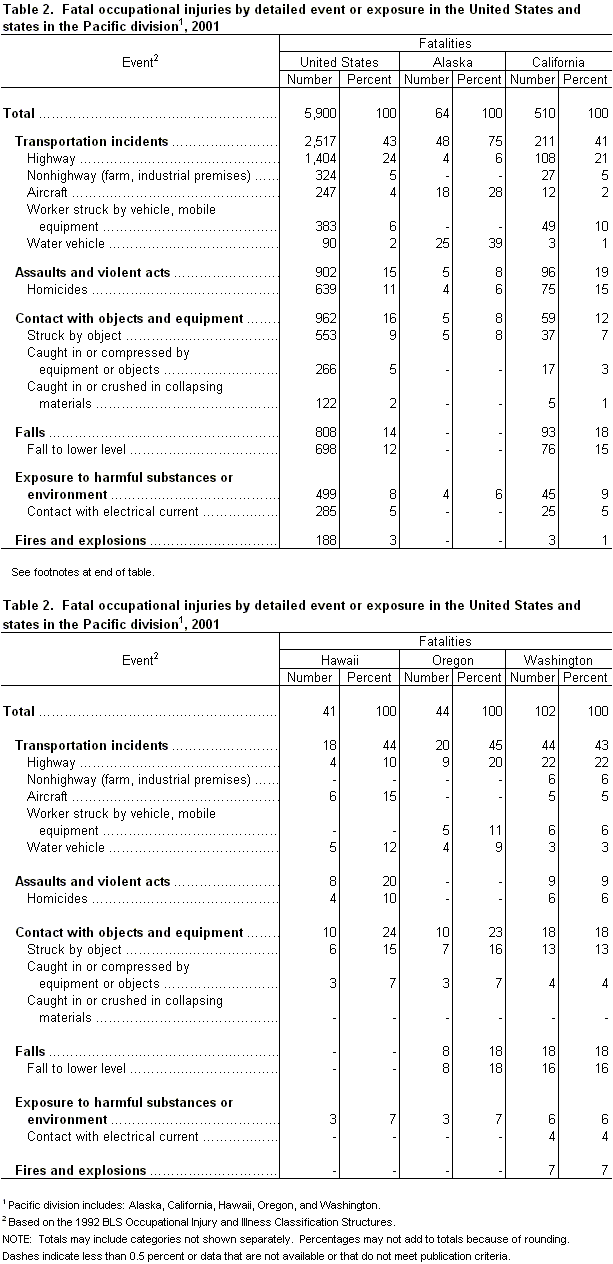
In the Pacific division, the leading cause of fatal work-related injuries varied across the five states. As was the case nationally, highway crashes accounted for the largest percentage of on-the-job fatalities in Washington (22 percent), California (21 percent), and Oregon (20 percent). Water vehicle accidents accounted for the largest share of fatal occupational injuries in Alaska at 39 percent, while aircraft accidents and workers struck by objects each comprised the largest share of workplace fatalities in Hawaii at 15 percent. In the United States, highway crashes accounted for 24 percent of all fatal work injuries; falls to a lower level made up 12 percent; homicides, 11 percent; and workers struck by objects, 9 percent. Only 4 percent of fatal occupational injuries were the result of aircraft accidents nationally and 2 percent were caused by water vehicle accidents. (See table 2.)
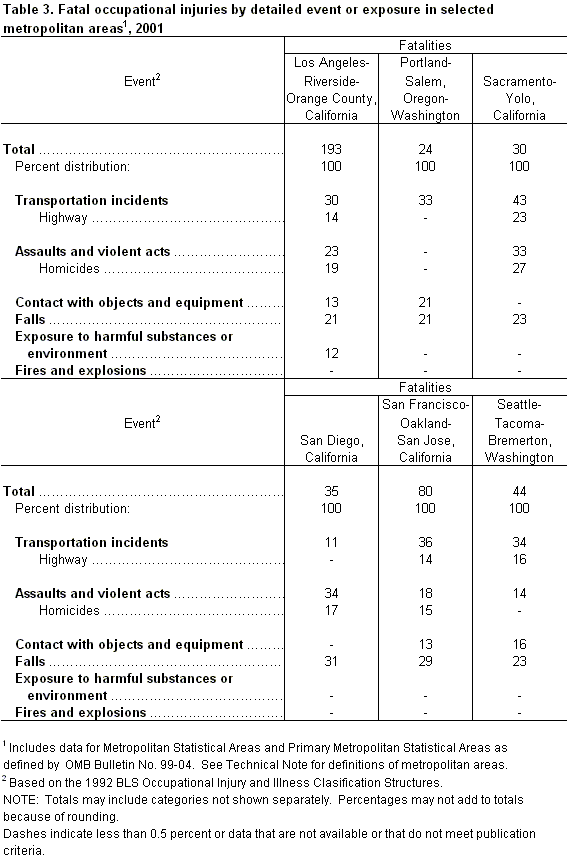
Fatal workplace injury data for 2001 are also available for six Consolidated Metropolitan Statistical Areas (CMSAs) in the Pacific states--Los Angeles-Riverside-Orange County, Calif.; Portland-Salem, Ore.-Wash.; Sacramento-Yolo, Calif.; San Diego, Calif.; San Francisco-Oakland-San Jose, Calif.; and Seattle-Tacoma-Bremerton, Wash. (See table 3.) Workplace homicides constituted a higher percentage of fatal work injuries in Sacramento (27 percent), Los Angeles (19 percent), San Diego (17 percent), and San Francisco (15 percent) than they did for the nation as a whole (11 percent). Conversely, highway crashes in Seattle (16 percent), Los Angeles (14 percent), and San Francisco (14 percent) accounted for a smaller percentage of fatal work injuries than it did at the national level (24 percent).
1The Pacific states referenced in this release
correspond to the Census definition for the Pacific division and include Alaska,
California, Hawaii, Oregon, and Washington.
2When the 2,886 fatalities
(homicides) from the terrorists attacks on September 11th are
included in the overall count, there were 8,786 fatal work injuries reported in
the United States in 2001.
Industry characteristics
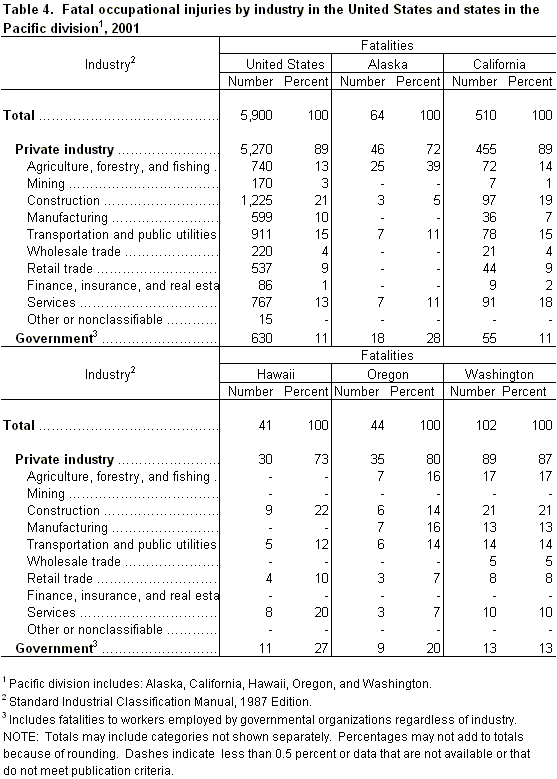
The construction industry recorded the highest percentage of fatal work injuries in the nation at 21 percent. Three states in the Pacific division had close to or equaled the percentage of fatalities occurring in the construction industry nationally--California (19 percent), Washington (21 percent), and Hawaii (22 percent). (See table 4.) Transportation and public utilities accounted for 15 percent of national workplace fatalities; all five Pacific states matched or fell not far below this percentage. The agriculture, forestry, and fishing industry and the services industry both accounted for 13 percent of the total fatalities nationwide. In the Pacific states, agriculture, forestry, and fishing far exceeded the national share in Alaska making up 39 percent of all fatalities, the highest industry concentration in the State. In services, both Hawaii (20 percent) and California (18 percent) had a higher than average proportion of fatalities.
Manufacturing accounted for 10 percent of fatal work injuries nationwide; both Oregon (16 percent) and Washington (13 percent) surpassed the U.S. share while California fell below (7 percent). Elsewhere, the percentage of worker fatalities in the public sector, which includes federal, state and local government, was similar to the national share of 11 percent in California and Washington but considerably higher in the remaining Pacific states--Alaska (28 percent), Hawaii (27 percent), and Oregon (20 percent).
Worker profile
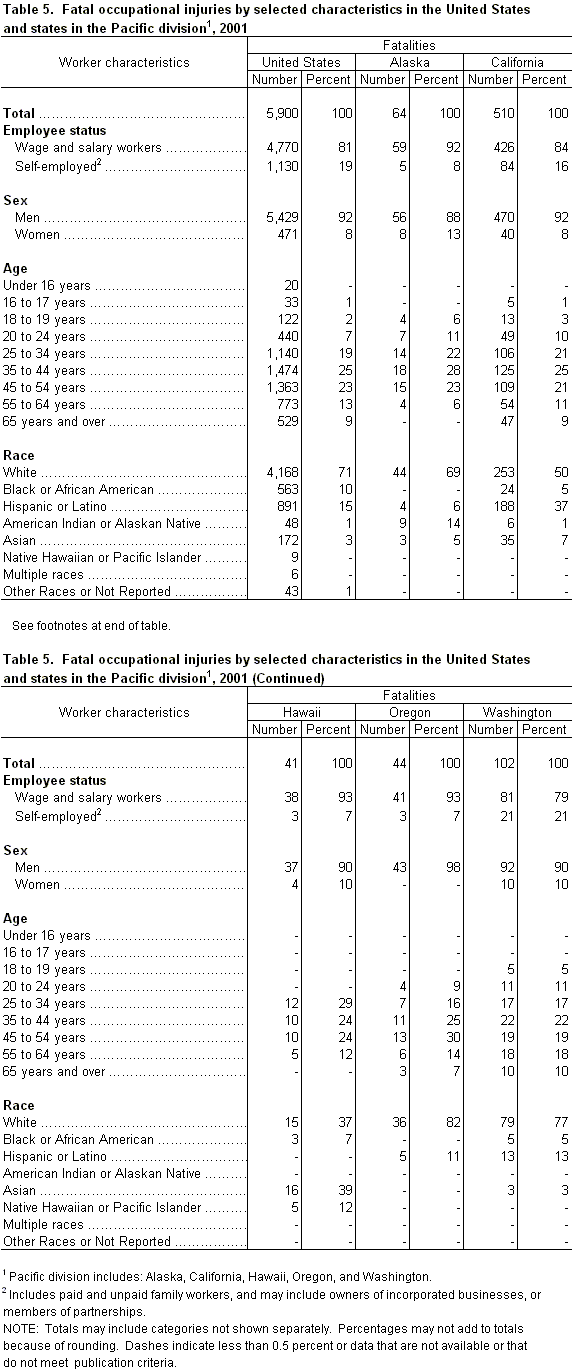
Nationally, 67 percent of all fatal work injuries occurred among prime age workers, those 25 to 54 years old. Across the five Pacific states, the distribution of workplace fatalities in this age group ranged from 58 percent in Washington to 77 percent in Hawaii. Among the oldest workers, those 55 and over, four states—Alaska, California, Hawaii, and Oregon—had a smaller percentage of fatalities in this age bracket than did the nation as a whole (22 percent). (See table 5.)
Men suffered work-related fatal injuries more often than their share of employment would suggest. Nationally, 92 percent of those fatally injured on the job were men. Among the five states in the Pacific, only Oregon was above the national average at 98 percent. The percentage of workers killed on the job who were of Hispanic origin in California was 37 percent, much higher than the national average of 15 percent. However, workers of Hispanic origin represented 11 percent of those employed nationally but 28 percent of those working in California. Injuries to Asian workers accounted for 39 percent of work-related fatalities in Hawaii and 7 percent of on-the-job fatalities in California, compared to just 3 percent nationally. Asian workers also made up a larger percentage of the workforce in these two states than they did for the nation as a whole.
Technical Note
Data in this release are from the Census of Fatal Occupational Injuries (CFOI), part of the BLS occupational safety and health statistics program. For a fatality to be included in the census, the decedent must have been employed (that is working for pay, compensation, or profit) at the time of the event, engaged in a legal work activity, or present at the site of the incident as a requirement of his or her job. (Fatalities that occur during a person’s commute to or from work are excluded from the census counts.)
CFOI data provide the most complete count of fatal work injuries available because the program uses diverse state and federal data sources to identify, verify, and profile fatal work injuries. Information about each workplace fatality (occupation and other worker characteristics, equipment being used, circumstances of the event) is obtained by cross-referencing source documents, such as death certificates, workers’ compensation records, reports to federal and state agencies, police reports, and new reports. Multiple sources are used because studies have shown that no single source captures all on-the-job fatalities. Source documents are matched so that each fatality is counted only once. To ensure that a fatality occurred while the decedent was at work, information is verified from two or more independent source documents, or from a source document and a follow-up questionnaire. Approximately 30 data elements are collected, coded, and tabulated, including information about the worker, the fatal incident, and the machinery or equipment involved. This method assures counts are as complete and accurate as possible.
States may identify additional fatal work injuries after data collection closeout for a reference year. In addition, other fatalities excluded from the published count because of insufficient information to determine work relationship may subsequently be verified as work related. States have up to one year to update their initial published state counts. This procedure ensures that fatality data are disseminated as quickly as possible and that no legitimate case is excluded from the counts. Thus, each year's report should be considered preliminary until the next year's data are issued. Increases in the published counts based on additional information have averaged less than 100 fatalities per year or less than 1.5 percent of the total. The BLS news release issued August 14, 2001 reported a total of 5,915 fatal work injuries for 2000. Since then, an additional 5 fatal work injuries were identified, bringing the total for 2000 to 5,920.
This is the tenth year that the fatality census has been conducted in all 50 states and the District of Columbia. The BLS fatality census is a federal/state cooperative venture in which costs are shared equally. Additional state-specific data are available from the Pacific State agencies, listed below, participating with BLS in the census program. Metropolitan area data is also available from their respective state agencies. Areas included in this release are: Los Angeles-Riverside-Orange Co., Calif. consisting of Los Angeles, Orange, Riverside, San Bernardino, and Ventura Counties; Portland-Salem, Ore.-Wash. consisting of Clackamas, Columbia, Marion, Multnomah, Polk, Washington, and Yamhill Counties in Ore. and Clark County Wash.; Sacramento-Yolo, Calif. consisting of El Dorado, Placer, Sacramento, and Yolo Counties; San Diego, Calif. consisting of San Diego County; San Francisco-Oakland-San Jose, Calif. consisting of Alameda, Contra Costa, Marin, Napa, Santa Clara, Santa Cruz, San Francisco, San Mateo, Solano, and Sonoma Counties; and Seattle-Tacoma-Bremerton, Wash. consisting of Island, King, Kitsap, Pierce, Snohomish, and Thurston Counties.
State agencies
Telephone Alaska Department of Labor and Workforce Development (907) 465-5883California Department of Industrial Relations (415) 703-4757
Hawaii Department of Labor and Industrial Relations (808) 586-9001
Oregon Department of Consumer and Business Services (503) 947-7051
Washington State Department of Labor and Industries (360) 902-5510
CFOI includes data for all fatal work injuries, whether they are covered by the Occupational Safety and Health Administration (OSHA) or other Federal or state agencies or are outside the scope of regulatory coverage. BLS thanks the participating states for their efforts in collecting accurate, comprehensive, and useful data on fatal work injuries. BLS also appreciates the efforts of all federal, state, local and private sector agencies that submitted source documents used to identify fatal work injuries.
Last Modified Date: December 30, 2002