Ocean Surface Topography Mission/Jason 2 Begins Mapping Oceans
Research by Project Manager: Parag Vaze, Deputy Project Manager: Ralph Basilio, and Project Scientist: Lee-Lueng Fu
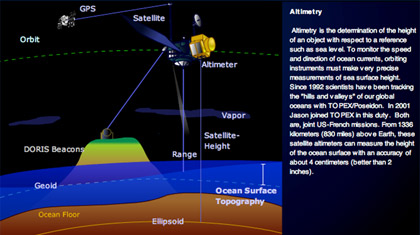
Less than a month after launch, the NASA-French space agency Ocean Surface Topography Mission (OSTM)/Jason-2 oceanography satellite has produced its first complete maps of global ocean surface topography, surface wave height and wind speed.
The satellite's first radar altimeter data were acquired just 48 hours after its launch on June 20 from Vandenberg Air Force Base, Calif., on a Delta II rocket. The French space agency processed the first test results, followed by more advanced data results a week after launch. The more advanced results came after calculating the precise location of the satellite's preliminary orbits. The satellite, its instruments and ground segment are all functioning properly. Once it has been fully calibrated and validated, the satellite will begin providing oceanographic products to users around the world.
Implications
Earth's oceans are the greatest influence on global climate. Only from space can we observe our vast oceans on a global scale and monitor critical changes in ocean currents and heat storage. Continuous data from satellites like TOPEX/Poseidon and Jason help us understand and foresee the effects of the changing oceans on our climate and on catastrophic climate events such as El Nino and La Nina.
Significance to Solar System Exploration
Our home, the Earth, experiences some of the most varied and interesting weather in the Solar System. This is because the Earth is actually a water-world, with some 70% of its surface covered by a vast, deep ocean. The world-ocean is a huge sink for solar energy. Through currents the ocean transports this energy as heat, and releases it back into the atmosphere as water vapor, which is then returned back to the oceans and land as rain or snow. This completes the hydrologic cycle. By understanding Earth's cycle, we can better understand hydrologic cycles on other planets and moons throughout our Solar System.
Science Features
NASA Science Highlights
Astrobiology Features
Power & Propulsion Features
Astronomy Features
Science & Technology Reports
Technology Features