

|
FOR FURTHER INFORMATION: |
FOR RELEASE: |
|
CONSUMER PRICE INDEX FOR DENVER-BOULDER-GREELEY, CO
Prices increase 3.7 percent from the first half of 2007 to the first half of 2008
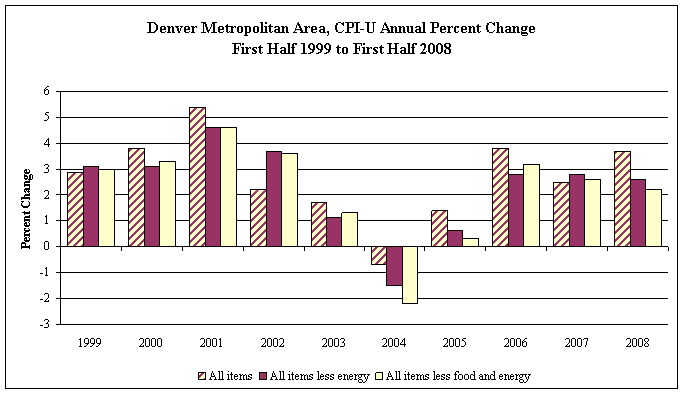
The Consumer Price Index for All Urban Consumers (CPI-U) for the Denver metropolitan area increased 3.7 percent from the first half of 2007 to the first half of 2008, the Bureau of Labor Statistics reported today. According to Regional Commissioner Stanley W. Suchman, while costs in all eight major expenditure categories were up over the period, over one-third of the increase in the overall index was attributable to advances in the transportation index.
Energy prices, which include prices for motor fuel and household fuels, rose 19.0 percent from one year ago after declining 0.6 percent from the first half of 2006 to the first half of 2007. Excluding the impact of energy prices, the CPI for Denver rose 2.6 percent from the first half of 2007 to the first half of 2008.
The transportation index, led by accelerating motor fuel prices, had the greatest impact on the overall index. Transportation costs advanced 8.7 percent from the first half of 2007 to the first half of 2008 following an increase of 0.9 percent in the same period one year ago. Private transportation costs, which include prices for vehicles and motor fuel, rose 8.4 percent over the year. Motor fuel prices in the Denver metropolitan area climbed 24.8 percent from the first half of 2007 to the first half of 2008, following a 5.9 percent increase over the same period one year ago.
The housing index rose 1.7 percent largely due to the advance in the shelter component. Shelter costs increased 1.6 percent, as rent of primary residence was up 2.0 percent and owners' equivalent rent of primary residence increased 0.2 percent. Higher prices for lodging away from home also contributed to the gain in shelter costs. Prices for fuels and utilities advanced 7.5 percent from the first half of 2007 to the first half of 2008. Within fuels and utilities, electricity costs rose 4.2 percent over the year and the index for utility (piped) gas service increased 17.4 percent. Prices for household furnishings and operations declined 3.0 percent over the period.
The food and beverages index increased 4.1 percent from the first half of 2007 to the first half of 2008 primarily as a result of rising costs for food at home. Food at home prices advanced 5.7 percent, the cost of food away from home was up 3.4 percent, and prices for alcoholic beverages rose 1.3 percent over the period.
The remaining five major expenditure categories each accounted for less than ten percent of the increase in the overall index. Costs for medical care advanced 5.8 percent from the first half of 2007 to the first half of 2008. Recreation prices, which include admissions to movies, concerts, and sporting goods, rose 3.1 percent. The apparel index increased 4.3 percent over the year and education and communication costs were up 1.3 percent. The index for other goods and services, which includes tobacco and smoking products and personal care items, rose 2.5 percent over the period.
The Denver CPI-U stood at 208.741 for the first half of 2008. This means that a market basket of goods and services that cost $100.00 during the 1982-84 base period cost $208.74 during the first half of 2008. Because metropolitan area CPI data are not adjusted for seasonal price variation, consumers and businesses should be cautious in drawing conclusions about long-term retail price trends from short-term changes in the area indexes.
_______________________________________________________________________________________________
Information in this release will be made available to sensory impaired individuals upon request.
Voice phone: 202-691-5200;
TDD message referral phone number (Federal Relay Service):
1-800-877-8339.
_______________________________________________________________________________________________
  Consumer Price Index for All Urban Consumers (CPI-U): Indexes for semiannual averages and percent changes
  for selected periods

  Denver-Boulder-Greeley, CO  (1982-84=100 unless otherwise noted)


                                                     Semiannual average indexes        Percent change to
                                                                                      1st half 2008 from-
                 Item and Group
                                                  1st half    2nd half    1st half
                                                    2007        2007        2008      1st half    2nd half
                                                                                        2007        2007

              Expenditure category

  All items....................................    201.258     202.799     208.741         3.7         2.9
  All items (1967=100).........................    671.112     676.250     696.062           -           -

   Food and beverages..........................    190.844     193.495     198.694         4.1         2.7
    Food.......................................    192.812     195.709     201.300         4.4         2.9
     Food at home..............................    195.093     198.286     206.180         5.7         4.0
     Food away from home.......................    188.429     190.746     194.831         3.4         2.1
    Alcoholic beverages........................    177.159     177.959     179.526         1.3          .9

   Housing.....................................    189.463     187.856     192.726         1.7         2.6
    Shelter....................................    207.470     208.567     210.836         1.6         1.1
     Rent of primary residence.................    197.545     197.873     201.535         2.0         1.9
     Owners' equivalent rent of primary
         residence (1) ........................    205.861     204.749     206.194          .2          .7
    Fuels and utilities........................    189.868     176.639     204.087         7.5        15.5
     Household energy..........................    146.281     132.685     162.211        10.9        22.3
      Gas (piped) and electricity..............    145.203     131.385     160.559        10.6        22.2
       Electricity.............................    123.427     119.364     128.589         4.2         7.7
       Utility (piped) gas service.............    186.627     160.697     219.193        17.4        36.4
    Household furnishings and operations.......    129.497     124.155     125.553        -3.0         1.1

   Apparel.....................................     99.061      99.748     103.331         4.3         3.6

   Transportation..............................    215.548     223.280     234.245         8.7         4.9
    Private transportation.....................    212.443     219.836     230.264         8.4         4.7
     Motor fuel................................    217.329     238.771     271.312        24.8        13.6
      Gasoline (all types).....................    216.402     237.751     269.589        24.6        13.4
       Gasoline, unleaded regular (2)..........    214.015     235.052     267.401        24.9        13.8
       Gasoline, unleaded midgrade (2) (3).....    204.516     224.526     253.554        24.0        12.9
       Gasoline, unleaded premium (2)..........    215.531     237.364     266.502        23.6        12.3

   Medical care................................    400.579     405.130     423.776         5.8         4.6

   Recreation (4)..............................    122.420     125.918     126.174         3.1          .2

   Education and communication (4).............    110.175     110.703     111.570         1.3          .8

   Other goods and services....................    304.913     301.431     312.664         2.5         3.7

           Commodity and service group

  All items....................................    201.258     202.799     208.741         3.7         2.9
   Commodities.................................    156.532     159.024     163.771         4.6         3.0
    Commodities less food and beverages........    138.248     140.630     145.097         5.0         3.2
     Nondurables less food and beverages.......    163.603     169.025     178.221         8.9         5.4
     Durables..................................    113.456     113.057     112.888         -.5         -.1
   Services....................................    239.086     239.539     246.453         3.1         2.9

            Special aggregate indexes

  All items less medical care..................    191.580     192.999     198.443         3.6         2.8
  All items less shelter.......................    199.401     201.266     208.784         4.7         3.7
  Commodities less food........................    139.760     142.046     146.387         4.7         3.1
  Nondurables..................................    177.769     181.832     189.122         6.4         4.0
  Nondurables less food........................    164.083     168.990     177.537         8.2         5.1
  Services less rent of shelter (1) ...........    285.079     285.031     298.761         4.8         4.8
  Services less medical care services..........    224.956     225.221     231.196         2.8         2.7
  Energy.......................................    178.399     181.413     212.339        19.0        17.0
  All items less energy........................    204.132     205.422     209.366         2.6         1.9
   All items less food and energy..............    206.591     207.563     211.161         2.2         1.7

    1 Index is on a November 1982=100 base.
    2 Special index based on a substantially smaller sample.
    3 Indexes on a December 1993=100 base.
    4 Indexes on a December 1997=100 base.
    - Data not available.
  NOTE: Index applies to a month as a whole, not to any specific date.


  Consumer Price Index for Urban Wage Earners and Clerical Workers (CPI-W):Indexes for semiannual averages
  and percent changes for selected periods

  Denver-Boulder-Greeley, CO  (1982-84=100 unless otherwise noted)


                                                     Semiannual average indexes        Percent change to
                                                                                      1st half 2008 from-
                 Item and Group
                                                  1st half    2nd half    1st half
                                                    2007        2007        2008      1st half    2nd half
                                                                                        2007        2007


              Expenditure category

  All items....................................    193.585     194.819     201.124         3.9         3.2
  All items (1967=100).........................    644.352     648.459     669.447           -           -

   Food and beverages..........................    191.577     194.358     199.964         4.4         2.9
    Food.......................................    193.634     196.572     202.522         4.6         3.0
     Food at home..............................    194.754     197.866     206.174         5.9         4.2
     Food away from home.......................    190.350     192.956     196.746         3.4         2.0
    Alcoholic beverages........................    181.808     183.108     184.260         1.3          .6

   Housing.....................................    183.055     180.345     185.442         1.3         2.8
    Shelter....................................    197.414     197.307     199.463         1.0         1.1
     Rent of primary residence.................    197.545     197.873     201.535         2.0         1.9
     Owners' equivalent rent of primary
         residence  (1)........................    192.181     191.143     192.492          .2          .7
    Fuels and utilities........................    186.935     173.492     201.201         7.6        16.0
     Household energy..........................    145.790     132.092     161.594        10.8        22.3
      Gas (piped) and electricity..............    145.730     131.841     161.234        10.6        22.3
       Electricity.............................    123.426     119.364     128.589         4.2         7.7
       Utility (piped) gas service.............    186.628     160.698     219.195        17.5        36.4
    Household furnishings and operations.......    133.978     127.617     129.158        -3.6         1.2

   Apparel.....................................     91.658      94.522      99.783         8.9         5.6

   Transportation..............................    213.127     222.035     231.963         8.8         4.5
    Private transportation.....................    210.589     219.401     228.988         8.7         4.4
     Motor fuel................................    217.297     238.736     271.268        24.8        13.6
      Gasoline (all types).....................    216.399     237.748     269.585        24.6        13.4
       Gasoline, unleaded regular (2)..........    214.019     235.057     267.406        24.9        13.8
       Gasoline, unleaded midgrade (2) (3).....    204.516     224.526     253.554        24.0        12.9
       Gasoline, unleaded premium (2)..........    215.561     237.397     266.539        23.6        12.3

   Medical care................................    398.456     403.098     423.167         6.2         5.0

   Recreation (4)..............................    112.146     114.859     115.011         2.6          .1

   Education and communication (4).............    112.304     111.652     112.064         -.2          .4

   Other goods and services....................    306.889     302.802     314.058         2.3         3.7

           Commodity and service group

  All items....................................    193.585     194.819     201.124         3.9         3.2
   Commodities.................................    159.082     162.132     167.804         5.5         3.5
    Commodities less food and beverages........    138.819     141.897     147.390         6.2         3.9
     Nondurables less food and beverages.......    171.292     178.587     191.296        11.7         7.1
     Durables..................................    107.250     105.790     105.765        -1.4          .0
   Services....................................    229.491     228.722     235.503         2.6         3.0

            Special aggregate indexes

  All items less medical care..................    185.155     186.272     192.152         3.8         3.2
  All items less shelter.......................    194.733     196.615     204.692         5.1         4.1
  Commodities less food........................    140.371     143.371     148.757         6.0         3.8
  Nondurables..................................    184.738     190.037     199.358         7.9         4.9
  Nondurables less food........................    171.805     178.643     190.663        11.0         6.7
  Services less rent of shelter  (1)...........    263.210     261.695     275.010         4.5         5.1
  Services less medical care services..........    216.032     215.035     220.992         2.3         2.8
  Energy.......................................    187.336     191.326     223.597        19.4        16.9
  All items less energy........................    194.572     195.360     199.225         2.4         2.0
   All items less food and energy..............    195.710     196.053     199.457         1.9         1.7

    1 Index is on a November 1984=100 base.
    2 Special index based on a substantially smaller sample.
    3 Indexes on a December 1993=100 base.
    4 Indexes on a December 1997=100 base.
    - Data not available.
  NOTE: Index applies to a month as a whole, not to any specific date.
Last Modified Date: August 14, 2008