

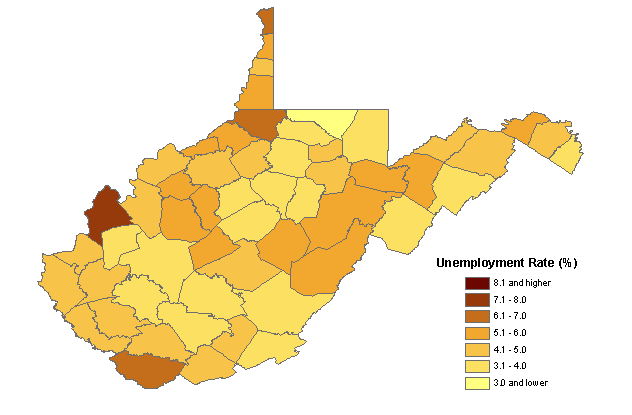
Unemployment Rates by County in West Virginia, July 2008
| Area | July 2007 | July 2008 | Net Change |
|---|---|---|---|
United States |
4.9 | 6.0 | 1.1 |
West Virginia |
4.6 | 4.2 | -0.4 |
Barbour County, WV |
5.5 | 4.2 | -1.3 |
Berkeley County, WV |
4.1 | 4.9 | 0.8 |
Boone County, WV |
4.9 | 3.8 | -1.1 |
Braxton County, WV |
5.0 | 4.0 | -1.0 |
Brooke County, WV |
5.8 | 5.6 | -0.2 |
Cabell County, WV |
4.3 | 4.2 | -0.1 |
Calhoun County, WV |
6.2 | 5.5 | -0.7 |
Clay County, WV |
7.0 | 5.7 | -1.3 |
Doddridge County, WV |
4.4 | 4.2 | -0.2 |
Fayette County, WV |
4.9 | 4.0 | -0.9 |
Gilmer County, WV |
4.1 | 3.8 | -0.3 |
Grant County, WV |
5.1 | 5.2 | 0.1 |
Greenbrier County, WV |
4.4 | 3.9 | -0.5 |
Hampshire County, WV |
3.6 | 4.2 | 0.6 |
Hancock County, WV |
5.7 | 6.2 | 0.5 |
Hardy County, WV |
4.5 | 3.9 | -0.6 |
Harrison County, WV |
4.2 | 3.6 | -0.6 |
Jackson County, WV |
4.8 | 4.5 | -0.3 |
Jefferson County, WV |
3.5 | 3.6 | 0.1 |
Kanawha County, WV |
3.9 | 3.3 | -0.6 |
Lewis County, WV |
4.7 | 3.7 | -1.0 |
Lincoln County, WV |
5.6 | 4.6 | -1.0 |
Logan County, WV |
5.5 | 4.2 | -1.3 |
Marion County, WV |
4.1 | 3.4 | -0.7 |
Marshall County, WV |
5.1 | 5.1 | 0.0 |
Mason County, WV |
7.5 | 7.4 | -0.1 |
McDowell County, WV |
8.6 | 6.6 | -2.0 |
Mercer County, WV |
4.4 | 4.3 | -0.1 |
Mineral County, WV |
4.6 | 4.7 | 0.1 |
Mingo County, WV |
6.5 | 4.5 | -2.0 |
Monongalia County, WV |
3.2 | 2.5 | -0.7 |
Monroe County, WV |
4.4 | 4.0 | -0.4 |
Morgan County, WV |
4.9 | 5.2 | 0.3 |
Nicholas County, WV |
4.9 | 4.1 | -0.8 |
Ohio County, WV |
4.4 | 4.2 | -0.2 |
Pendleton County, WV |
4.0 | 3.9 | -0.1 |
Pleasants County, WV |
5.1 | 5.8 | 0.7 |
Pocahontas County, WV |
6.8 | 5.9 | -0.9 |
Preston County, WV |
4.1 | 3.4 | -0.7 |
Putnam County, WV |
3.7 | 3.1 | -0.6 |
Raleigh County, WV |
4.5 | 3.8 | -0.7 |
Randolph County, WV |
4.8 | 5.1 | 0.3 |
Ritchie County, WV |
4.6 | 4.8 | 0.2 |
Roane County, WV |
6.5 | 5.5 | -1.0 |
Summers County, WV |
5.1 | 4.1 | -1.0 |
Taylor County, WV |
4.7 | 4.3 | -0.4 |
Tucker County, WV |
5.8 | 5.4 | -0.4 |
Tyler County, WV |
6.5 | 5.7 | -0.8 |
Upshur County, WV |
4.4 | 3.9 | -0.5 |
Wayne County, WV |
4.7 | 4.8 | 0.1 |
Webster County, WV |
6.0 | 5.2 | -0.8 |
Wetzel County, WV |
7.0 | 6.7 | -0.3 |
Wirt County, WV |
5.8 | 6.0 | 0.2 |
Wood County, WV |
4.6 | 4.8 | 0.2 |
Wyoming County, WV |
6.6 | 5.0 | -1.6 |
NOTE: Rates shown are a percentage of the labor force. Data refer to place of residence. State and county data for both the current and prior year are subject to revision early in the following calendar year. County data for 2007 reflect revised inputs, reestimation, and new statewide controls.
Last Modified Date: September 05, 2008
Quick Links
Tools |
Calculators |
Help |
Info |