

National Climatic Data Center
15 April 2008
The data presented in this report are preliminary. Ranks and anomalies may change as more complete data are received and processed. The most current data may be accessed via the Global Surface Temperature Anomalies page.
Temperature anomalies for March 2008 are shown on the dot maps below. The dot map, below left, provides a spatial representation of anomalies calculated from the Global Historical Climatology Network (GHCN) data set of land surface stations using a 1961-1990 base period. The dot map, below right, is a product of a merged land surface and sea surface temperature anomaly analysis developed by Smith and Reynolds (2005). Temperature anomalies with respect to the 1961-1990 mean for land and ocean are analyzed separately and then merged to form the global analysis. Additional information on this product is available.
The January-March 2008 map shows that for the first three months of the year, anomalous warm conditions were present over much of the world's land surface, especially across Europe and northern Asia where temperatures were 2°-5°C (4°-9°F) above average. Elsewhere, cooler-than-average conditions were observed in parts of the western and north-central states of the contiguous U.S., north-central Africa, eastern Australia, and parts of central and southeast Asia. As for sea surface temperatures (SST), warmer-than-average conditions were present in the Atlantic and Indian oceans, the Niño 1+2 region, and parts of the northwest Pacific Ocean. Cooler-than-average conditions were observed in all of the Niño regions (with the exception of Niño 1+2 region), parts of the northeastern Pacific and some areas in the southern oceans.
During March, above average temperatures were observed across Europe, Asia, northern Africa, central and southern Australia, parts of the southern states of the contiguous U.S, southern Alaska, and parts of South America. As shown in the March 2008 map, temperatures across Europe and most of Asia were 2°-6°C (4°-11°F) above the 1961-1990 mean. Following the largest January snow cover extent on record for the Eurasian continent and for the Northern Hemisphere, the warm conditions in March over Europe and Asia were associated with the least snow cover extent on record for the Eurasian continent and the second least for the Northern Hemisphere. Meanwhile, cooler-than-average conditions were present across Canada, northwestern, north-central and northeastern states of the contiguous U.S., eastern Australia, and parts of South Africa.
According to the Bureau of Meteorology (BoM), South Australia experienced a record heat wave which brought scorching temperatures across the state. Adelaide, South Australia's capital, experienced the longest running heat wave on record, with 15 consecutive days of maximum temperatures above 35°C (95°F). This broke the previous record of 8 consecutive days which was tied on numerous occasions, most recently in February 2004. Also, Adelaide set a new record as having the longest number of consecutive days for all Australian state capital cities. The second longest number of consecutive days for all Australian state capital cities with temperatures greater than 35°C (95°F) was 10 days, set in February 1988 in the city of Perth. South Australia, overall, had the third warmest March since records began with 2.35°C (4.23°F) above the 1961-1990 average. Australia, as a whole, had the 16th warmest March on record with an anomaly of 0.79°C (1.42°F) above average. For more information on South Australia's heat wave, please visit the March Global Hazards page.
SSTs during March 2008 were warmer than average in the Atlantic, northwestern Pacific, eastern equatorial Pacific, and parts of the south Indian and south Pacific oceans. Cooler-than-average conditions were present in parts of the southern oceans, North Indian Ocean, and in the Niño regions, with the exception of the Niño 1+2 region where the monthly temperature anomaly rose to +0.82°C (+1.48°F). Temperatures across the Niño 3.4 and Niño 4 increased slightly but the anomalies remained below average. Please see the latest ENSO discussion for additional information.
The mean position of the upper level ridges of high pressure and troughs of low pressure (depicted by positive and negative 500-millibar height anomalies on the March map) are generally reflected by areas of positive and negative temperature anomalies at the surface, respectively. For other Global products, please see the Climate Monitoring Global Products page.
Images of sea surface temperature conditions are available for all weeks during 2008 at the weekly SST page.
Effective with the February 2006 report, NCDC transitioned from the use of the Operational Global Surface Temperature Index (Quayle et al. 1999) to the blended land and ocean dataset developed by Smith and Reynolds (2005). The differences between the two methods are discussed in Smith et al. (2005).
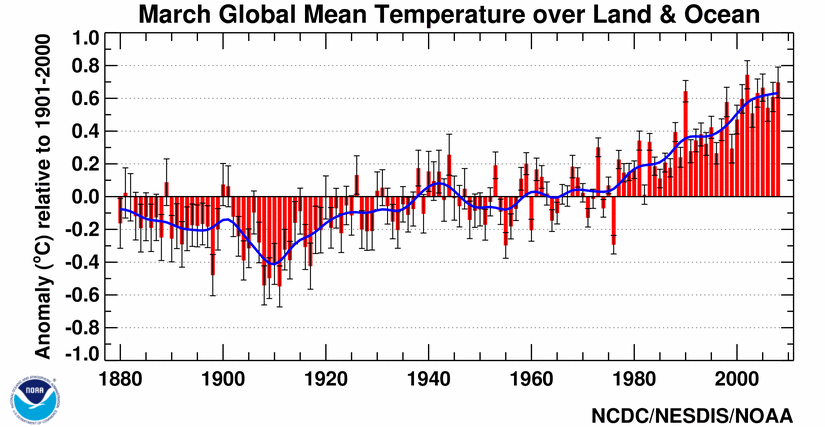
The combined global land and ocean surface temperature was the second warmest on record in March, behind 2002, and the eleventh warmest on record for January-March year-to-date period. Temperatures were warmer than average across Europe and Asia, prompting the March 2008 global and Northern Hemisphere land surface temperatures to be the warmest since records began in 1880. La Niña, the cold phase of the El Niño-Southern Oscillation, persisted in the equatorial Pacific, damping ocean surface temperatures. The global average ocean sea surface temperature (SST) in March was the 13th warmest on record. See the March global time series.
| March | Anomaly | Rank | Warmest (or Next Warmest) Year on Record |
|---|---|---|---|
GlobalLandOcean Land and Ocean |
+1.78°C (+3.20°F) +0.31°C (+0.56°F) +0.70°C (+1.26°F) |
warmest 13th warmest 2nd warmest |
1990 (+1.62°C/2.92°F) 1998 (+0.51°C/0.92°F) 2002 (+0.74°C/1.33°F) |
Northern HemisphereLandOcean Land and Ocean |
+2.24°C (+4.03°F) +0.31°C (+0.56°F) +1.03°C (+1.85°F) |
warmest 9th warmest warmest |
1990 (+2.00°C/3.60°F) 2004 (+0.49°C/0.88°F) 1990 (+0.91°C/1.64°F) |
Southern HemisphereLandOcean Land and Ocean |
+0.35°C (+0.63°F) +0.31°C (+0.56°F) +0.32°C (+0.58°F) |
22nd warmest 22nd warmest 22nd warmest |
1998 (+0.92°C/1.66°F) 2002 (+0.56°C/1.01°F) 1998 (+0.61°C/1.10°F) |
| January-March | Anomaly | Rank | Warmest (or Next Warmest) Year on Record |
|---|---|---|---|
GlobalLandOcean Land and Ocean |
+0.81°C (+1.46°F) +0.28°C (+0.50°F) +0.42°C (+0.76°F) |
11th warmest 14th warmest 11th warmest |
2002 (+1.51°C/2.72°F) 1998 (+0.53°C/0.95°F) 2002 (+0.73°C/1.31°F) |
Northern HemisphereLandOcean Land and Ocean |
+0.95°C (+1.71°F) +0.27°C (+0.49°F) +0.53°C (+0.95°F) |
10th warmest 11th warmest 8th warmest |
2002 (+1.89°C/3.40°F) 1998 (+0.50°C/0.90°F) 2002 (+0.95°C/1.71°F) |
Southern HemisphereLandOcean Land and Ocean |
+0.39°C (+0.70°F) +0.29°C (+0.52°F) +0.31°C (+0.56°F) |
14th warmest 23rd warmest 19th warmest |
1998 (+0.85°C/1.53°F) 1998 (+0.56°C/1.01°F) 1998 (+0.60°C/1.08°F) |
The most current data may be accessed via the Global Surface Temperature Anomalies page.
The maps below represent anomaly values based on the GHCN data set of land surface stations using a base period of 1961-1990. During March 2008, above average precipitation fell over areas that include the Philippines, Sri Lanka, southern India, most of Europe and Brazil, and the south-central, mid-western, and the northeast parts of the contiguous U.S. Drier-than-average conditions were observed across the Hawaiian Islands, eastern and northern Australia, and southern Africa, most of the central and western U.S. and parts of the southeastern U.S., and the southern countries in South America.
In the U.S., rainfall in the middle of March led to improving drought conditions in much of the Southeast, but at month's end, moderate to extreme drought remained over 59% of the region. Torrential rains during March 17-20 caused widespread flooding across the central U.S., prompting the overflow of rivers and causing historical floods. Across Kenya and Sri Lanka, heavy rains prompted floods that displaced thousands of people. Additional details on flooding and drought can also be found on the March Global Hazards page.
Sea surface temperature (SST) anomalies in all of the Niño regions increased, but the Niño 3.4 and 4 regions anomalies remained below average. SST anomalies in the Niño 1+2 region rose to +0.82°C (1.48°F), a warming of +0.52°C (0.94°F) compared to February's anomaly. These conditions indicate that some weakening of La Niña (ENSO cold phase) occurred during March, but a moderate La Niña remained across the tropical Pacific Ocean (shown in the adjacent animation of weekly sea surface temperature anomalies). A comprehensive summary of March 2008 ENSO conditions can be found on the ENSO monitoring page. For the latest advisory on ENSO conditions go to NOAA's Climate Prediction center (CPC) and the CPC ENSO Diagnostic Discussion.
Images of sea surface temperature conditions are available for all weeks since 2003 at the weekly SST page.
As shown in the time series to the right, the mean Northern Hemisphere snow cover extent during March 2008 was below average. During March, snowfall across the Northern Hemisphere was variable. In the contiguous U.S., multiple snow storms swept across the nation prompting numerous daily records and seasonal records. But across the Eurasian continent, unusually warm temperatures led to rapid snow melt. The Northern Hemisphere had the 2nd least snow cover extent on record, behind 1990. Heavy snowfall events in the U.S. during March 2008 prevented the Northern Hemisphere from having the least snow cover extent. The mean Northern Hemisphere March snow cover extent for the 1967-2008 period of record was 40.9 million square kilometers.
Across North America, snow cover for March 2008 was above average, the 10th largest extent since satellite records began in 1967. The mean North America March snow cover extent was 15.8 million square kilometers for the 1967-2008 period of record. Winter storms brought heavy snow across parts of the U.S. During March 7-9, a winter storm dumped heavy accumulations of snow from the lower Mississippi Valley to New England. The largest accumulation from this winter storm occurred in Columbus, Ohio, where the storm dumped over 51 cm (20 inches) of snow, setting a new event record. Also, snow that fell during March prompted several new seasonal total snowfall records. In Wisconsin, a winter storm that swept through on March 21 left snow accumulations of 13-46 cm (5-18 inches). This resulted in a new all-time seasonal snowfall for Madison, with a total of 254.2 cm (100.1 inches) of snow. Overall, the U.S. saw a total of 44,156 daily snowfall records (34,728 broken and 9,428 tied) during March 2008. Eliminating those stations that reported a trace of snowfall, the number of daily snowfall records would be 1,244 (907 broken and 337 tied).
As depicted in the time series to the right, Eurasia's snow cover extent during March 2008 was below average. This was the least snow cover extent over the 41-year historical period. Much of this can be attributed to the above normal temperatures that covered most of the Asian continent. On average, the Eurasian snow cover extent in March was 25.1 million square kilometers for the 1967-2008 period of record.
Data were provided by the Global Snow Laboratory, Rutgers University.
According to the National Snow and Ice Data Center, the March 2008 Northern Hemisphere sea ice extent, which is measured from passive microwave instruments onboard NOAA satellites, was below the 1979-2000 mean, but greater than the previous four years. This was the sixth least March sea ice extent on record. The past four years had the least March sea ice extent since records began in 1979. Sea ice extent for March has decreased at a rate of 2.8%/decade (since satellite records began in 1979) as temperatures in the high latitude Northern Hemisphere have risen at a rate of approximately 0.37°C/decade over the same period.
Meanwhile, the March 2008 Southern Hemisphere sea ice extent was much above the 1979-2000 mean. This was the largest sea ice extent in March (28.6% above the 1979-2000 mean) over the 30-year historical period, surpassing the previous record set in 1994 by 10.9%. Sea ice extent for March has increased at a rate of 4.2%/decade.
For further information on the Northern and Southern Hemisphere snow and ice conditions, please visit the NSIDC News page, provided by the NOAA's National Snow and Ice Data center (NSIDC).
Temperatures above the Earth's surface are measured within the lower troposphere, middle troposphere, and stratosphere using in-situ balloon-borne instruments (radiosondes) and polar-orbiting satellites (NOAA's TIROS-N). The radiosonde and satellite records have been adjusted to remove time-dependent biases (artificialities caused by changes in radiosonde instruments and measurement practices as well as changes in satellite instruments and orbital features through time).
These temperatures are for the lowest 8 km (5 miles) of the atmosphere. Information on the UAH and RSS sources of troposphere data is available.
| March | Anomaly | Rank | Warmest (or Next Warmest) Year on Record | Trend |
|---|---|---|---|---|
| UAH low-trop | +0.10°C/0.18°F | 13th warmest | 1998 (+0.53°C/0.95°F) | +0.14°C/decade |
| *RSS low-trop | +0.08°C/0.14°F | 15th warmest | 1998 (+0.59°C/1.07°F) | +0.16°C/decade |
*Version 03_0
| January- March |
Anomaly | Rank | Warmest (or Next Warmest) Year on Record | Trend |
|---|---|---|---|---|
| UAH low-trop | +0.03°C/0.05°F | 18th warmest | 1998 (+0.62°C/1.12°F) | +0.16°C/decade |
| *RSS low-trop | 0.00°C/0.00°F | 19th warmest | 1998 (+0.65°C/1.17°F) | +0.17°C/decade |
*Version 03_0
These temperatures are for the atmospheric layer centered in the mid-troposphere (approximately 3-10 km (2-6 miles) above the Earth's surface), which also includes a portion of the lower stratosphere. (The MSU channel used to measure mid-tropospheric temperatures receives about 25 percent of its signal above 10 km (6 miles).) Because the stratosphere has cooled due to increasing greenhouse gases in the troposphere and losses of ozone in the stratosphere, the stratospheric contribution to the tropospheric average, as measured from satellites, may create an artificial component of cooling to the mid-troposphere temperatures. The University of Washington (UW) versions of the UAH and RSS analyses attempt to remove the stratospheric influence from the mid-troposphere measurements, and as a result the UW versions tend to have a larger warming trend than either the UAH or RSS versions. For additional information, please see NCDC's Microwave Sounding Unit page.
The radiosonde data used in this global analysis were developed using the Lanzante, Klein, Seidel (2003) ("LKS") bias-adjusted dataset and the First Difference Method (Free et al. 2004) (RATPAC). Additional details are available. Satellite data have been adjusted by the Global Hydrology and Climate Center at the University of Alabama in Huntsville (UAH). An independent analysis is also performed by Remote Sensing Systems (RSS) and a third analysis has been performed by Dr. Qiang Fu of the University of Washington (UW) (Fu et al. 2004)** to remove the influence of the stratosphere on the mid-troposphere value. Global averages from radiosonde data are available from 1958 to present, while satellite measurements began in 1979.
Radiosonde measurements indicate that for the January-March year-to-date period, temperatures in the mid-troposphere were 0.19°C (0.35°F) above average, resulting in the seventeenth warmest January-March since global measurements began in 1958. However, as shown in the table below, satellite measurement of the January-March year-to-date period for the middle troposphere varied from twentieth to twenty-fourth warmest (seventh to eleventh coolest) on record.
The global mid-troposphere temperatures were slightly cooler than average in March 2008. As shown in the table below, satellite measurement for March 2008 ranked from seventeenth to twentieth warmest (fifth to twelfth coolest) on record.
| March | Anomaly | Rank | Warmest (or Next Warmest) Year on Record | Trend |
|---|---|---|---|---|
| UAH mid-trop | -0.13°C/-0.23°F | 26th warmest (5th coolest) |
1998 (+0.50°C/0.90°F) | +0.05°C/decade |
| *RSS mid-trop | -0.10°C/-0.17°F | 22nd warmest (9th coolest) |
1998 (+0.54°C/0.98°F) | +0.10°C/decade |
| **UW-UAH mid-trop | -0.03°C/-0.06°F | 20th warmest (11th coolest) |
1998 (+0.62°C/1.12°F) | +0.12°C/decade |
| **UW-*RSS mid-trop | -0.01°C/-0.02°F | 19th warmest (12th coolest) |
1998 (+0.65°C/1.17°F) | +0.16°C/decade |
*Version 03_0
| January- March |
Anomaly | Rank | Warmest (or Next Warmest) Year on Record | Trend |
|---|---|---|---|---|
| UAH mid-trop | -0.12°C/-0.22°F | 24th warmest (7th coolest) |
1998 (+0.56°C/1.00°F) | +0.06°C/decade |
| *RSS mid-trop | -0.08°C/-0.14°F | 22nd warmest (9th coolest) |
1998 (+0.60°C/1.07°F) | +0.11°C/decade |
| **UW-UAH mid-trop | -0.03°C/-0.06°F | 20th warmest (11th coolest) |
1998 (+0.69°C/1.24°F) | +0.13°C/decade |
| **UW-*RSS mid-trop | 0.00°C/0.00°F | 20th warmest (11th coolest) |
1998 (+0.71°C/1.28°F) | +0.17°C/decade |
| RATPAC | +0.19°C/0.35°F | 17th warmest | 2007 (+0.75°C/1.35°F) | +0.15°C/decade |
*Version 03_0
The table below summarizes stratospheric conditions for March 2008. On average, the stratosphere is located approximately between 16-23 km (10-14 miles) above the Earth's surface. Over the last decade, stratospheric temperatures have been below average in part due to the depletion of ozone. The large positive anomaly in 1982 was caused by the volcanic eruption of El Chichon in Mexico, and the sharp jump in temperature in 1991 was a result of the eruption of Mt. Pinatubo in the Philippines. In both cases the temperatures returned to pre-eruption levels within two years.
| March | Anomaly | Rank | Coolest Year on Record |
|---|---|---|---|
| UAH stratosphere | -0.54°C (-0.97°F) | 3rd coolest | 1999 (-0.71°C/-1.28°F) |
| *RSS stratosphere | -0.56°C (-1.01°F) | 3rd coolest | 1999 (-0.72°C/-1.30°F) |
*Version 03_0
For additional details on precipitation and temperatures in March, see the Global Hazards page.
Christy, John R., R.W. Spencer, and W.D. Braswell, 2000: MSU tropospheric Temperatures: Dataset Construction and Radiosonde Comparisons. J. of Atmos. and Oceanic Technology, 17, 1153-1170.
Free, M., D.J. Seidel, J.K. Angell, J. Lanzante, I. Durre and T.C. Peterson (2005) Radiosonde Atmospheric Temperature Products for Assessing Climate (RATPAC): A new dataset of large-area anomaly time series, J. Geophys. Res., 10.1029/2005JD006169.
Free, M., J.K. Angell, I. Durre, J. Lanzante, T.C. Peterson and D.J. Seidel(2004), Using first differences to reduce inhomogeneity in radiosonde temperature datasets, J. Climate, 21, 4171-4179.
Fu, Q., C.M. Johanson, S.G. Warren, and D.J. Seidel, 2004: Contribution of stratospheric cooling to satellite-inferred tropospheric temperature trends. Nature, 429, 55-58.
Lanzante, J.R., S.A. Klein, and D.J. Seidel (2003a), Temporal homogenization of monthly radiosonde temperature data. Part I: Methodology, J. Climate, 16, 224-240.
Lanzante, J.R., S.A. Klein, and D.J. Seidel (2003b), Temporal homogenization of monthly radiosonde temperature data. Part II: trends, sensitivities, and MSU comparison, J. Climate, 16, 241 262.
Mears, Carl A., M.C. Schabel, F.J. Wentz, 2003: A Reanalysis of the MSU Channel 2 tropospheric Temperature Record. J. Clim, 16, 3650-3664.
Peterson, T.C. and R.S. Vose, 1997: An Overview of the Global Historical Climatology Network Database. Bull. Amer. Meteorol. Soc., 78, 2837-2849.
Quayle, R.G., T.C. Peterson, A.N. Basist, and C. S. Godfrey, 1999: An operational near-real-time global temperature index. Geophys. Res. Lett., 26, 333-335.
Smith, T.M., and R.W. Reynolds (2005), A global merged land air and sea surface temperature reconstruction based on historical observations (1880-1997), J. Clim., 18, 2021-2036.
For all climate questions, other than questions concerning this report, please contact the National Climatic Data center's Climate Services Division:
Climate Services DivisionFor questions about this report, please contact:
Jay Lawrimore-or-
David Easterling


