 NCDC / Climate Mon. /
Climate-2008 / Feb / U.S. Drought / Help NCDC / Climate Mon. /
Climate-2008 / Feb / U.S. Drought / Help
Climate of 2008 - February
U.S. Drought Watch
National Climatic Data Center, 13 March 2008
|
Global Analysis /
Global Hazards /
United States /
Extremes
Use these links to access detailed analyses of Global and U.S. data.
|
Contents Of This Report:
|
|

 National Overview National Overview
|
Detailed Drought Discussion
|
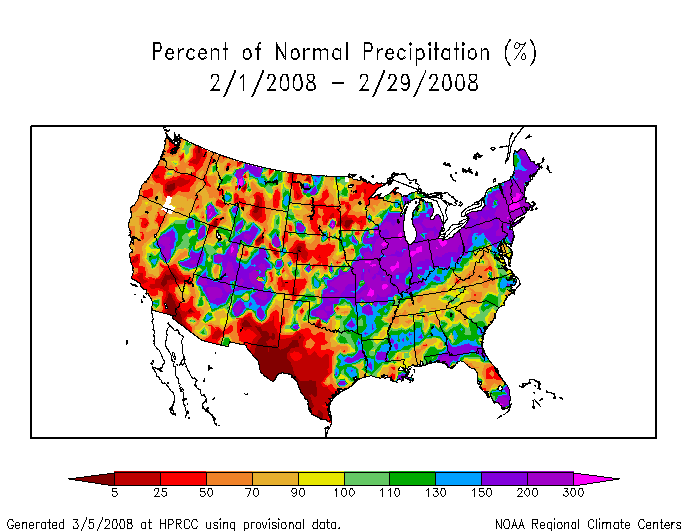
A very active weather pattern during February brought heavy rain and snow to a broad swath of the country from the mid-Mississippi Valley to the Northeast, and above-normal precipitation to much of the West. Beneficial precipitation fell across parts of the Southeast drought areas, although a large area from the mid-Atlantic coast to northern Mississippi, as well as central Florida, ended the month drier than normal. Parts of the northern Plains and western U.S., and much of the southern Plains, especially Texas, were dry this month.

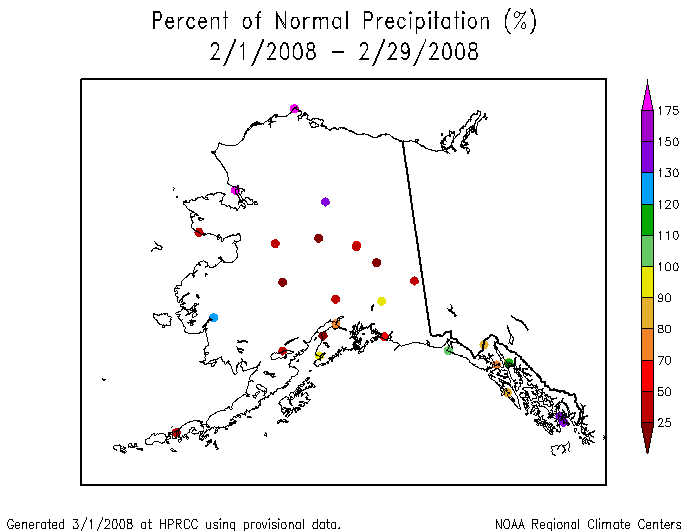
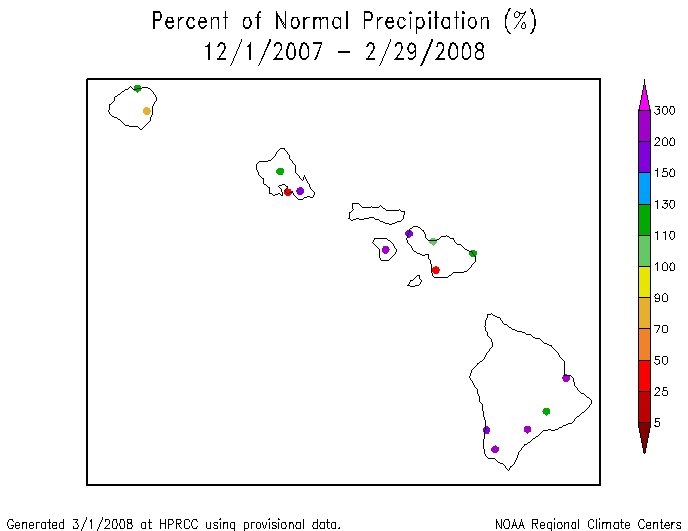
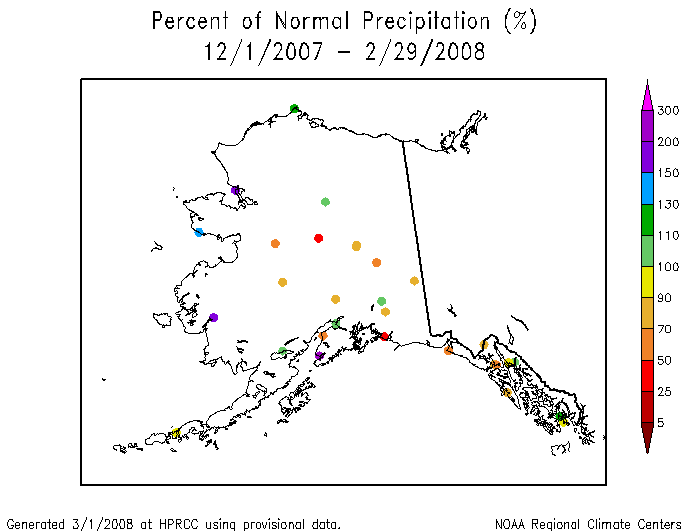
Much of Puerto Rico, the Hawaiian Islands, and interior and south central Alaska had below-normal precipitation during February. But December-February totals were above normal in most of Hawaii. A large swath from interior Alaska to the southeast panhandle was drier than normal for December-February, and snowpack across much of eastern Alaska was below normal as of March 1. Year-to-date (through March 10) rainfall across most of Puerto Rico was also below normal.
The February precipitation helped shrink drought and abnormally dry areas in the West and Southeast, while the continued dryness in the southern Plains expanded drought in Texas (as seen on maps of the March 4 USDM vs. January 29 USDM).
|
|
According to the USDM, about one-third of the West was experiencing moderate to severe drought as of March 4, compared to 45% near the beginning of February (January 29). The percent area in moderate to extreme drought based on the Palmer Drought Index was about 30%, which is a considerable improvement from the extensive area of last summer and most of the last 20 years. During the winter of 2007-2008, much of the West received above average rain and snow, and at the end of February, seasonal precipitation for the 2008 Water Year that began on October 1, 2007, was well above average for these areas. Mountain snowpack exceeded 150% of average over large parts of Colorado, New Mexico, Arizona, and Oregon at the end of February. If these conditions continue, spring runoff from the above average snowpack in the West is expected to be beneficial in the drought areas and help fill reservoirs that still averaged below-normal.
Drought conditions over the Southeast continued to improve, at least along the edges, with USDM statistics showing moderate to exceptional drought covering about two-thirds of the region by early March compared to about 73% near the beginning of February. Extreme to exceptional drought (the worst categories) shrank to about 26% from 39% a month ago. However, severe long-term deficits continued with North Carolina having the driest 12-month period, March-February, on record.
February marked the sixth consecutive dry month for the southern Plains, especially Texas. The persistent dryness spread from the southern Plains in the U.S. across the border into Mexico. September 2007-February 2008 ranked as the 11th driest such 6-month period on record for Texas, with October 2007-February 2008 ranking as tenth driest. Drought conditions intensified in the state with areas experiencing drought almost doubling from 25% at the end of January to 45% by early March.
The persistent dryness in the southern Plains has depleted soil moisture and ravaged pastures. Voluntary or mandatory water restrictions continued in many Southeast communities. Soil moisture was most severely affected in the mid-Atlantic to southern Plains, with dry conditions also apparent in parts of Florida, the northern Plains, western Great Lakes, and Far West. Streamflow (both modeled and observed) averaged below normal across the Southeast, mid-Atlantic, northern Great Plains, and parts of the West.
A more detailed drought discussion can be found below.
|
SOUTHEAST DROUGHT
According to the Southeast Regional Climate Center, February was a windy and stormy month. A series of active storms moved through the southern part of the region, with several states reporting tornadoes. Dry, hot conditions prevailed during the month. The winds encouraged the development and spread of wildfires, which occurred in several northern parts of the region. At least one 5-car pileup, in northeast North Carolina, was attributed to wind-driven smoke from a wildfire. The storms brought some precipitation, including snow in most of the mountain areas, however, amounts were quite variable. Some areas in the south of the region had their sixth wettest February on record, while farther north some areas had less than half the normal amount for the month. As a result, there was some respite from the on-going drought, particularly in coastal South Carolina and southern Georgia and Alabama, but drought conditions did not greatly change in the northern parts of the region. Both central North Carolina and northern Georgia, as well as Alabama, continued to be in exceptional drought, with extreme drought in the intervening areas. Southern Florida also missed the storms, and parts remained in extreme drought.
Compared to the storminess of the main part of the region, Puerto Rico and the Virgin Islands had temperatures hovering around the average for the month, while precipitation was just below normal.
SOUTH REGION DROUGHT
As noted by the Southern Regional Climate Center, precipitation was relatively variable in the region. In southwestern and central Texas, values were generally below normal and ranged from less than 2% of normal to 50% of normal. In central Oklahoma, precipitation was above normal with values ranging from 150% to over 400% of normal. In Louisiana, precipitation was above normal in the north, but below normal in the south. Conditions were driest in the south central parishes, with values ranging from 29% of normal in Baton Rouge, to 53% of normal in New Orleans. Alexandria on the other hand received almost twice its monthly total, while Monroe and Shreveport reported 130% and 118% of normal, respectively. In Mississippi, precipitation was above normal in the central counties, and below normal in the northern and southern quarters of the state. For example, Meridian reported over 200% of normal precipitation for the month, whereas McComb Airport received only approximately half the monthly average. Conditions were relatively dry in Tennessee, with most stations reporting below normal precipitation. Conversely, most stations in Arkansas received slightly above normal precipitation for the month. The only exception to this was in eastern Arkansas, were values were similar to those reported in northern Mississippi and western Tennessee (approx. 70-90% of normal).
In Louisiana, drought conditions slightly improved. At the start of the calendar year, over half the state was designated as abnormally dry (D0). As of February 26, there are no areas within the state that were designated as D0. Similarly, in Arkansas, only a small portion (1.4% of the state) in the southeast had abnormally dry conditions. The remainder of the state was completely drought-free. In Mississippi, 38.3 percent of the state was experiencing abnormally dry conditions. This area was concentrated in the northern third of the state. This depiction is an improvement from last month, when over 70 percent of the state was in a D0 condition. A small area of moderate drought existed in the northeast counties; however, this area made up only approximately six percent of the state. In Tennessee, drought conditions were similar to what they were last month, with a slight improvement. Currently, approximately half the state was in severe drought or worse, with 34.5% of the state experiencing severe to exceptional drought conditions. Similar to last month, this drought was mainly confined to the central and eastern portions of the state. In southern Texas, there was an area of severe to extreme drought. Extreme drought covered only 2 percent of the state and most of the central counties of the state were in moderate to severe drought. In Oklahoma, small areas of moderate drought were observed in the panhandle and in the southwestern counties.
The National Weather Service reported that San Antonio, Texas, had both wet and dry extremes during the last 14 months. The first 8 months of 2007 (the 243 days from 1/1/07-8/31/07) was the wettest such period on record. The next 6 months (i.e. the period from 9/1/07 thru 2/28/08) was the driest such period of record. The consolidated precipitation record for the San Antonio area goes back to 1871.
MIDWEST DROUGHT
As explained by the Midwest Regional Climate Center, February was a cold month across most of the Midwest. The colder-than-normal weather in the northern Midwest was aided by a persistent snow cover as storm after storm brought snow and ice to the region. Precipitation was much above normal for much of the Midwest in February, typically the driest month of the year. Precipitation was 200 percent of normal or more in a wide band extending from southwestern Missouri through Lower Michigan. Drier-than-normal conditions occurred in the northwestern quarter of the region, including most of Minnesota and northwestern Wisconsin where precipitation was only 25 to 75 percent of normal. Near to slightly below normal precipitation occurred in southeastern Kentucky as well. Snowfall was also much above normal across a significant portion of the Midwest north of the Ohio River. Snowfall was four to six times normal from eastern Iowa to eastern Wisconsin. Seasonal snowfall totals at many locations from northern Illinois through southern Wisconsin were already more than twice normal and in the top ten snowiest. At the end of February, Madison, WI had accumulated 89.8 inches (228.1 cm) of snow, smashing the previous seasonal snowfall record of 76.1 inches (93.3 cm) of snow in the winter of 1978-1979. The Midwest experienced all manner of severe weather during the month, from severe thunderstorms to heavy snow, including an episode of widespread very dense fog. A few areas of abnormally dry conditions persisted in the Lake Superior area and the northwestern half of Minnesota, with a spot of moderate drought in west central Minnesota, on the February 26 USDM.
HIGH PLAINS REGION DROUGHT
As noted by the High Plains Regional Climate Center, colder-than-normal temperatures prevailed in eastern portions of North Dakota, South Dakota, Nebraska, and northeastern Kansas, aided by snow cover which was present for much of February throughout this entire region. The western portions of the region had near-normal temperatures. Early in February, several low pressure systems brought snow and moisture to the eastern High Plains, with the most liquid precipitation falling in southeastern Kansas where more than 200% of the 1971-2000 liquid precipitation total normal for February was reported. Also benefiting from above-normal precipitation were the Rockies in southwest Colorado and portions of southwest Wyoming. Very little change occurred to the drought depiction in the region during the month. Abnormally dry conditions to severe drought continued in the northern and western portions and a small area to the south, with a couple pockets of extreme drought in the Nebraska panhandle and northern North Dakota.
WESTERN DROUGHT
As summarized by the Western Regional Climate Center, precipitation was above normal in parts of the Great Basin and most of the Four Corners region while the extreme Southwest, California, the Northwest and most of Idaho and Montana were below normal. However, almost all mountain snowpack in the West was still above normal by March 1st, ranging from 90% of normal in parts of Wyoming and Montana to 170% of normal in the Northwest and southern Rockies.
With near normal temperatures and mostly below normal precipitation, there were very few significant events. Heavy rains caused flooding in the southeast portion of the island of Hawaii during the first five days of February. Total rainfall in Hilo was 29.72 inches (755 mm) over a 5-day span from the 1st to the 6th, including 10.82 inches (275 mm) on the 2nd alone. One location on the Big Island reported nearly 41 inches (1041 mm) of rain during those five days.
A moderate La Niña (cooler than usual ocean water on the equator between Peru and the Date Line) has been under way for most of this winter. Typically this condition is associated with dry winters in the far Southwest and wet winters in the Pacific Northwest and northern Rockies. This normally quite reliable pattern has been replaced this winter by a more even spatial distribution of precipitation in many parts of the West. The pattern in February continued in that vein, with the largest positive departures in the Colorado River Plateau, and an unusually heavy snowpack in the San Juan Mountains. As of early February, summer snowmelt inflow to Lake Powell was projected to be nearly 120% of average, which would be the highest value seen in the last decade. This assumes that a warm or dry March does not cause a premature loss of snow to the atmosphere or to dry soils.
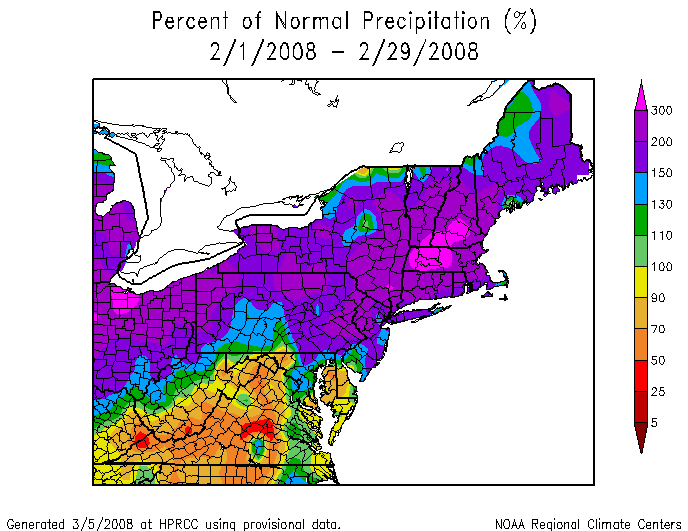
NORTHEAST DROUGHT
As noted by the Northeast Regional Climate Center, an active weather pattern with a few heavy rain events put February's precipitation totals over the top, making this month the wettest February since records began in 1895. Four states (Connecticut, Massachusetts, Rhode Island and Vermont) also had their wettest February in 114 years. It was the second wettest in New York and Pennsylvania, the 3rd wettest in New Hampshire, the 4th wettest in New Jersey, and the 9th wettest in Maine. Precipitation departures ranged from 113% of normal in Delaware to 289% of normal in Vermont. The departure for the Northeast as a whole was 199% of the 30-year mean. With 135% of normal precipitation, the Northeast saw its 3rd wettest winter on record. Despite the abundant precipitation this month and this winter, the southernmost counties on the eastern shore of Maryland and southern Delaware were still under moderate to severe drought conditions according to the February 26, 2008, US Drought Monitor.
|
State/Regional/National Moisture Status
|
Pre-Instrumental Perspective
|
There is no February 2008 Paleoclimatic Perspective.
Drought Indicators
|
|
The following indicators illustrate the drought conditions this month:
|
Additional Contacts:
|
- For all climate questions other than questions concerning this report, please contact the National Climatic Data Center's Climate Services Division:
Climate Services Division
NOAA/National Climatic Data Center
151 Patton Avenue
Asheville, NC 28801-5001
fax: 828-271-4876
phone: 828-271-4800
email: ncdc.info@noaa.gov
- For further information on the historical climate perspective presented in this report, contact:
Richard Heim
NOAA/National Climatic Data Center
151 Patton Avenue
Asheville, NC 28801-5001
fax: 828-271-4328
email: Richard.Heim@noaa.gov
-or-
Jay Lawrimore
NOAA/National Climatic Data Center
151 Patton Avenue
Asheville, NC 28801-5001
fax: 828-271-4328
email: Jay.Lawrimore@noaa.gov
|
NCDC / Climate Mon. /
Climate-2008 / Feb / U.S. Drought / Help
|


