 Climate Monitoring / Climate of 2008 / East Pacific Hurricanes / Help Climate Monitoring / Climate of 2008 / East Pacific Hurricanes / Help
Use these links to access detailed analyses of Global and U.S. data 
MAY | JUNE | JULY | AUGUST | SEPTEMBER | OCTOBER | SEASONAL SUMMARY | Links Alma (5/29-30) | Boris (6/27-7/3) | Cristina (6/27-7/1) | Douglas (7/1-7/3) | Elida (7/12-7/19) Fausto (7/16-7/22) | Genevieve (7/21-7/27) | Hernan (8/6-8/13) | Kika (8/6-8/12) | Iselle (8/13-8/16) Julio (8/23-8/26) 
|
||||||||||||||||||||||||||||||||||||||||||||||||||||||||||||||
 Tropical Storm Julio Satellite Image (high resolution) |
 Tropical Storm Julio Track  Saffir-Simpson Scale Color Legend |
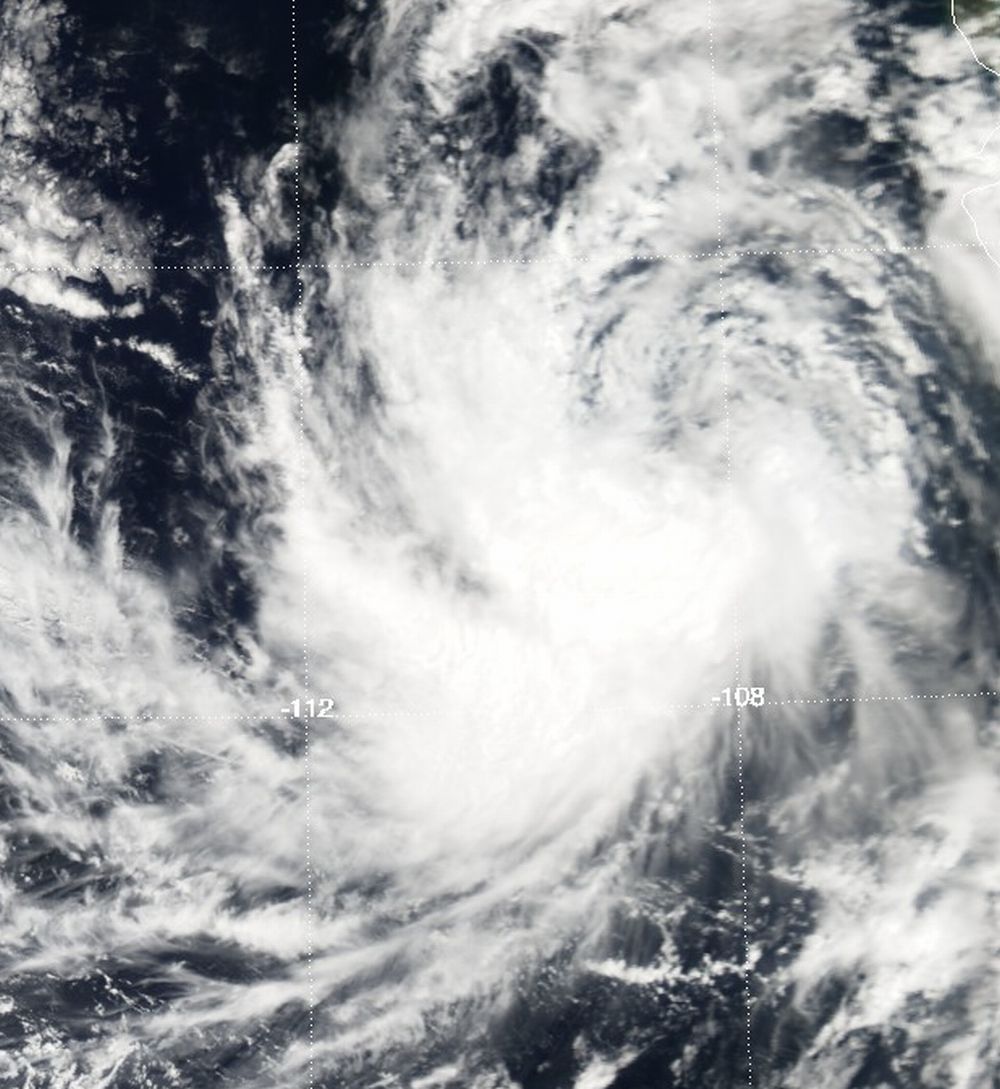
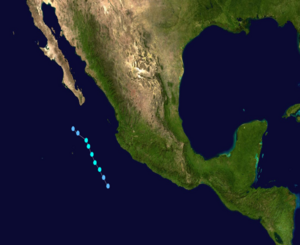
Julio developed from a tropical wave off the coast of Mexico on August 23 and moved northwestward parallel to the coast. Its peak winds reached 85 km/h (50 mph or 43 knots) and its maximum central pressure reached 998 mbar (29.47 inches). On August 24, Julio made landfall in the southern tip of Baja California and quickly weakened, but not before producing heavy rainfall which resulted in locally heavy flooding thus killing two people. More information on Tropical Storm Julio is available from the NOAA National Hurricane Center. | |
 Tropical Storm Iselle Satellite Image (high resolution) |
 Tropical Storm Iselle Track  Saffir-Simpson Scale Color Legend |
Tropical Storm Iselle developed from a disturbance southwest of Mexico on August 13. As the storm moved to the west-northwest its maximum winds reached 65 km/h (40 mph or 35 knots) and its maximum central pressure reached 999 mbar (29.50 inches). Upper-level conditions were not favorable for development and dissipated on August 16. More information on Tropical Storm Iselle is available from the NOAA National Hurricane Center. | |
 Tropical Kika Satellite Image (high resolution) |
 Tropical Storm Kika Track  Saffir-Simpson Scale Color Legend |
Tropical Storm Kika formed from a disturbance southeast of Hawaii on August 6. Kika moved westward and its peak winds reached 65 km/h (40 mph or 35 knots). On August 8, Kika was downgraded to a tropical depression, but it reintensified to a tropical storm the next day. Maximum central pressure reached 1007 mbar (29.74 inches). The storm was downgraded to a remnant low on August 12, More information on Hurricane Kika is available from the NOAA National Hurricane Center. | |
 Hurricane Hernan Satellite Image (high resolution) |
 Hurricane Hernan Track  Saffir-Simpson Scale Color Legend |
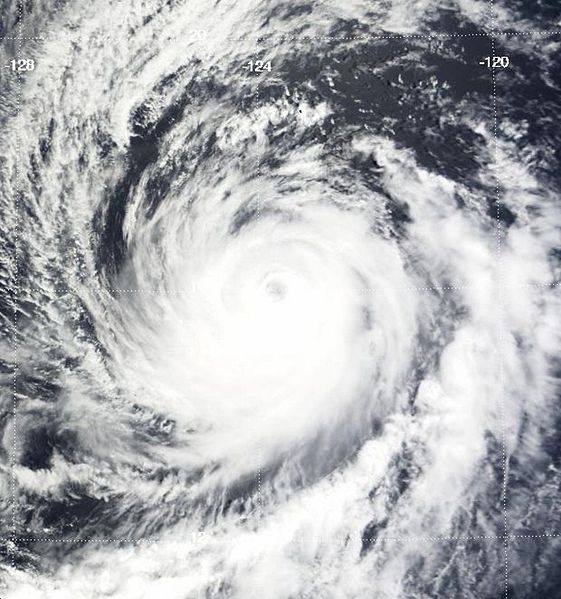
Hernan formed from a low pressure area southwest of Mexico on August 6 and quickly strengthened into a tropical storm. Hurricane Hernan became the first major hurricane of 2008 in the Pacific Ocean on August 9 when its max winds reached 194 km/h (121 mph or 105 knots). After reaching a maximum central pressure of 956 mbar (28.23 inches), Hernan dissapated over the open waters and the National Hurricane Center issued the final advisory for Hernan on August 12. More information on Hurricane Hernan is available from the NOAA National Hurricane Center. | |

 July
July
 Hurricane Genevieve Satellite Image |
 Hurricane Genevieve Track  Saffir-Simpson Scale Color Legend |
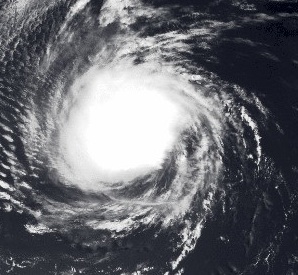
Genevieve began as a tropical wave near Nicaragua on July 17 and moved westward over the following several days. The disturbance evolved into a tropical depression on July 21 250 miles southwest of Acapulco and intensified into a tropical storm later that day. Genevieve became a hurricane on July 25 far offshore of Cabo San Lucas, Mexico, then weakened the next day. The storm weakened into a depression early on July 27 and dissipated later that day. The strongest winds in Hurricane Genevieve were 121 km/hr (65 knots or 75 mph) and its lowest pressure was 987 mb. More information on Tropical Storm Genevieve is available from the NOAA National Hurricane Center. | |
 Hurricane Fausto Satellite Image (high resolution) |
 Hurricane Fausto Track  Saffir-Simpson Scale Color Legend |
Fausto developed as a westward-moving tropical wave off the coast of Africa in early July and developed into a tropical depression on July 16 about 560 miles southeast of Acapulco. The system reached tropical storm status later that day and strengthened into a hurricane on July 18. Hurricane Fausto moved northwestward, then west-northwestward where it encountered cool waters which weakened the storm. Fausto rapidly weakened into a remnant low by July 22 and dissipated two days later about 1200 miles west of the southern tip of Baja California. The strongest winds in Hurricane Fausto were 161 km/hr (87 knots or 100 mph) and its lowest pressure was 975 mb. More information on Hurricane Fausto is available from the NOAA National Hurricane Center. | |
 Hurricane Elida Satellite Image (high resolution) |
 Hurricane Elida Track  Saffir-Simpson Scale Color Legend |
Elida began on July 11 as a tropical depression located about 400 miles southeast of Acapulco and strengthened into a tropical storm later the same day. The storm moved west-northwestward for several days and strengthened into a hurricane on July 14. Hurricane Elida strengthened and reached its peak on July 16 before moving over cooler waters. The cool waters weakened the storm's intensity and it was downgraded to a tropical storm on July 18, and a depression the next day. This category 2 storm was ocean-bound and did not affect land. The strongest winds in Hurricane Elida were 169 km/hr (91 knots or 105 mph) and its lowest pressure was 970 mb. More information on Hurricane Elida is available from the NOAA National Hurricane Center. | |
 Tropical Storm Douglas Satellite Image |
 Tropical Storm Douglas Track  Saffir-Simpson Scale Color Legend |
Douglas was a short-lived tropical cyclone that formed on July 1 about 280 miles southwest of Manzanillo, Mexico. The storm moved northwestward, paralleling the Mexican coast for several days. Douglas weakened to a remnant low on July 3 after bringing heavy rains to parts of southwest coastal Mexico. The strongest winds in Tropical Storm Douglas were 65 km/hr (35 knots or 40 mph) and its lowest pressure was 1003 mb. More information on Tropical Storm Douglas is available from the NOAA National Hurricane Center. | |

 June
June
 Tropical Storm Cristina Satellite Image |
 Tropical Storm Cristina Track  Saffir-Simpson Scale Color Legend |
An area of low pressure in the eastern Pacific developed into Tropical Depression Three-E on June 27. This depression strengthened into Tropical Storm Cristina on June 28 and remained relatively weak as it tracked westward. Christina weakened to a tropical depression on June 30 and dissipated on July 1. The strongest winds in Tropical Storm Cristina were 85 km/hr (43 knots or 50 mph) and its lowest pressure was 1000 mb. More information on Tropical Storm Cristina is available from the NOAA National Hurricane Center. | |
 Hurricane Boris Satellite Image |
 Hurricane Boris Track Map  Saffir-Simpson Scale Color Legend |
On June 27, a tropical depression formed over the warm waters south of Mexico's Baja Peninsula. Two days later, the depression strengthened into tropical storm Boris. This storm intensified to hurricane strength for a brief period on July 1, making Boris the first hurricane of the 2008 season in the eastern Pacific. The storm weakened as it moved over cooler waters and was downgraded to a tropical storm late on July 2. The system dissipated on July 4. The maximum sustained winds of Hurricane Boris were near 120 km/hr (65 knots or 75 mph) and the minimum pressure was 989 mb. More information may be found on NCDC's 2008 Northeast Pacific Tropical Cyclone statistics page, or at the NOAA National Hurricane Center. |
|

 May
May
The eastern North Pacific hurricane season officially begins on May 15th, generally peaks in late August/early September and concludes around the end of November. Tropical cyclone activity during May 2008 was above average with one named storm, Alma. Since official records began in 1949, four tropical storms have developed in May in 1984, 1956, and two in 2007. The long-term mean indicates that a named storm typically forms about every other May. However, this is the 9th consecutive May that a tropical cyclone has developed in the East Pacific Basin. |
 Tropical Storm Alma Satellite Image |
 Tropical Storm Alma Track Map  Saffir-Simpson Scale Color Legend |
Alma developed as a tropical wave south of Central America in late May and strengthened into a tropical depression on May 28. The depression strengthened into a strong tropical storm the next day, making landfall on the northwestern coast of Nicaragua near León. Nine people were killed in León, where electricity was lost, trees toppled, and several homes were damaged. The remnants of Alma moved across Central America and later emerged in the Gulf of Honduras where it reorganized into Atlantic Tropical Storm Arthur. Alma's peak winds of 105 km/hr (56 knots or 65 mph) occurred on the morning of May 29. More information may be found on NCDC's 2008 Northeast Pacific Tropical Cyclone statistics page or at the NOAA National Hurricane Center. |
|

 Useful Links
|

 Questions?
|
For all climate questions other than questions concerning this report, please contact the National Climatic Data Center's Climate Services Division: Climate Services Division NOAA/National Climatic Data Center 151 Patton Avenue Asheville, NC 28801-5001 fax: 828-271-4876 phone: 828-271-4800 email: questions@ncdc.noaa.gov For further information on the historical climate perspective presented in this report, contact: David Levinson NOAA/National Climatic Data Center 151 Patton Avenue Asheville, NC 28801-5001 fax: 828-271-4328 email: David.Levinson@noaa.gov |
 NCDC / Climate Monitoring / Climate of 2008 / hurricanes / Help


