

 Climate Monitoring / Climate of 2008 / Atlantic Hurricanes / Help Climate Monitoring / Climate of 2008 / Atlantic Hurricanes / Help
Use these links to access detailed analyses of Global and U.S. data 
MAY | JUNE | JULY | AUGUST | SEPTEMBER | OCTOBER | SEASONAL SUMMARY | Links Arthur (5/31-6/2) | Bertha (7/3-7/20) | Cristobal (7/18-7/23) | Dolly (7/20-7/25) Edouard (8/3-8/7) | Fay (8/15-8/26) | Gustav (8/25-9/3)
|
||||||||||||||||||||||||||||||||||||||||
 Tropical Storm Edouard Satellite Image (high resolution - 3.6 MB) |
 Tropical Storm Edouard Track  Saffir-Simpson Scale Color Legend |
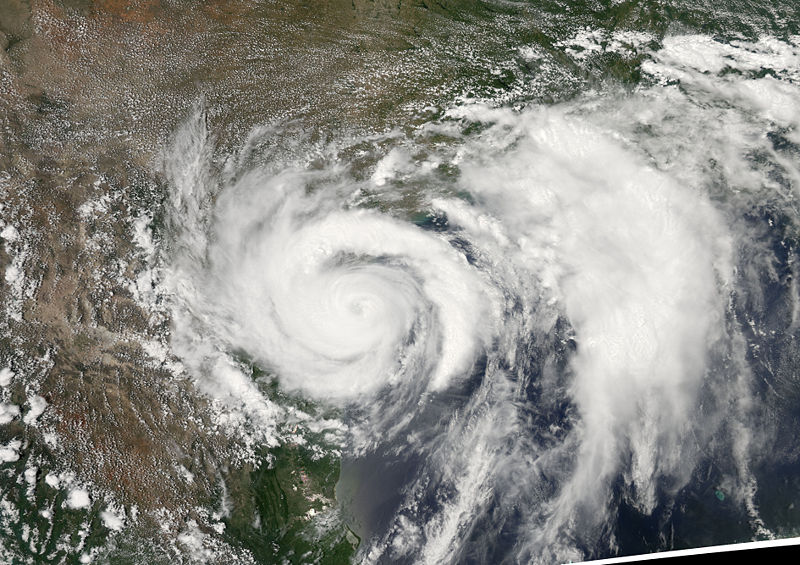
Atlantic Tropical storm Edouard developed in the northeastern Gulf of Mexico on August 3 and made landfall two days later near Port Arthur, Texas as a strong tropical storm. The system weakened into a tropical depression that afternoon and continued to weaken after moving inland. Edouard had maximum sustained winds of 65 km/hr (35 knots or 40 mph) and a minimum pressure of 997 mb. More information on Edouard is available from the NOAA National Hurricane Center. | |
 Tropical Storm Fay Satellite Image (high resolution - 5.3 MB) |
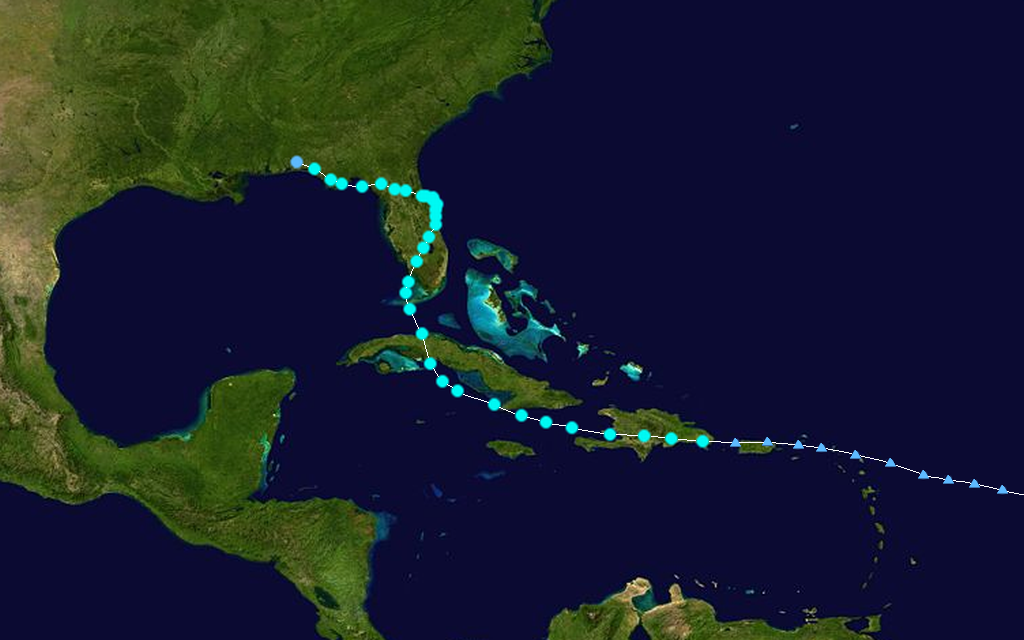 Tropical Storm Fay Track Saffir-Simpson Scale Color Legend |
Tropical Storm Fay began as a westward-moving tropical wave which intensified into a tropical storm on August 15 just east of Hispaniola. Fay first hit Hispaniola and Cuba before moving north to Florida. The storm made landfall in the Florida Keys late on August 18, then hit the Florida peninsula the next morning and slowly tracked north-northeastward into the Atlantic. Tropical Storm Fay made landfall in Florida for the third time near Flagler Beach on the afternoon of August 21. Steered by an upper-level high pressure system, the storm moved west-northwest across Florida, emerging into the northeastern Gulf of Mexico and making its fourth Florida landfall on the morning of August 23 near Carrabelle in the Florida panhandle. Fay was the first storm on record to make four landfalls on the state of Florida (or any state). Parts of Florida received over two feet (610 mm) of rainfall from the slow-moving storm, and Fay produced flood-inducing rains across parts of Alabama, Georgia and the Carolinas for several days. Fay had maximum sustained winds of 65 km/hr (35 knots or 40 mph) and a minimum pressure of 986 mb. More information on Fay is available from the NOAA National Hurricane Center. | |
 Hurricane Gustav Satellite Image (high resolution - 6.7 MB) |
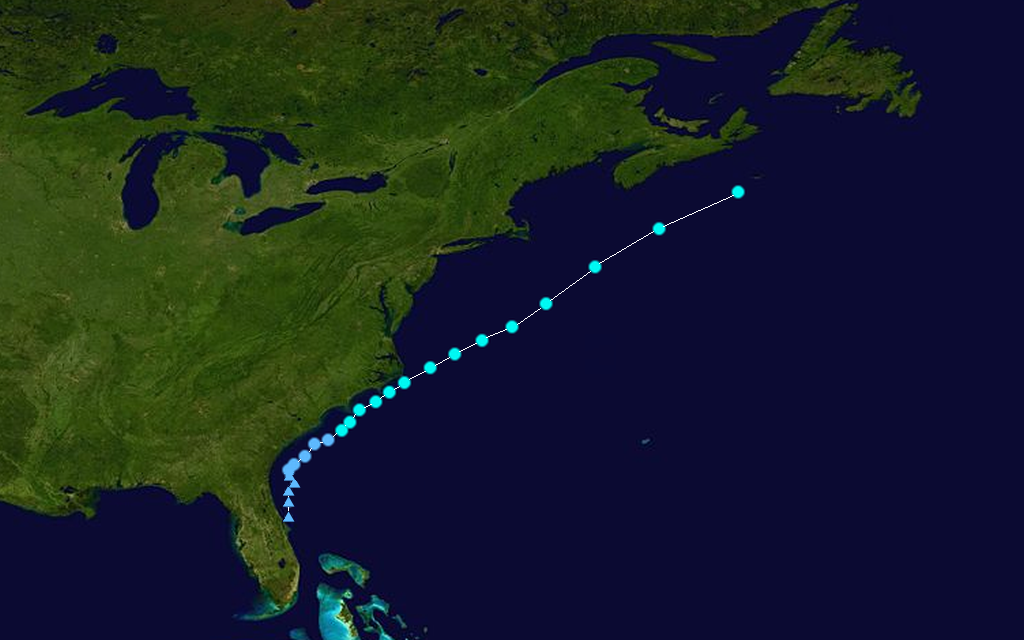
 Hurricane Gustav Track Saffir-Simpson Scale Color Legend |
Near the end of August, a tropical disturbance west of the Windward Islands strengthened into first a tropical depression, then a tropical storm on August 25. Early on the 26th, this tropical storm intensified into Hurricane Gustav and made landfall near Jacmel, Haiti later the same day. Gustav briefly weakened to a tropical storm after making landfall and slowed considerably. The storm strengthened again to hurricane strength on August 29 and intensified to Category 4 strength later that afternoon. Hurricane Gustav made landfall on Cuba first on Isla de la Juventude and later near Los Palacios and continued moving northwestward toward the Gulf of Mexico. The hurricane continued this path across the Gulf of Mexico and made landfall near Grand Isle, Louisiana on the morning of September 1. Over 100 deaths in the U.S. and the Caribbean, mostly in Haiti, were attributed to Hurricane Gustav. Gustav had maximum sustained winds of 240 km/hr (130 knots or 150 mph) and a minimum pressure of 941 mb. More information on Gustav is available from the NOAA National Hurricane Center. | |
 July
July
 Hurricane Bertha Satellite Image (high resolution) |
 Hurricane Bertha Track Saffir-Simpson Scale Color Legend |
Bertha developed as a tropical wave south of the Cape Verde islands on July 3, strengthening into Tropical Storm Bertha later that day. The storm further strengthened on July 6 and was upgraded to a hurricane early the next day based on satellite and microwave imagery. Bertha rapidly intensified into a Category 3 hurricane with estimated 195 km/hr (105 knots or 120 mph) winds and a well-defined eye later the same day. The hurricane rapidly weakened to a Category 1 storm due to strong wind shear on the afternoon of July 8. The next day Bertha intensified briefly to a Category 2 hurricane, then later weakened. The storm weakened to tropical storm status on July 19 and was classified as extratropical the next day southwest of Iceland. Bertha was the longest-lived pre-August Atlantic tropical cyclone on record. Peak intensity was 193 km/hr (104 knots or 120 mph) with a minimum pressure of 948 mb. More information on Bertha is available from the NOAA National Hurricane Center. | |
 Tropical Storm Cristobal Satellite Image (high resolution) |
 Tropical Storm Cristobal Track Saffir-Simpson Scale Color Legend |
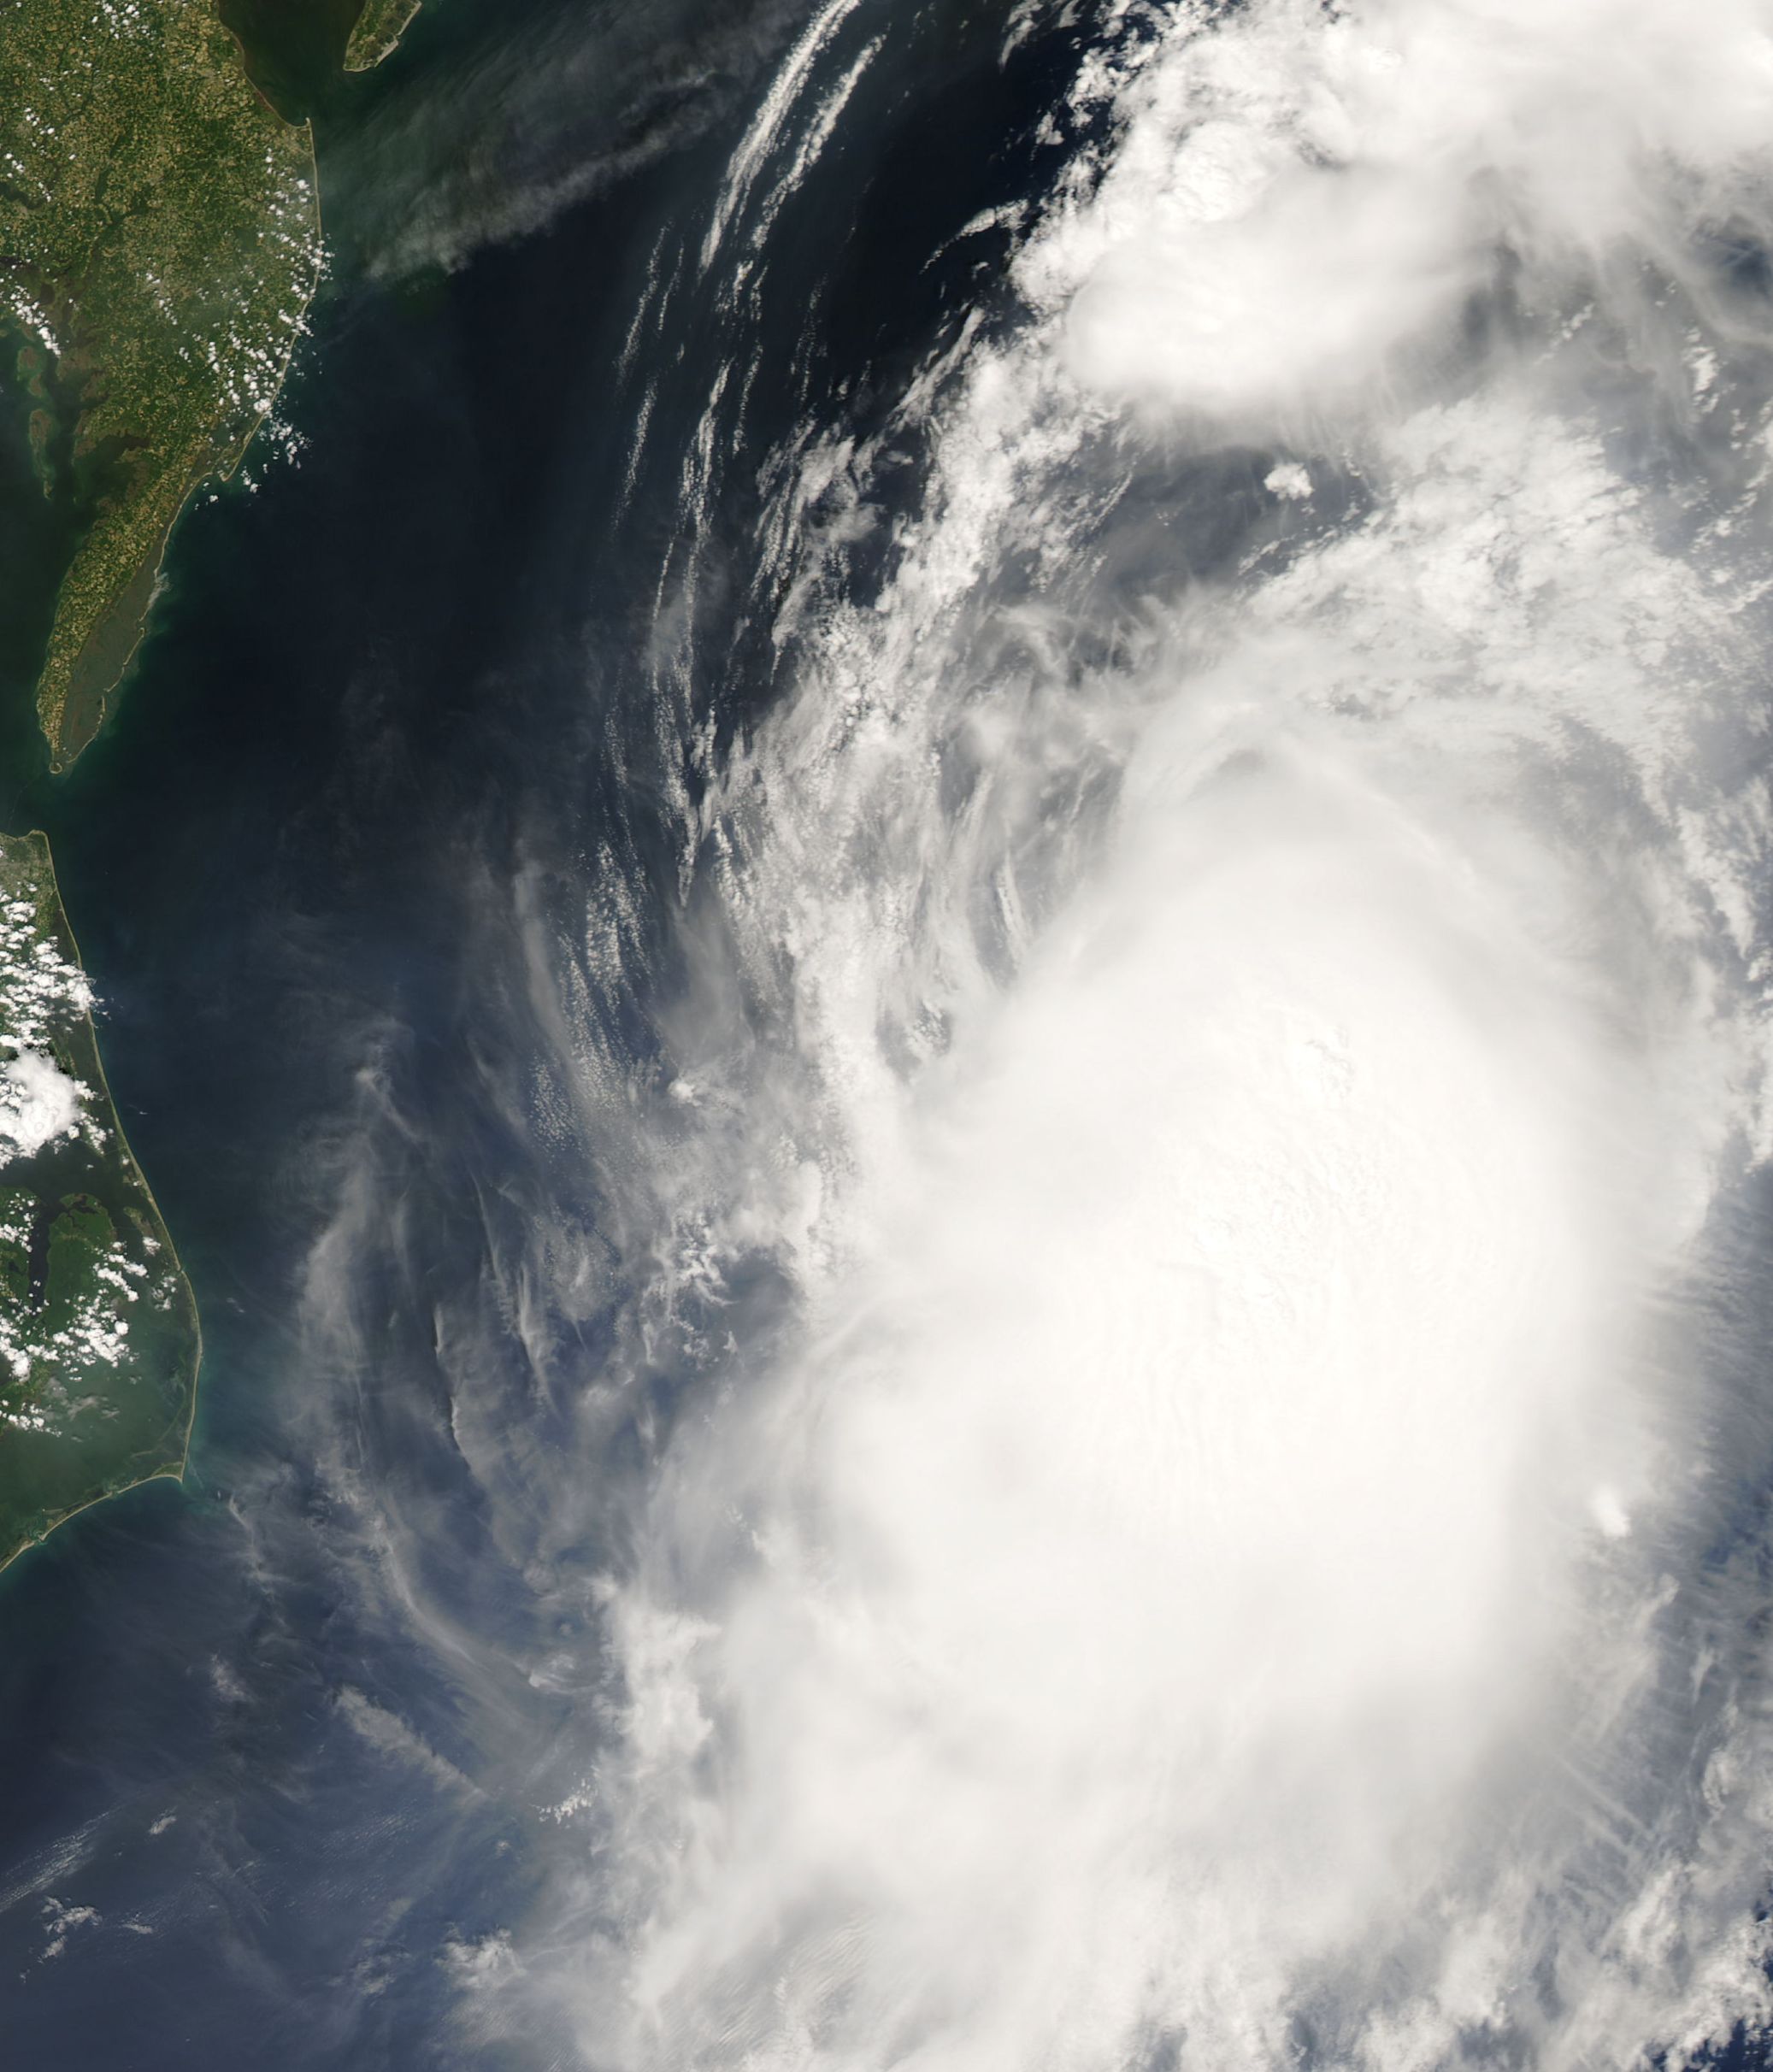
Cristobal formed from a low pressure disturbance that moved northeastward from the Gulf of Mexico across Florida. The system continued to move northeastward near the east coast of the U.S. and became a tropical depression on July 18 about 65 miles south-southeast of Charleston, SC. As the storm slowly moved northeast, it intensified into a tropical storm the next day. Cristobal continued moving northeast away from the U.S. coast and reached its peak intensity of 105 km/hr (56 knots or 65 mph) on July 21 about 700 miles southwest of Halifax, Nova Scotia. The system became extratropical two days later. Cristobal's minimum pressure was 1000 mb. More information on Cristobal is available from the NOAA National Hurricane Center. | |
 Hurricane Dolly Satellite Image (high resolution) |
 Hurricane Dolly Track Saffir-Simpson Scale Color Legend |
Dolly originated from a tropical wave off the coast of Africa on July 11, 2008. The disturbance strengthened as it moved westward and formed a well-defined circulation on July 20 in the western Caribbean, when it was classified as a tropical storm. The storm made landfall in the Yucatán Peninsula on July 21 with maximum sustained winds near 80 km/hr (49 mph or 43 knots). Dolly moved northwestward, weakened, then reorganized over the Gulf of Mexico on July 21. The storm strengthened into a hurricane on July 22 and reached its peak intensity on July 23 shortly before its eye made landfall on South Padre Island, Texas. After landfall, Dolly steadily weakened and became a tropical depression the next day near the U.S.-Mexico border. Hurricane Dolly's peak intensity was 160 km/hr (86 knots or 100 mph) with a minimum pressure of 964 mb. More information on Dolly is available from the NOAA National Hurricane Center. | |
June
| No tropical storms formed in the Atlantic Basin during June 2008. |
May
 Tropical Storm Arthur Satellite Image |
 Tropical Storm Arthur Track Saffir-Simpson Scale Color Legend |
Atlantic Tropical storm Arthur developed off the Belize coast on May 31 from the remnants of Pacific Tropical Storm Alma, making landfall on Belize shortly thereafter and dissipating on June 2. Arthur is the first tropic storm to form in May since 1981. Arthur had maximum sustained winds of 65 km/hr (35 knots or 40 mph). More information on Arthur is available from the NOAA National Hurricane Center. | |
Useful Links
|
Questions?
|
For all climate questions other than questions concerning this report, please contact the National Climatic Data Center's Climate Services Division: Climate Services Division NOAA/National Climatic Data Center 151 Patton Avenue Asheville, NC 28801-5001 fax: 828-271-4876 phone: 828-271-4800 email: questions@ncdc.noaa.gov For further information on the historical climate perspective presented in this report, contact: David Levinson NOAA/National Climatic Data Center 151 Patton Avenue Asheville, NC 28801-5001 fax: 828-271-4328 email: David.Levinson@noaa.gov |
NCDC / Climate Monitoring / Climate of 2008 / hurricanes / Help


