

 Climate Monitoring / Climate of 2007 / US Summary / Snow Summary / Help Climate Monitoring / Climate of 2007 / US Summary / Snow Summary / Help
Use these links to access detailed analyses of Global and U.S. data. 
|
 click here for animation |
 click here for animation |
|
May, as expected, brought warm temperatures to North America, melting most of the remaining snow cover by the end of the month. The images above display the retreat of snow cover and oceanic ice across northern North America and the Northern Hemisphere. By the end of May, nearly all snow cover in the Rockies had melted, and most lakes in southern Canada were ice-free. Much of James Bay and the Hudson Bay retained their ice cover at the end of the month. |
More information on May severe winter weather can also be found on NCDC's Hazards page. |
 April
April
 click here for animation |
 click here for animation |
|
April brought warm temperatures that melted a significant portion of the North American snow cover by the end of the month. A large storm system brought snow throughout much of the northern Midwest on April 1, bringing 8-10 inches (20-25 cm) of snow to the central Upper Peninsula (UP) of Michigan and 18-24 inches in Marquette County, MI. Several days later, a small but strong wave of low pressure produced a narrow band of heavy snow from eastern North Dakota across the Iron Range of northern Minnesota. The maximum snow from this event was reported in Virginia, MN, which received 32 inches (81 cm) from this single event, the largest ever April multi-day snowfall in the Iron Range. In Canada, Quebec City received 5.5 meters (18 feet) of snow this winter. However, by the end of the month, snow remained only at the highest elevations in the Rockies and a few areas in Minnesota, Wisconsin, Maine, and West Virginia. |
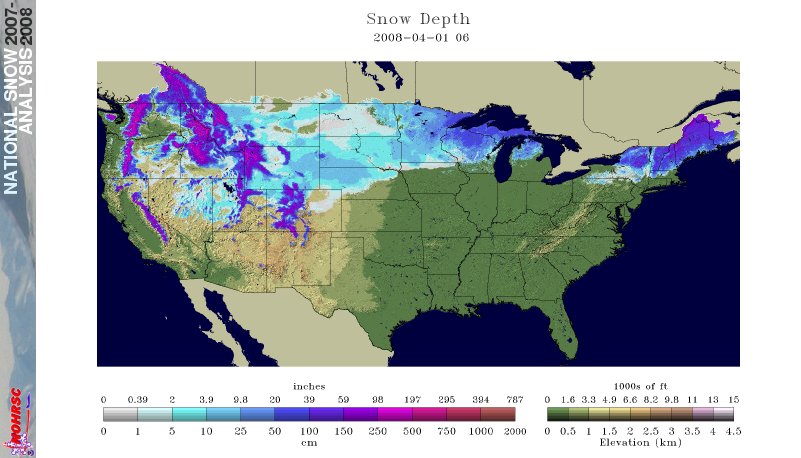 Click for larger satellite-derived image of snow cover on April 1, 2008  Click for larger satellite-derived image of snow cover on April 30, 2008 |
 Click for larger MODIS image of snowfall over the Upper Midwest on April 1, 2008 |
Several cities and ski resorts across the country set new seasonal snowfall records during April. Madison, Wisconsin set a new seasonal record snow total of 101.4 inches (257.6 cm) on April 8, breaking the previous record of 76.1 inches (193.3 cm) from the 1978-79 season. Numerous ski resorts in the West reported record breaking snowfall this year, as did parts of northern Maine. Caribou, Maine received 197.8 inches (502 cm) of snowfall this winter, shattering the previous record of 181.1 inches (460 cm). |
|
Mt. Crested Butte, Colorado received 418 inches (1061 cm) during the 2007-08 winter, breaking the previous record of 415 inches (1054 cm) from 1979-1980. Even Spokane, Washington was the second-snowiest on record with 89.5 inches (227 cm), four inches (10 cm) short of the previous record from 1949-1950. The map to the right depicts the snowpack levels in many Rocky Mountain basins on May 1, 2008, illustrating a residual near to above average snow cover over much of the Rockies and Cascades in the western U.S. Thirty-two Snowtel locations reported record snow water equivalent records by the end of April. Above-average snowfall this season brought relief to many areas of the Western U.S. that have been plagued by drought in recent years. |
 Click for larger image of Mountain Snowpack on May 1, 2008 |
More information on April severe winter weather can also be found on NCDC's Hazards page. |
March
 click here for animation |
 click here for animation |
|
The two satellite-derived images above show the daily snow cover across the Northern Hemisphere (left map) and North America (right map) throughout March 2008. By clicking on the images, the gradual retreat of snowpack across much of North America, Europe and Asia and the expansion and contraction of sea ice across parts of the North Atlantic, North Pacific and portions of the Great Lakes can be seen during the month. In addition, a few snowstorms can be seen across eastern Europe, Mongolia, China, and the United States during March. By the end of the month, much of the snow cover had begun receding in the mid-latitudes with the increase of temperature and solar radiation. |
|
Although March marks the beginning of climatological spring, the volatile month brought several large winter storms across portions of the northern, central, and even south-central parts of the U.S. The largest of these storms, from March 7-10, brought snow from south-central Texas through western New England. The greatest accumulation was in Columbus, Ohio, where 20.5 inches (52.1 cm) was reported, a new all-time record for a single storm. Earlier in the month, parts of New England and much of Maine received a heavy snowfall on March 2. |
 Click for larger satellite-derived image of snow depth on March 9, 2008 |
|
Click for larger MODIS image of snowfall over the Upper Midwest on April 1, 2008  Click for larger seasonal snowfall chart in Caribou, ME as of March 21, 2008 |
Several cities set new seasonal snowfall records during March. Madison, Wisconsin set a new seasonal record snow total of 100.1 inches (254.2 cm) on March 24, breaking the previous record of 76.1 inches (193.3 cm) from the 1978-79 season. Milwaukee, WI had its second snowiest winter on record as of March 24. The seasonal snowfall total in Caribou, ME on March 21 reached a new all-time record when the 2007-2008 total of 184.5 inches (468.6 cm) surpassed the previous record of 181.1 inches (460.0 cm) set during the 1954-55 snowfall season. By the end of the month, the snowfall total at Caribou was 190.7 inches (484.4 cm). Snowfall records at Caribou began in 1939. By the end of March, the winter of 2007-08 in Concord, NH ranked as the second snowiest on record, only six inches (15 cm) shy of the all-time seasonal record of 122 inches (310 cm) set in the winter of 1873-4. |
|
The map to the right depicts the snowpack levels in many Rocky Mountain basins on April 1, 2008, illustrating above-average snow cover over much of the Rockies and Cascades in the western U.S. Some areas in Oregon, Washington, Arizona, New Mexico, and Nevada had levels above 180% of normal at the beginning of April. Conversely, much of Arizona and southern New Mexico and parts of Wyoming, Montana, Nevada and California had levels below normal, as did much of eastern Alaska. Much of this snowpack is residual from heavy events in previous months, as March brought relatively little precipitation across Utah, Arizona, Nevada and California, more typical of a La Niña winter. Above-average snowfall this season is bringing relief to many areas of the Western U.S. that have been plagued by drought in recent years. |
 Click for larger image of Mountain Snowpack on April 1, 2008 |
More information on March severe winter weather can also be found on NCDC's Hazards page. |
February
 click here for animation |
 click here for animation |
|
The two satellite-derived images above show the daily snow cover across the Northern Hemisphere (left map) and North America (right map) throughout February 2008. By clicking on the images, the residual snowpack across much of North America and Asia and the gradual expansion of sea ice across parts of the North Atlantic, North Pacific and portions of the Great Lakes can be seen during the month. In addition, multiple snowstorms can be seen across eastern Europe, Iran, Mongolia, China, and the United States during February. By the end of the month, much of the snow cover had begun to recede with the gradual increase of temperature and solar radiation. |
|
February brought a series of large winter storms across much of the northern two-thirds of the U.S., beginning with a major winter storm on February 5-6 that impacted a swath from northwestern Missouri through northern Illinois and southern Wisconsin to Michigan. The next week, a strong mid-latitude system brought several inches of snow from central Oklahoma and Missouri through the Ohio River Valley to New England on February 12-15, 2008. By the end of the month, Boston's Logan International Airport broke a new February record for total precipitation, and parts of Wisconsin have also set new seasonal snowfall records. Numerous other locations in New England are set to break new seasonal snowfall records if March snowfall totals are near average. Although the excessive winter precipitation may aid many areas in the Northeast that experienced a relatively dry fall, it has wreaked havoc on many roofs and local snow removal budgets. |
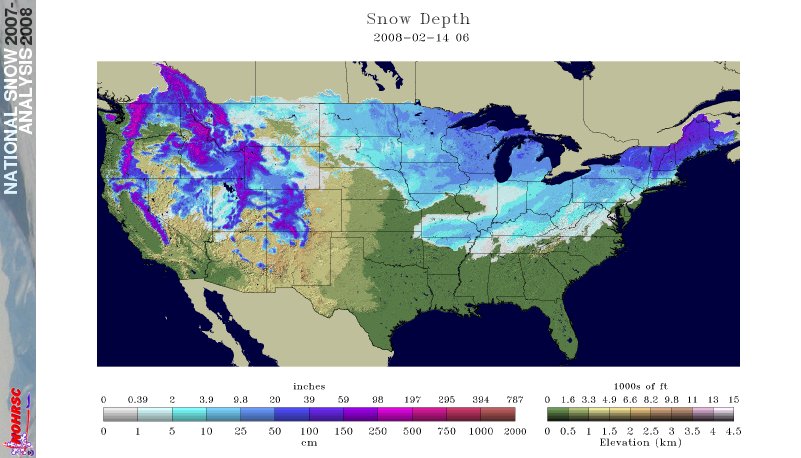 Click for larger satellite-derived image of snow depth on February 14, 2008  Click for larger MODIS satellite image showing snow and ice on February 16, 2008 |
 Click for larger image of Mountain Snowpack on March 1, 2008 |
The map to the left depicts the snowpack levels in many Rocky Mountain basins on March 1, 2008, illustrating above-average snow cover in much of the Rockies, Cascades, and Sierra Nevada in the western U.S. Some areas in Oregon, Washington, Arizona, New Mexico, Nevada and southern Colorado had levels above 180% of normal at the beginning of March. At the end of February, new snowfall records for the season-to-date were set in both Telluride and Aspen, Colorado. Conversely, parts of Wyoming, Montana, Nevada and north-central Washington had levels below normal, as did much of eastern Alaska and southern New Mexico. Above-average snowfall this season is bringing relief to many areas of the Western U.S. that have been plagued by drought in recent years. |
More information on February severe winter weather can also be found on NCDC's Hazards page. |
January
 click here for animation |
 click here for animation |
|
The two satellite-derived images above show the daily snow cover across the Northern Hemisphere (left map) and North America (right map) throughout January 2008. By clicking on the images, the gradual expansion of sea ice across parts of the north Atlantic and portions of the Great Lakes can be seen throughout the month as well as multiple snowstorms across eastern Europe, Iran, Mongolia, China, and the United States during January. 54 deaths were blamed on heavy snowstorms in China during the last few weeks of January, many from a bus crash on an icy road on January 29. Hundreds of thousands of workers were stranded at bus and railway stations due to delays from the icy weather, unable to return home for the Chinese New Year. On January 30, a rare snowstorm swept across the Middle East, blanketing many parts of the Holy Land with several inches of snow. Amman, Jordan received a foot (30.5 cm) of snow, closing some roads, and many parts of Lebanon experienced disruptions in their power supplies. |
|
The second day of 2008 brought snow to areas of Indiana, Ohio and the Appalachians through the Northeastern United States. Parts of New England received the heaviest amounts, with some areas receiving storm totals of over 15 inches (38 cm) in several areas of central and eastern Maine. On morning of January 11, Iraqis in Baghdad woke up to the novelty of falling snowflakes as the city experienced its first snowfall in about 100 years. |
 Click for larger MODIS snow image on January 2, 2008 |
 Click for larger image of Snow Depth on January 20, 2008 |
The map to the left depicts the satellite-derived accumulated snow depth on January 20, 2008, illustrating a heavy snow cover in the Rockies, Cascades, and Sierra Nevadas in the western U.S., and light to moderate snow cover over much of the northern half of the country. Light snow can also be seen in many parts of the Southeast, including a narrow swath from Southern Mississippi to Alabama and Georgia, widening across North Carolina and Virginia up through new England. |
|
The snowpack levels in much of the Rocky Mountains were near or above normal at the end of January, 2008. Due to several large weather systems that moved onto the West coast during the month, some snowpack levels in many parts of the Cascades and Sierra Nevadas are at levels over 160% of normal at the end of January. Many parts of southwestern Colorado, southern Utah, and Arizona also had over 150% of normal snow water equivalent, although much of Wyoming and parts of Montana had levels below 70% of normal. |
 Click for larger PDF image of current snow water equivalent percent of normal on February 1, 2008 |
More information on January severe winter weather can also be found on NCDC's Hazards page. |
December
 click here for animation |
 click here for animation |
|
The two satellite-derived images above show the daily snow cover across the Northern Hemisphere (left map) and North America (right map) throughout December 2007. By clicking on the images, the advance of sea-ice across Hudson Bay and parts of the Arctic can be seen through the month as well as the snowstorms across eastern Europe, Kazakhstan, northeast China, and the Northeast, Midwest and Great Plains areas of the U.S. in December. |
 Click for larger image of Snow Depth on December 17, 2007 |
The map to the left depicts the satellite-derived accumulated snow depth on December 17, illustrating a wide swath of heavy snow cover across the southern Great Plains through New England. A few days earlier, a large snow and ice storm on December 10-11 wreaked havoc across Oklahoma, Kansas, Missouri, Iowa, Illinois and Nebraska. It knocked out power to over 600,000 Oklahoma residents and indirectly caused over twenty fatalities in that state alone, prompting the governor to declare the ice storm the worst in Oklahoma history. The same system later brought heavy amounts of snow to the Northeast, slamming Boston with up to ten inches (25.4 cm) of snow during the evening rush hour on December 13, stranding commuters in their cars for as long as six hours for normally short commutes. |
|
As many residents began to clear out from the last storm, another strong upper-level system moved across the Central U.S. through New England December 15-17, bringing ice, sleet, damaging winds, and as much as eighteen inches of snow in some areas. Detroit, MI, received nine inches (22.9 cm) of snow, tying it as the 9th biggest December snowstorm on record. By the 17th, more snow (19.6 inches/49.8 cm) fell in Boston, MA so far this snow season than all of last year (17.1 inches/43.4 cm). The weekend timing of the storm minimized the effects of the wintry blast, although it caused the cancellation or delay of hundreds of flights from Chicago to Boston. |
 larger image |
More information on December severe winter weather can also be found on NCDC's Hazards page. |
November
 click here for animation |
 click here for animation |
|
The two satellite-derived animations above show the daily snow cover across the Northern Hemisphere (left map) and North America (right map) throughout November 2007. The maps illustrate the advance of the snow pack in the northern latitudes. By clicking on the images, the gradual expansion of snow and ice cover, with occasional setbacks, is shown throughout the month of November. During the last several days of November, snow cover expanded across much of Canada, the U.S. and parts of Asia. By the 30th, much of Russia, Kazakhstan, Mongolia, Alaska, Canada and parts of Europe and the western U.S. were snow covered. Arctic sea-ice also increases throughout the month and ice cover on Hudson Bay begins to form along the perimeter. Great Lakes ice cover has yet to develop in 2007. |
 larger image |
The map to the left depicts the satellite-derived accumulated snowfall present across a wide swath from the southern Great Plains to the Great Lakes on November 24th. The season's first large winter storm in the central U.S. swept across this region from the day before Thanksgiving through Saturday, causing dangerous road conditions for many travelers. More information on November severe winter weather can also be found on NCDC's Hazards page. |
October
 click here for animation |
 click here for animation |
|
The two satellite-derived images above show the daily snow cover across the Northern Hemisphere (left map) and North America (right map) throughout October 2007. The maps show very small amounts of snow cover on October 1st, illustrating the beginning of the snow pack in the northern latitudes. By clicking on the images, the gradual expansion of snow and ice cover is shown to increase throughout the month across much of Siberia as well as parts of Alaska and Canada. Snow events in the U.S. are evident in the Rockies and the Sierras throughout the month of October, yet snow cover is short-lived. More information on significant winter weather and other hazards can be found on NCDC's Hazards page. |
Useful Links
Questions?For all climate questions other than questions concerning this report, please contact the National Climatic Data Center's Climate Services Division:
| Climate Services Division NOAA/National Climatic Data Center 151 Patton Avenue Asheville, NC 28801-5001 fax: 828-271-4876 phone: 828-271-4800 email: questions@ncdc.noaa.gov |
For further information on the historical climate perspective presented in this report, contact:
|
Jay Lawrimore NOAA/National Climatic Data Center 151 Patton Avenue Asheville, NC 28801-5001 fax: 828-271-4328 email: Jay.Lawrimore@noaa.gov |
NCDC / Climate Monitoring / Climate of 2007 / Snow Summary / Help


