Preliminary Simulation Description
We have made several MOST (Method Of Separation Tsunami) numerical
model runs for initial conditions corresponding to different fault
plane parameters, with strike, dip and rake corresponding to the
Harvard CMT fault plane solution.
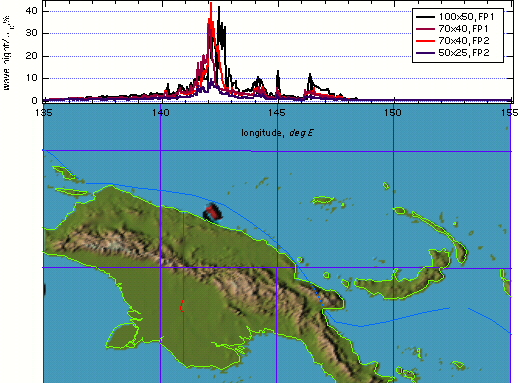 |
Figure 1. Summary of Maximum Wave Height Distributions Along Coast for Cases |
| Parameter |
Case 1
FP 2 |
Case 2
FP 2 |
Case 3
FP 1 |
Case 4
FP 1 |
| Strike (deg) |
292 |
292 |
147 |
147 |
Dip (deg) |
79 |
79 |
14 |
14 |
Rake (deg) |
82 |
82 |
124 |
124 |
Slip (m) |
1 |
1 |
1 |
1 |
Length (km) |
50 |
70 |
70 |
100 |
Width (km) |
25 |
40 |
40 |
50 |
Top Depth (km) |
5 |
5 |
5 |
5 |
Energy (N-m * 10**19)
(Assumes rigidity = 2*10**11 N/m**2) |
25 |
56 |
56 |
100 |
 Animations Animations
|
Case 1 |
Case 2 |
Case 3 |
Case 4 |
Maximum Computed Wave Heights |
|
Case 2 |
Case 3 |
|
Note the following important caveats:
- The Harvard CMT energy estimate is 4.3*10**19 N-m, so the
energy of these sources is much larger. Energy estimates, however,
can easily be off by very large factors. And, had we matched
the Harvard CMT energy exactly, we may not have been able to
track the evolution of the tsunami waves. This is because we
lack high-resolution bathymetry for the simulation, and are using
a relatively coarse 2-minute grid. Furthermore, a small source
would not be resolved well on this coarse grid.
- The absolute values of the wave amplitudes in shallow regions
are underestimated, since the waves are too short to be resolved
by the 2-minute grid. In deeper water, the wavelengths are longer,
can be resolved by the grid, and the computations are more accurate.
- Only the relative distribution of maximum wave-heights along
the shore are meaningful, not the absolute values.
- No inundation computations were made, and the coastal boundary
is assumed to be a solid wall at the 10-meter bathymetric contour.
In terms of results, we also note that:
- Both animations indicate wave focusing in the Sissano area,
but also display focusing and relatively large amplitudes at
the islands across from Sissano. These islands are Wuvulu, Ninigo,
Aua and Hermit. (Wuvulu and Aua may be inhabited, since our 1992
map seems to indicate the presence of villages.)
- The distribution pattern of maximum values along the coast
(Figure 1) are very similar for all cases simulated, i.e., there
is a relative insensitivity to these particular source mechanisms.
- Finally, we point out the obvious. These sources, with much
larger energy than indicated by the Harvard CMT estimate, fail
to reproduce the eyewitness reports of 7-10 m wave heights. This
is not surprising, in view of similar preliminary computations
after the Nicaragua, Flores and Okushiri tsunamis, for example.
Either energy was concentrated at much smaller spatial scales
than indicated by the single fault plane source mechanism, or
other generation mechanisms, such as landslide(s) or some type
of resonance phenomena played a role. As noted above, a coarse
grid will lead to underestimates in wave heights, and this may
also contribute to differences between modeled and observed.
However, we suspect that, even with finer grids, the sources
would not result in 7-10 m wave values.
DISCLAIMER: The numerical results are very preliminary, and cannot
be used for emergency or mitigation planning, but should be considered
as only a qualitative indication of the PNG tsunami energy distribution
pattern.
|