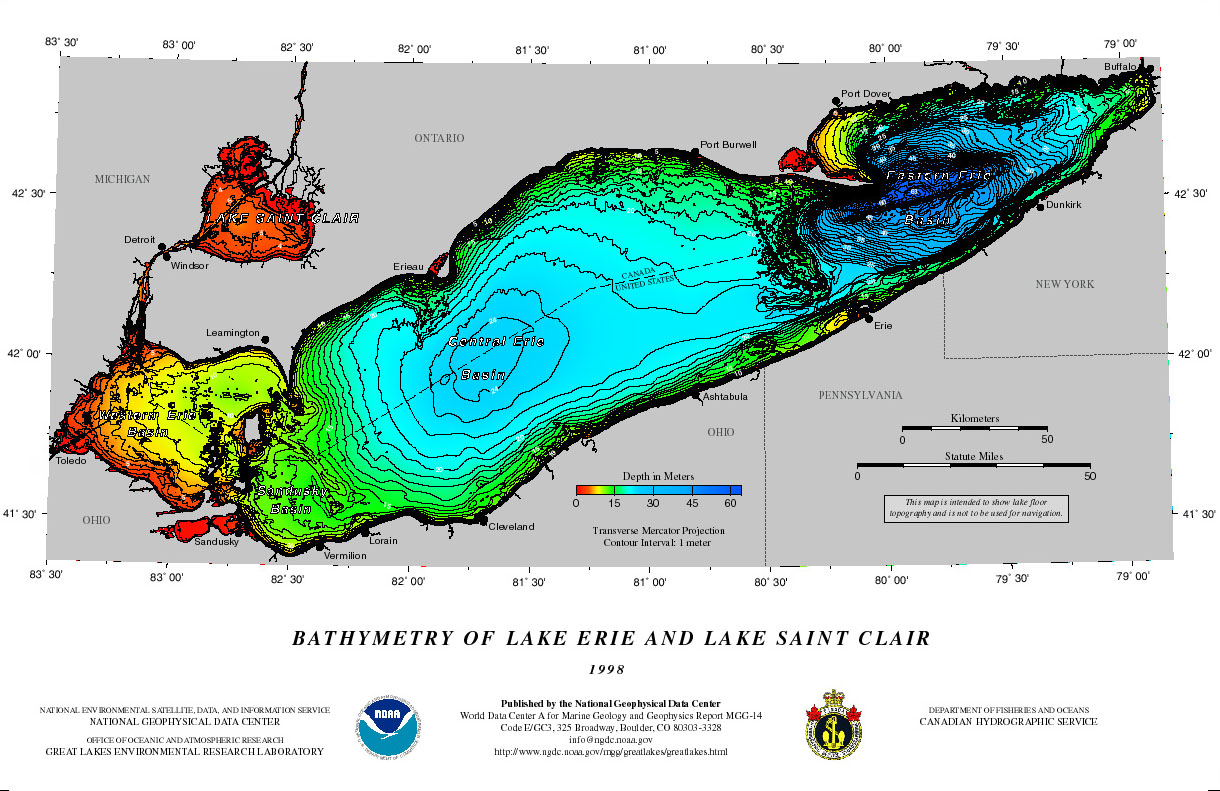
Bathymetry of Lake Erie and Lake Saint Clair
Color Posters and Digital Data on CD-ROM
DATA ANNOUNCEMENT 98-MGG-01
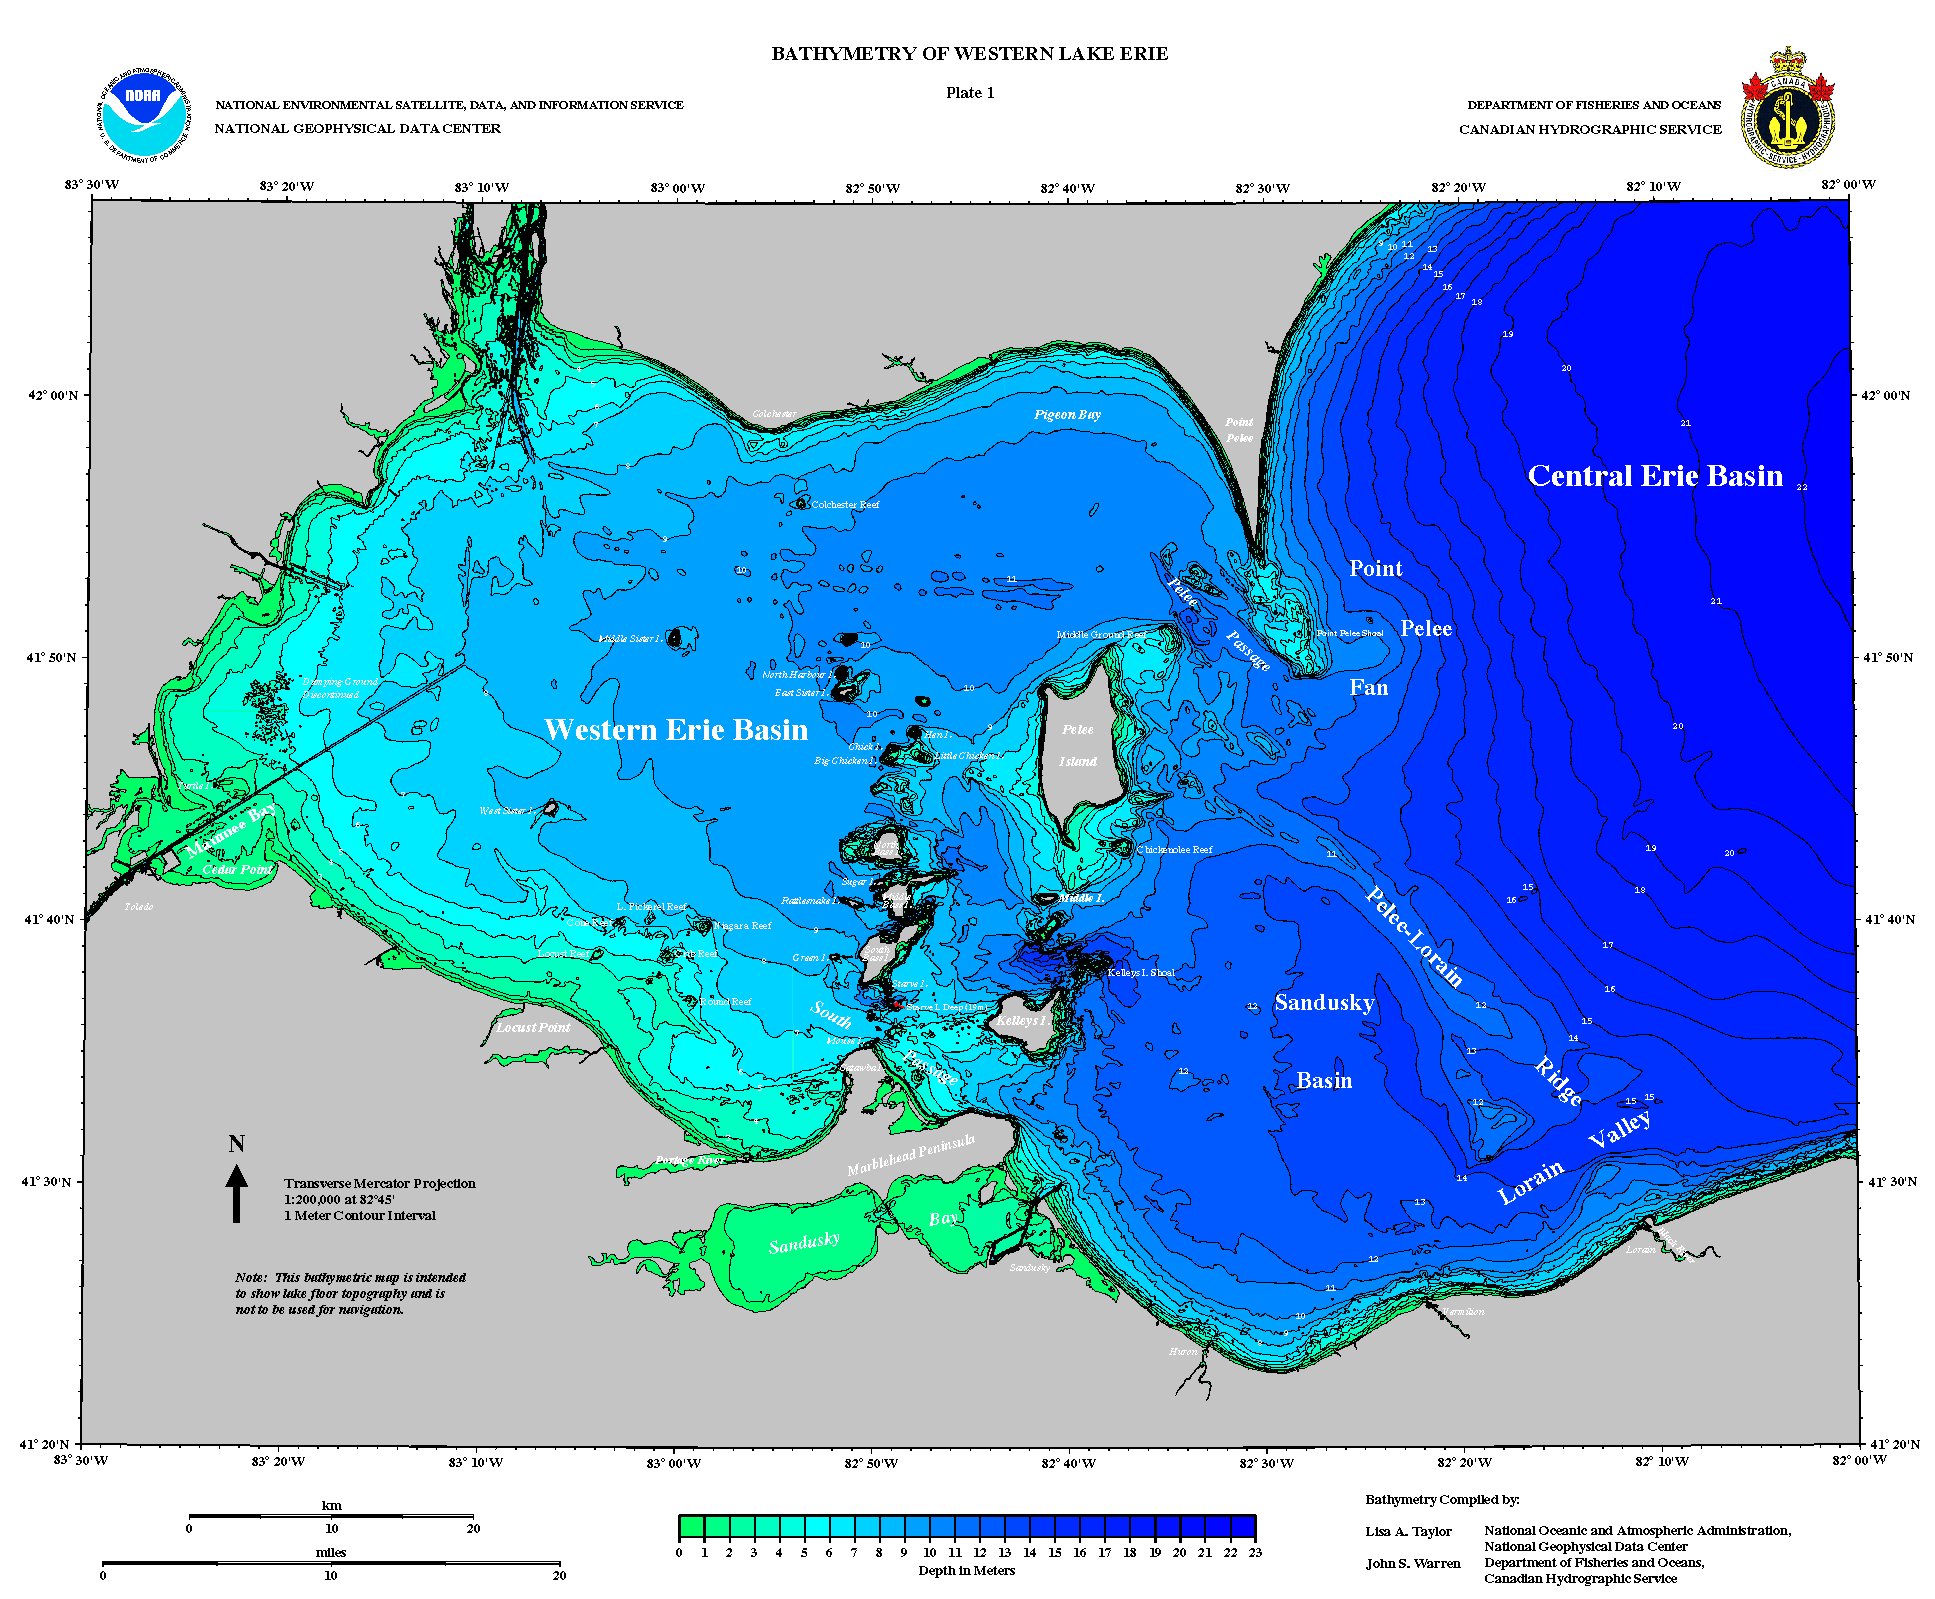
The National Geophysical Data Center announces a full color poster measuring 26x50 inches depicting the bathymetric contours of Lake Erie and Lake Saint Clair. Color diffracting glasses are included with the poster for viewing in 3-D. A CD-ROM containing data, images and text describing the geomorphology of the lake floors is also available. The CD-ROM contains the following digital files: (1) Vector contours at a one meter interval in ASCII xyz and ARC/INFO interchange formats; (2) A 3 arc-second bathymetric grid with software that will enable the user to subsample, subset and reformat the data; (3) Color images of the lakes. This new bathymetry was compiled at a one meter contour interval at scales ranging from 1:100,000 to 1:2,500 and registered to the NOAA nominal scale 1:80,000 digital vector shoreline. The resulting detail, exceeding that achieved in any previous bathymetry for the two lakes, defines more clearly the shape and location of previously known features and reveals other features for the first time. The wall-size poster of Lake Erie and Lake Saint Clair is at a scale of 1:250,000 and measures 3 feet by 6 feet. PREPARATION OF LAKE ERIE AND LAKE SAINT CLAIR BATHYMETRY The bathymetry was compiled using all good quality historic hydrographic sounding data collected since 1903 from the NOAA National Ocean Service and its predecessor agency for Great Lakes Surveying, the Army Corps of Engineers, and the Canadian Hydrographic Service. Digital sounding data combined with sounding data archived only on paper were used in the compilation. Trackline density ranges from about 125 m to 500 m for nearshore areas and 500 m to 2500 m for the open lake regions. In preparation for bathymetric contouring, digital soundings were converted to metric units and plotted in color; separate colors were assigned to the various depth ranges. From the paper sheets, contours in metric units were generated directly on overlays. The compilation sheets were scanned and vectorized and then edited using ARC/INFO. Images were constructed using the resulting digital vector bathymetric contour data using Adobe Illustrator and the publicly-available software "Generic Mapping Tools" (GMT). NGDC has the capability of generating custom graphics for specific regions. These custom graphics are available as digital files, paper prints, transparencies, or 35 mm slides. For more information and prices associated with custom graphics, please refer to the contacts listed below.
For more information on the Great Lakes Data Rescue Project, see the |