

 Climate Monitoring / Climate of 2007 / Atlantic Hurricanes / Help Climate Monitoring / Climate of 2007 / Atlantic Hurricanes / Help
Use these links to access detailed analyses of Global and U.S. data 
MAY | JUNE | JULY | AUGUST | SEPTEMBER | OCTOBER| NOVEMBER | DECEMBER SEASONAL SUMMARY | Links [Andrea (5/9 -5/11) | Barry (6/1-6/2) | Chantal (7/30-8/1) | Dean (8/13-8/23) | Erin (8/14-8/19) Felix (8/31-9/5) | Gabrielle (9/7-9/11) | Humberto (9/12-9/14) | Ingrid (9/12-9/17) | Jerry (9/23-9/25) Karen (9/25-9/29) | Lorenzo (9/25-9/28) | Melissa (9/28-9/30) | Noel (10/27-11/2) Olga (12/11-12/13) ]
|
||||||||||||||||||||||||||||||||||||||||||||||||||||||||||||||||||||||||||||||||||||
|
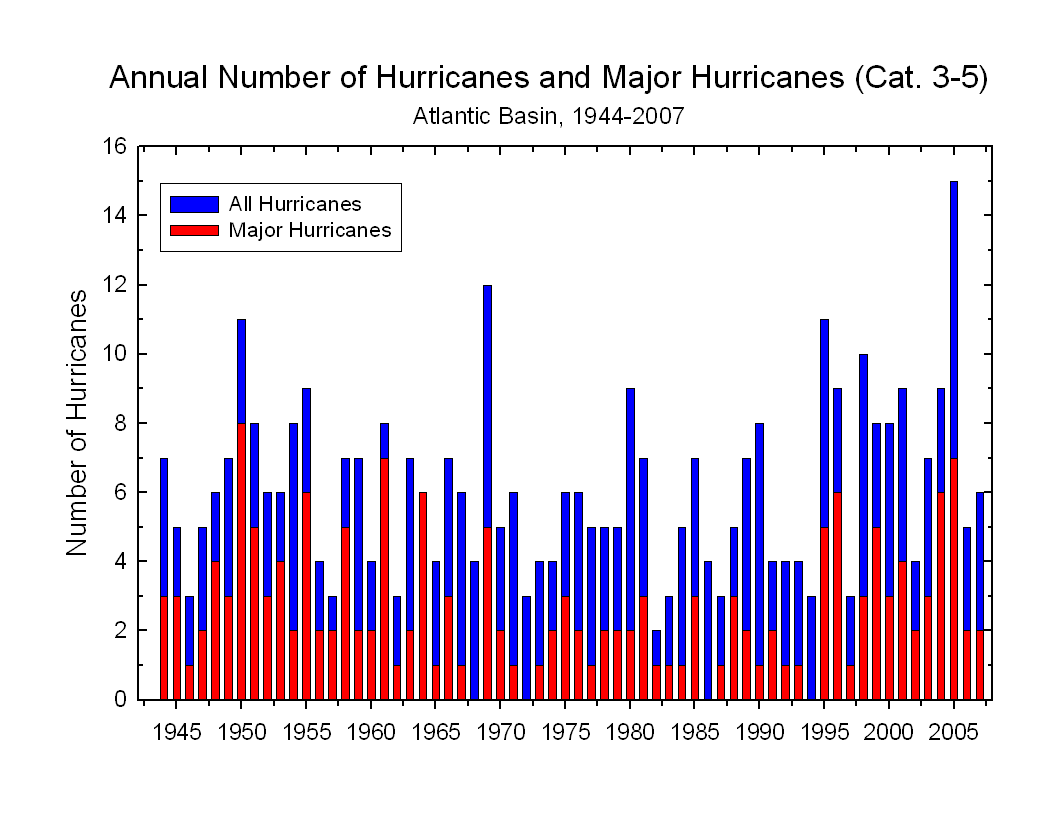
Averages: Click here for information on the 2006 North Atlantic Hurricane season. |
 Click for larger image Atlantic ACE |
|
2007 Season Summary: The season began early in 2007 with the development of Subtropical Storm Andrea off the southeastern coast of the United States on May 9, becoming the first named storm in May since 1981. Andrea quickly weakened to a depression the next day without making landfall. June brought Tropical Storm Barry in the Southeastern Gulf of Mexico; Barry made landfall in Pinellas County, Florida with maximum sustained winds of 51 mph (45 knots or 83 km/hr). Only one tropical storm, Chantal, formed in the Atlantic basin in July and did not make landfall. Three tropical storms formed in August: Dean, Erin, and Felix. Dean later developed into a powerful hurricane with maximum sustained winds of 165 mph (144 knots or 265 km/hr) that made landfall near Costa Maya, Mexico and is blamed for over forty deaths in that region. Seven tropical storms formed in the Atlantic basin in September, the busiest month of 2007. Hurricane Felix, which formed on August 30, grew into a Category 5 storm and made landfall near the Nicaragua-Honduras border. News reports indicate that Felix was responsible for over 130 deaths and many more injuries in these countries. The maximum sustained winds of Hurricane Felix at the time of landfall were estimated to be 160 mph (140 knots or 260 km/hr). Tropical storm Gabrielle made landfall near Cape Lookout, North Carolina on September 9 and weakened to a depression the next day. Hurricane Humberto was the only hurricane to strike the mainland U.S. in 2007, rapidly intensifying to hurricane status in the early morning hours of September 13. One death is blamed on this storm. At the end of September, Hurricane Lorenzo made landfall near Veracruz, Mexico as a Category 1 storm, resulting in six fatalities. In October, Category 1 Hurricane Noel brought heavy rains and major flooding to parts of Puerto Rico, Hispaniola, and Cuba, causing numerous fatalities. News reports estimate that at least 147 people died as a result of this storm, making it the deadliest storm of the season in the Atlantic basin. Noel later transitioned to an extratropical low and hit the area between eastern Long Island to New England in the U.S., causing considerable tree and power line damage before passing into the Maritimes. No tropical cyclones formed in the Atlantic basin in November, although one tropical cyclone developed in December after the official end of the Atlantic hurricane season. In mid-December, Sub-Tropical Storm Olga developed in the Caribbean, and eventually gained tropical characteristics. According to press reports, excessive rains from Tropical Storm Olga over the interior mountains of the islands of Puerto Rico and Hispaniola generated flash floods killing at least two dozen people. For additional information on these and all of the 2007 season storms in the Atlantic basin, please see the summaries below. | |
| Please note that convention reports tropical storm winds in knots (kt) and pressures in millibars (mb). |
 December
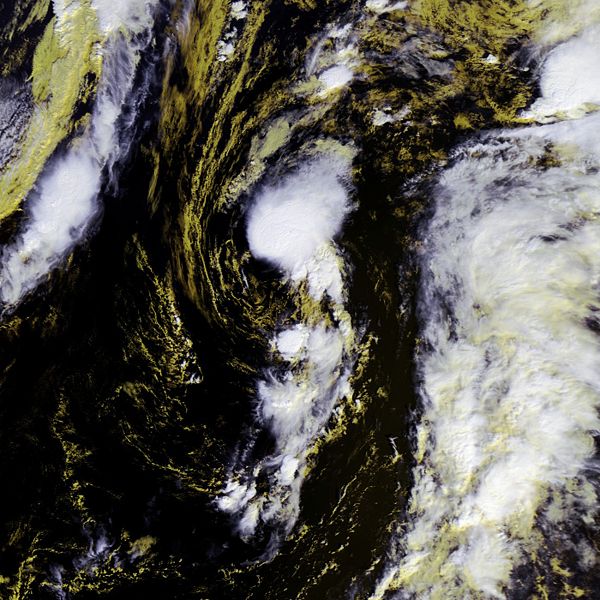
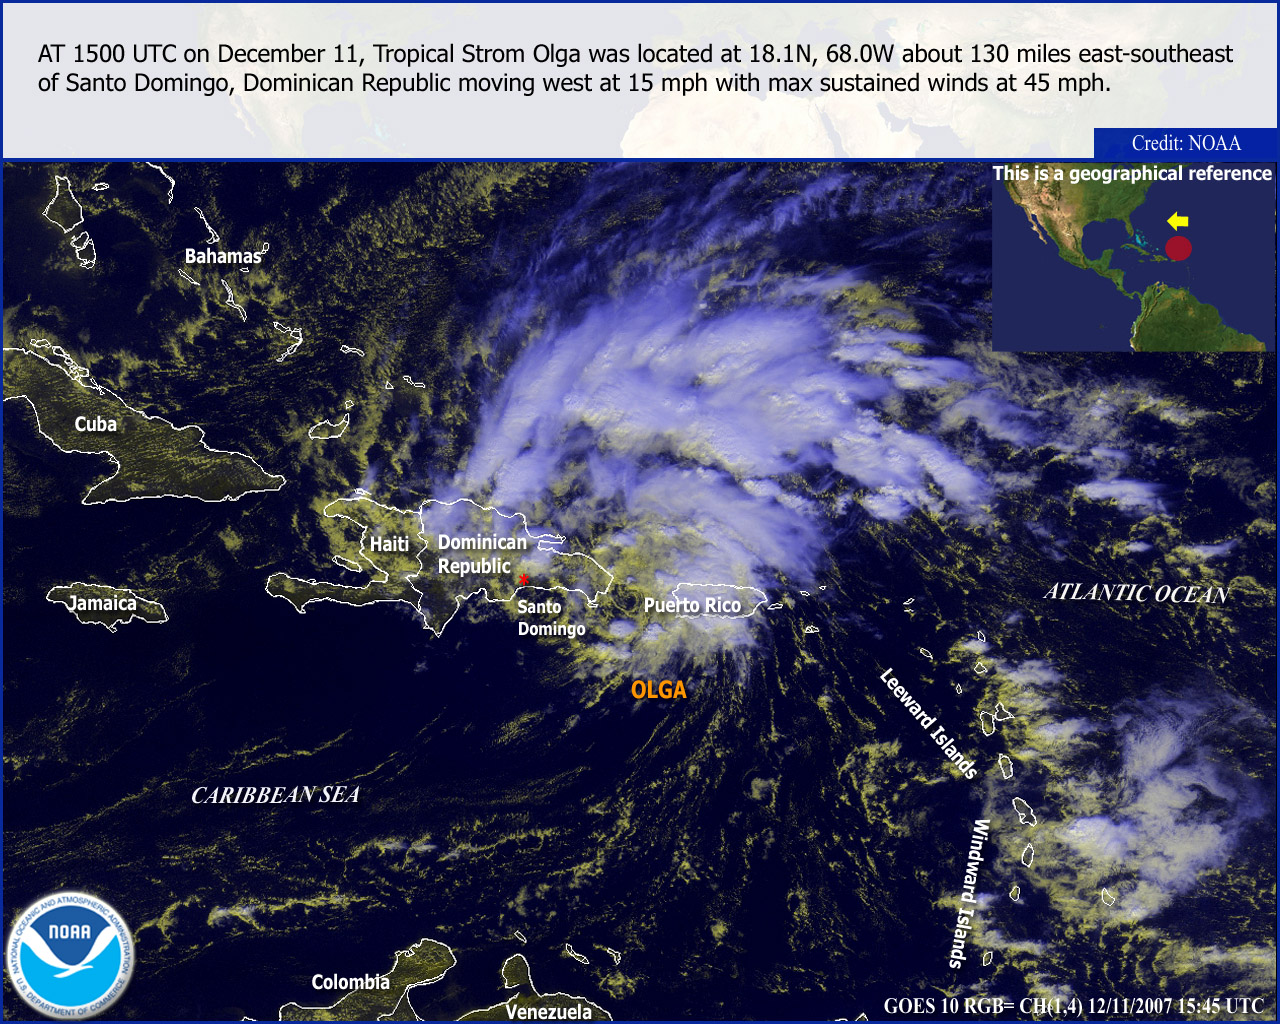 Tropical Storm Olga Satellite Image |
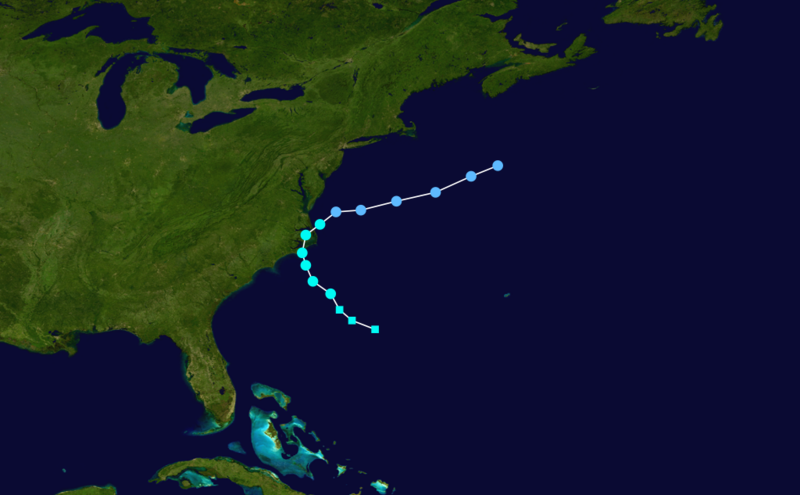
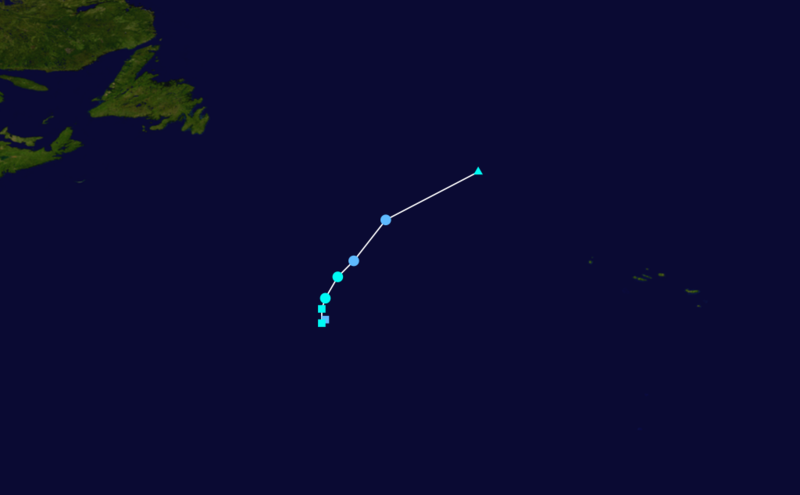
 Tropical Storm Olga Track  Saffir-Simpson Scale Color Legend |
Tropical Storm Olga developed on the evening of December 10 from a low pressure system located near the Virgin Islands and Puerto Rico. The storm originally formed as a sub-tropical cyclone, as the cold-core, upper-level low pressure circulation intensified and a broad surface circulation became well-defined. Observations from a nearby NOAA buoy provided an initial intensity of approximately 65 km/hr (35 knots or 40 mph) on evening of the 10th. Sub-Tropical Storm Olga moved westward along the northern coast of Puerto Rico, generating heavy rainfall in the mountainous interior of the island on the 11th. Olga began to lose its sub-tropical characteristics during the morning of December 11, eventually developing a warm core and transitioning to a tropical cyclone by the evening of the 11th. Tropical Storm Olga reached its peak intensity of 93 km/hr (50 knots or 58 mph) immediately before it made landfall along the eastern coast of the Dominican Republic during the evening of December 11. The storm lost some of its organization and weakened as it slowly moved westward across the island of Hispaniola, but generated torrential rain and flooding as it interacted with the high terrain of the island. On December 12, Olga weakened considerably, and was categorized as a Tropical Depression during the afternoon. The system eventually dissipated early on the 13th. At least two dozen people lost their lives to Olga in the Caribbean. According to local officials, flash floods associated with Olga killed at least 19 people in the Dominican Republic, where 35,000 people were forced to flee their homes. The strongest winds associated with Tropical Storm Olga were 93 km/hr (50 knots or 58 mph), and its lowest pressure was 1004 mb. More information on Tropical Storm Olga is available from the NOAA National Hurricane Center. | |
November
No tropical activity reported in the Atlantic basin in November.
October
 Hurricane Noel Satellite Image |
 Hurricane Noel Track Saffir-Simpson Scale Color Legend |
Tropical Depression Sixteen organized on the evening of October 27 over the eastern Caribbean. This storm intensified and became Tropical Storm Noel the next afternoon. Tropical Storm Noel made landfall in Haiti on October 29, then slowly passed through the western Caribbean near Cuba for the next few days, bringing torrential rain to the region. Noel, moving into the westerlies, picked up a little speed as it traveled northeastward through the Bahamas. Taking the opportunity of a brief period of decreased shear, Tropical Storm Noel strengthened into a hurricane on November 1. Simultaneously, a mid-level short wave began interacting with Noel, signaling the storm's impending extratropical transition. On November 2, Hurricane Noel began transitioning to a strong extratropical cyclone with sustained winds remaining at the Category 1 hurricane level. This slow transition continued as the storm moved northeast through November 4, when it passed over Labrador. At least 148 people lost their lives to Noel in the Caribbean. The strongest winds in Hurricane Noel were 130 km/hr (70 knots or 80 mph), and its lowest pressure was 980 mb. More information on Hurricane Noel is available from the NOAA National Hurricane Center. | |
September
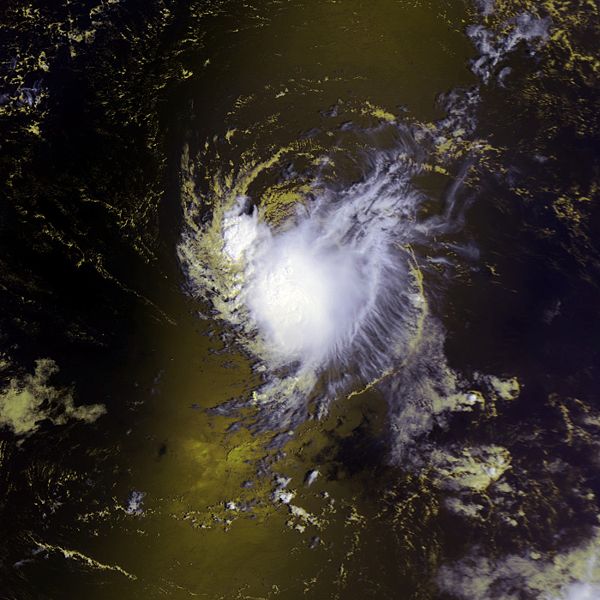
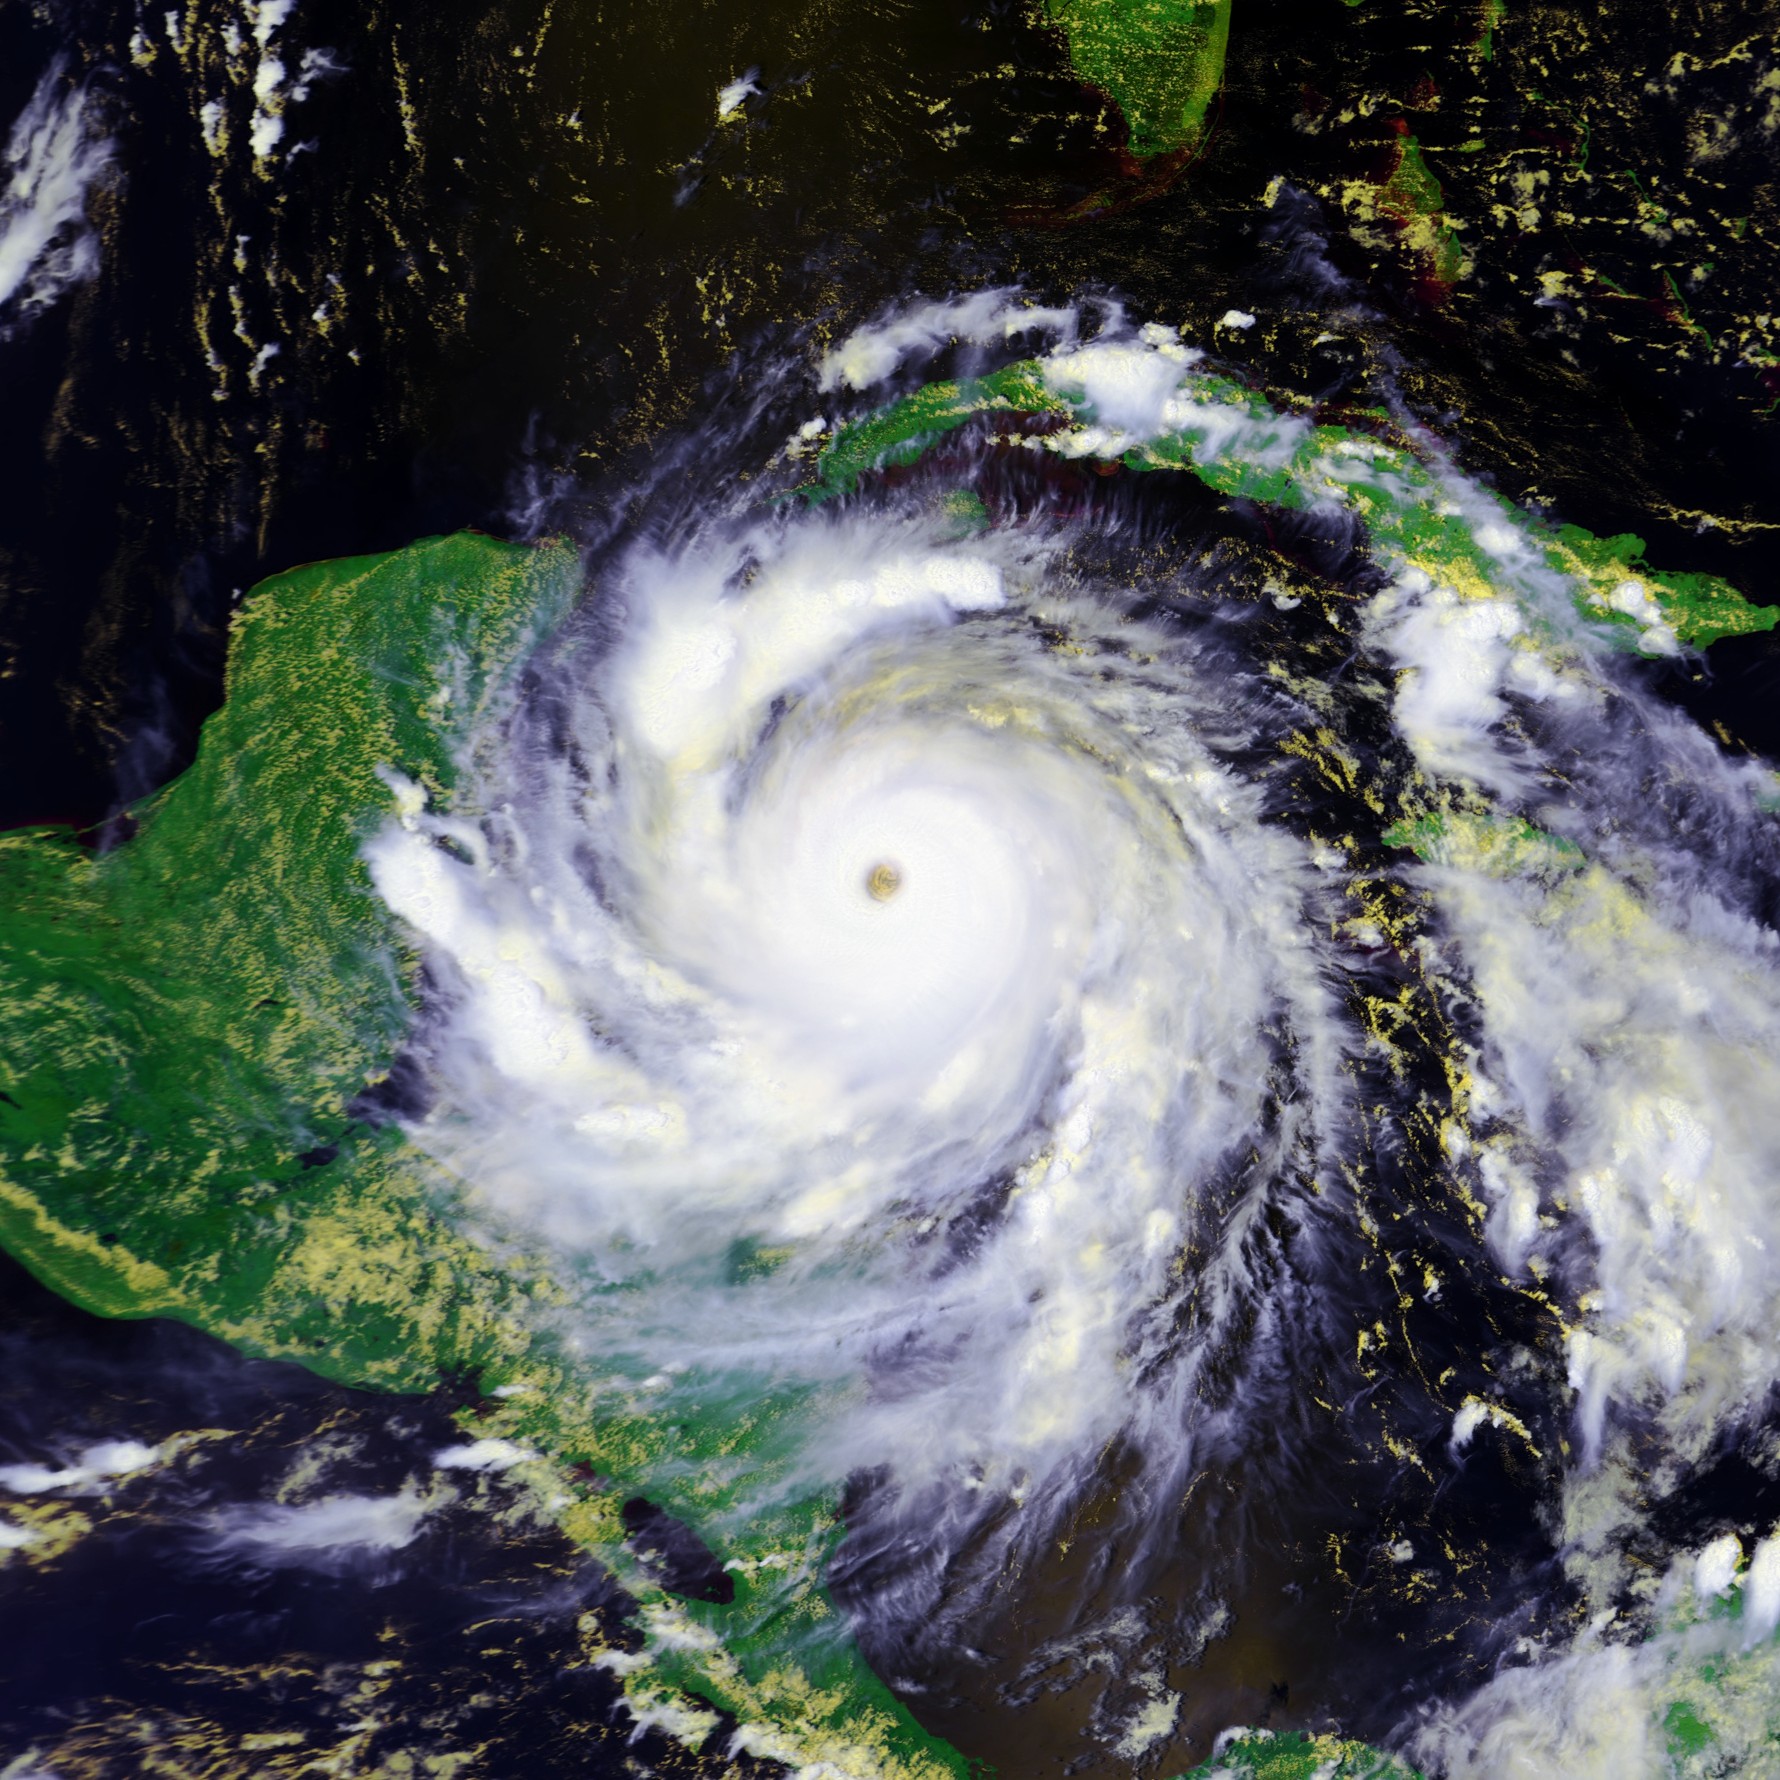
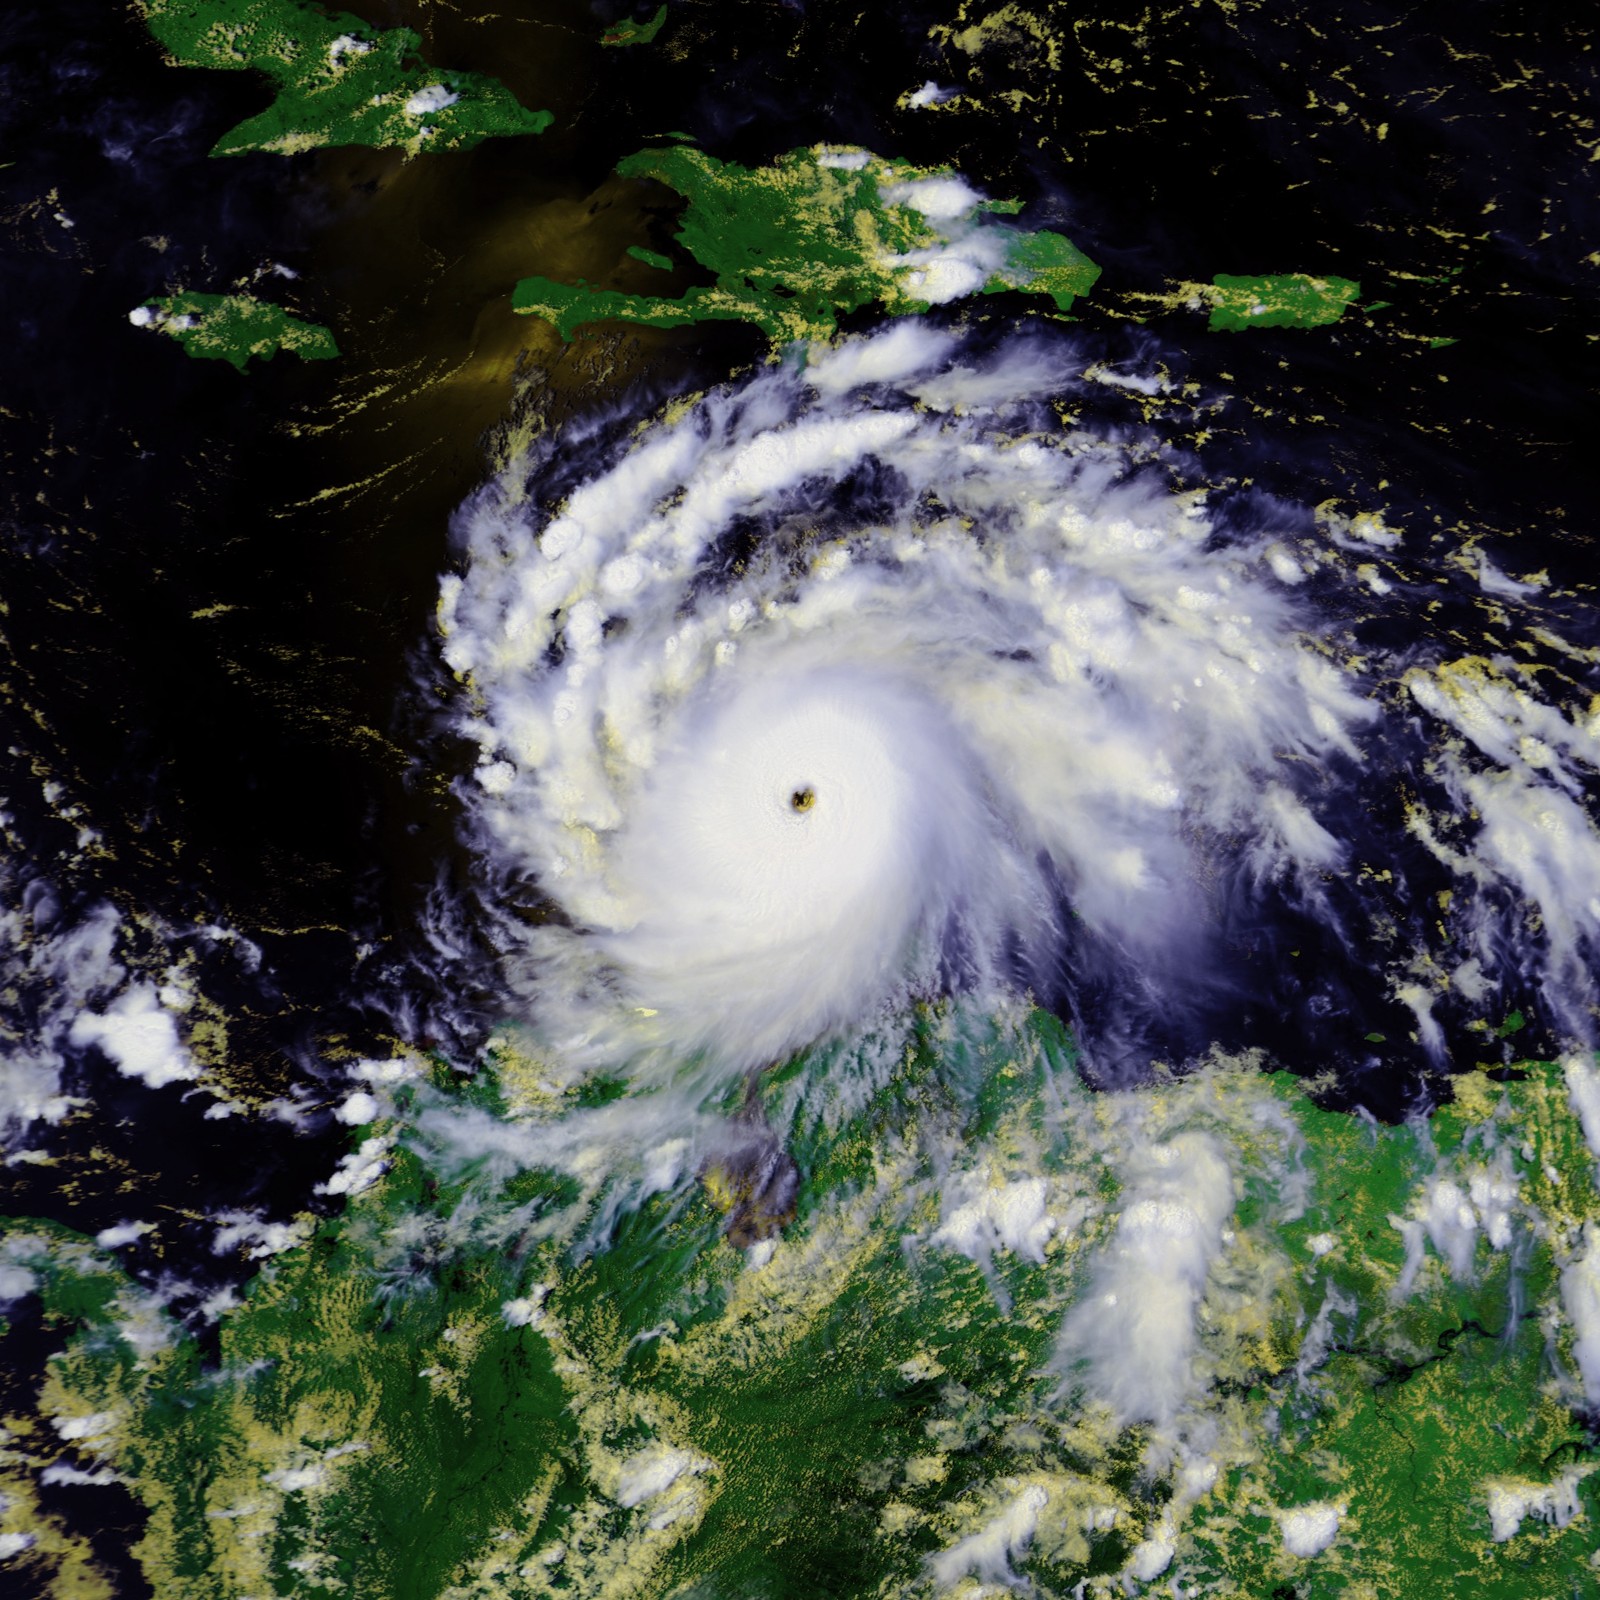 Hurricane Felix Satellite Image |
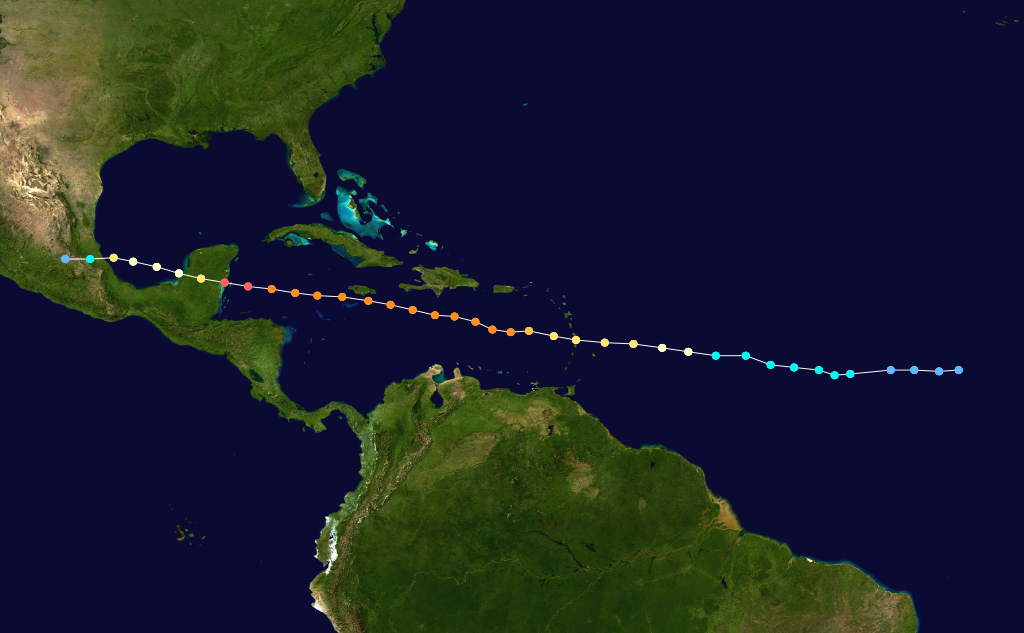
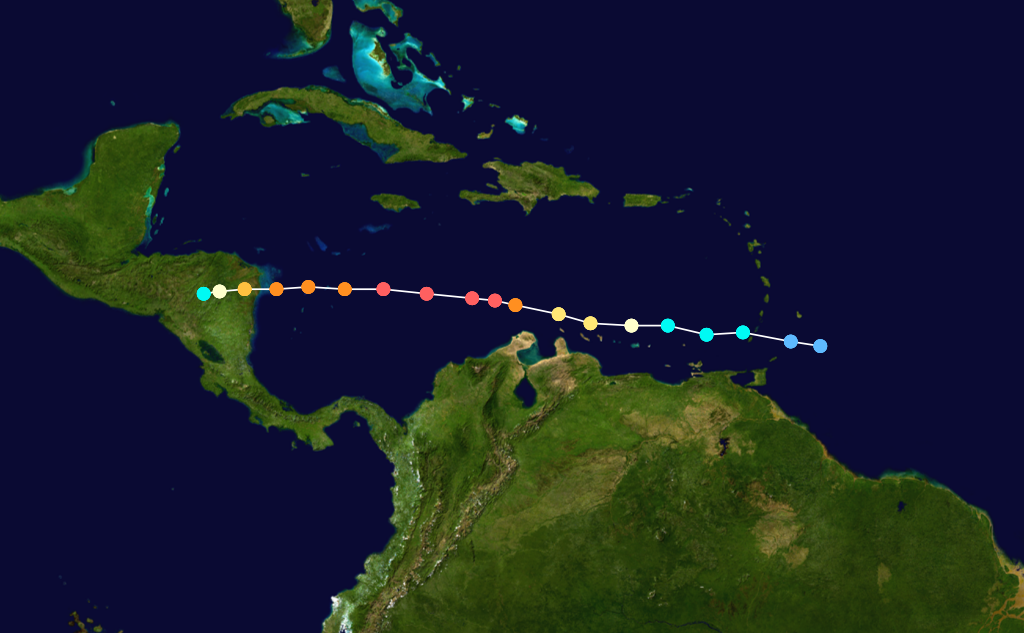 Hurricane Felix Track Saffir-Simpson Scale Color Legend |
On August 31, a westward-moving tropical depression formed east of the Windward Islands. It organized enough to be classified the next day as Tropical Storm Felix, and intensified later that day into a hurricane. Hurricane Felix continued to move westward over very warm waters and intensified into a Category 5 storm by late on September 2. Felix weakened briefly overnight and then strengthened into a Category 5 storm again before it struck northeastern Nicaragua on September 4. The rugged terrain of Central America weakened the storm significantly such that it was downgraded to a tropical depression on September 5. The strongest winds in Hurricane Felix were 270 km/hr (146 knots or 168 mph), and its lowest pressure was 929 mb. More information on Hurricane Felix is available from the NOAA National Hurricane Center. | |
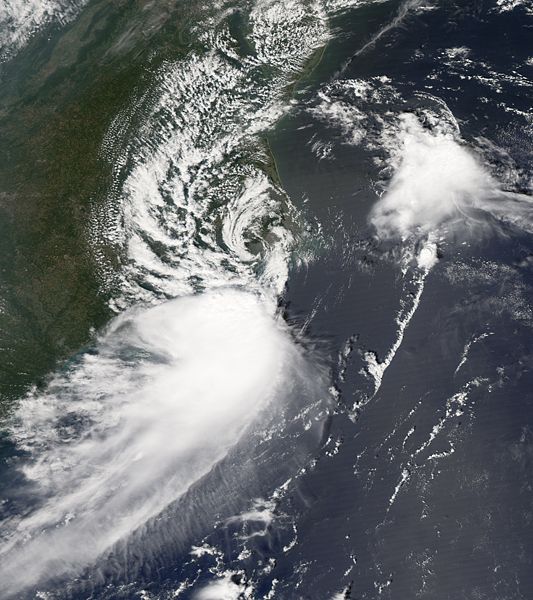 Tropical Storm Gabrielle Satellite Image |
 Tropical Storm Gabrielle Track Saffir-Simpson Scale Color Legend |
An area of low pressure off the Carolina coast developed into Subtropical Storm Gabrielle on September 7. Reconnaissance aircraft data suggested the presence of a weak warm core on the 8th, prompting a reclassification of Gabrielle as a tropical storm. The system passed over the Outer Banks of North Carolina on the ninth, and weakened to a depression the next day as it moved northeast. The final advisory was issued on September 11. The strongest winds in Tropical Storm Gabrielle were 85 km/hr (46 knots or 53 mph), and its lowest pressure was 1004 mb. More information on Tropical Storm Gabrielle is available from the NOAA National Hurricane Center. | |
 Hurricane Humberto Satellite Image |
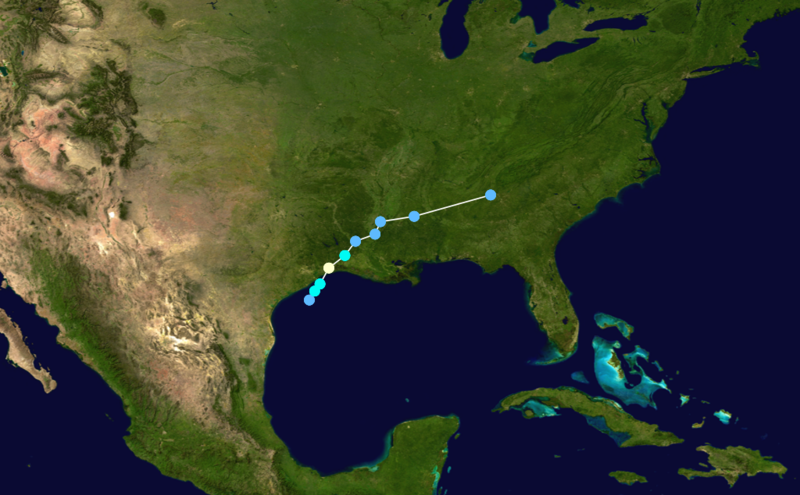 Hurricane Humberto Track Saffir-Simpson Scale Color Legend |
Hurricane Humberto began as an area of disorganized showers and thunderstorms off the coast of western Cuba on September 8. These storms moved slowly west-northwestward across the Gulf of Mexico and organized enough to be classified as Tropical Depression Nine on the morning of September 12. Within a few hours, the tropical depression had strengthened into Tropical Storm Humberto. The system turned northward and continued to intensify until it reached hurricane status early in the morning of September 13. Hurricane Humberto made landfall around 0700 UTC near High Island, Texas as a Category 1 hurricane. The storm rapidly weakened as it traveled northeast over land and dropped heavy amounts of precipitation on Louisiana, Mississippi, Alabama, and parts of Georgia and the Carolinas. Humberto is blamed for the death of a man who was killed by a falling carport in Bridge City, Texas. The strongest winds in Hurricane Humberto were 135 km/hr (73 knots or 85 mph), and its lowest pressure was 986 mb. More information on Hurricane Humberto is available from the NOAA National Hurricane Center. | |
 Tropical Storm Ingrid Satellite Image |
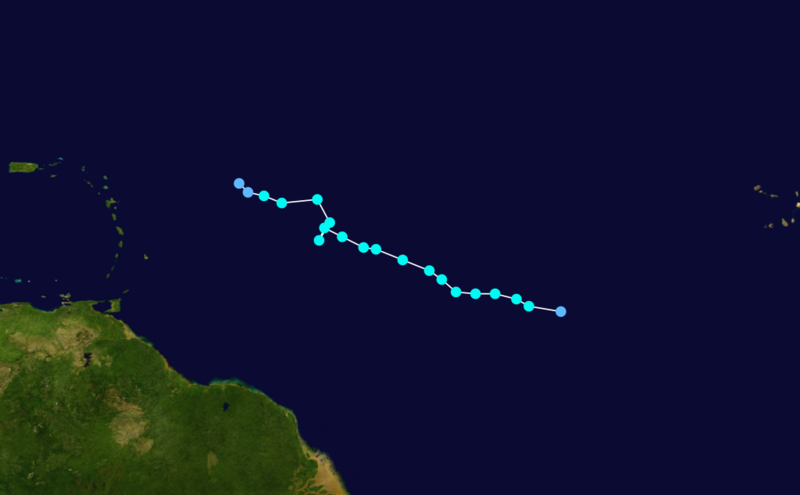
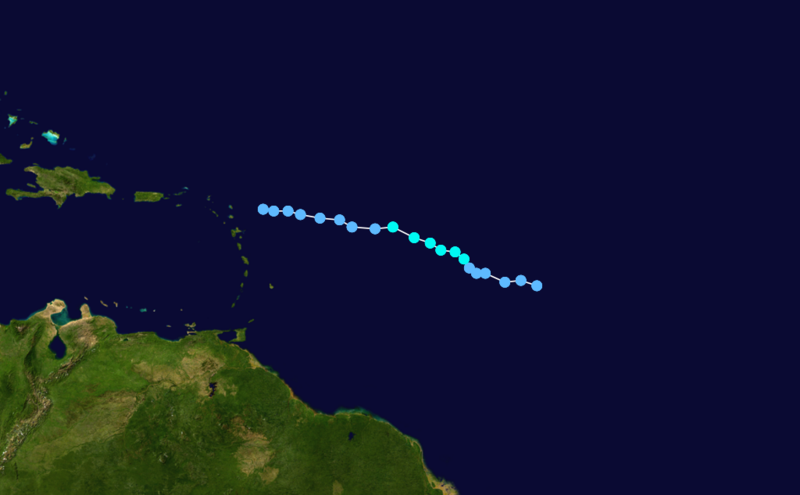 Tropical Storm Ingrid Track Saffir-Simpson Scale Color Legend |
A tropical wave 1820 km (1130 miles) east of the Lesser Antilles developed into Tropical Depression Eight on September 12 at the same time that the system that later became Humberto developed. Unlike Tropical Depression Nine, this depression developed slowly and did not become Tropical Storm Ingrid until September 14. Ingrid was weakened by strong upper-level winds and reclassified as a depression on September 15. The storm continued to grow increasingly disorganized and the final advisory was issued on September 17. The strongest winds in Tropical Storm Ingrid were 75 km/hr (40 knots or 46 mph), and its lowest pressure was 1004 mb. More information on Tropical Storm Ingrid is available from the NOAA National Hurricane Center. | |
 Tropical Storm Jerry Satellite Image |
 Tropical Storm Jerry Track Saffir-Simpson Scale Color Legend |
In the early morning of September 23, an extratropical area of low pressure was classified as a subtropical depression about 1705 km (1060 miles) west of the Azores. This depression quickly strengthened into Subtropical Storm Jerry later that morning and was reclassified as a tropical storm early on September 24. Tropical Storm Jerry weakened later on the 24th as it moved over cooler waters, then re-intensified back into a tropical storm later that day before being absorbed by a vigorous extratropical cyclone. The strongest winds in Tropical Storm Jerry were 75 km/hr (40 knots or 46 mph), and its lowest pressure was 1000 mb. More information on Tropical Storm Jerry is available from the NOAA National Hurricane Center. | |
 Hurricane Karen Satellite Image |
 Hurricane Karen Track Saffir-Simpson Scale Color Legend |
Karen began as a very large tropical wave off the coast of Africa that slowly organized into a tropical depression on September 25. Later that same day, the storm strengthened into Tropical Storm Karen. The system barely reached hurricane strength before weakening as a result of increased wind shear. The strongest winds in Hurricane Karen were 120 km/hr (65 knots or 75 mph), and its lowest pressure was 988 mb. More information on Hurricane Karen is available from the NOAA National Hurricane Center. Note: The National Hurricane Center later upgraded Karen to hurricane status. Please see the NHC's Tropical Cyclone Report on Hurricane Karen for more information. | |
 Hurricane Lorenzo Satellite Image |
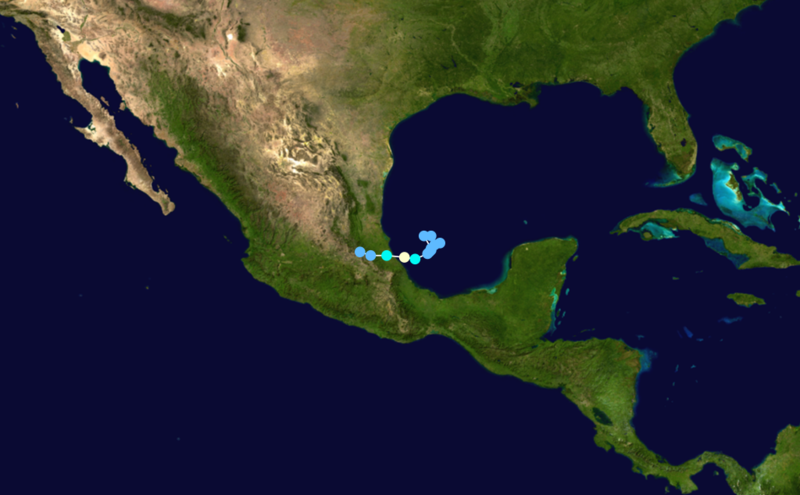 Hurricane Lorenzo Track Saffir-Simpson Scale Color Legend |
An area of convection that had been moving about the western Caribbean was classified as a tropical depression on the evening of September 25. The system moved slowly south and southwest into the Bay of Campeche and intensified rapidly on the 27th to Tropical Storm Lorenzo. The system reached hurricane status early that evening and made landfall in central Mexico the next morning as a Category 1 hurricane. The strongest winds in Hurricane Lorenzo were 130 km/hr (70 knots or 80 mph), and its lowest pressure was 990 mb. More information on Hurricane Lorenzo is available from the NOAA National Hurricane Center. | |
 Tropical Storm Melissa Satellite Image |
 Tropical Storm Melissa Track Saffir-Simpson Scale Color Legend |
On September 28, an area of low pressure near the Cape Verde islands developed into a tropical depression. This storm strengthened the next morning and became Tropical Storm Melissa. The storm weakened into a tropical depression and then a remnant low on September 30. The strongest winds in Tropical Storm Melissa were 75 km/hr (40 knots or 46 mph), and its lowest pressure was 1003 mb. More information on Tropical Storm Melissa is available from the NOAA National Hurricane Center. | |
August
 Hurricane Dean Satellite Image |
 Hurricane Dean Track Saffir-Simpson Scale Color Legend |
On August 13, tropical depression four formed in the eastern Atlantic ocean off the coast of Africa. This tropical depression became organized as it moved west and was upgraded to tropical storm Dean. As Dean progressed westward, it continued to intensify and was classified as the first 2007 Atlantic hurricane on August 16. The hurricane passed into the Caribbean near Martinique and Saint Lucia as a Category 2 hurricane on August 17. Dean continued to strengthen and reached Category 5 status by late on August 20, and it made landfall as a Category 5 hurricane on August 21 on the Yucatán Penninsula of Mexico near Costa Maya in a sparsely populated area. After weakening over the peninsula, Dean passed again over open water in the southwestern part of the Gulf of Mexico, enabling it to strengthen back to a Category 2 hurricane before making landfall a second time near Tecolutla on August 22. Peak intensity was 270 km/hr (146 knots or 165 mph) with a minimum pressure of 906 mb. More information on Dean is available from the NOAA National Hurricane Center. | |
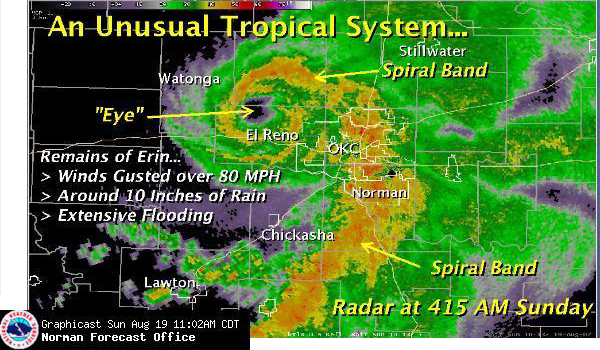
 Tropical Storm Erin Satellite Image |
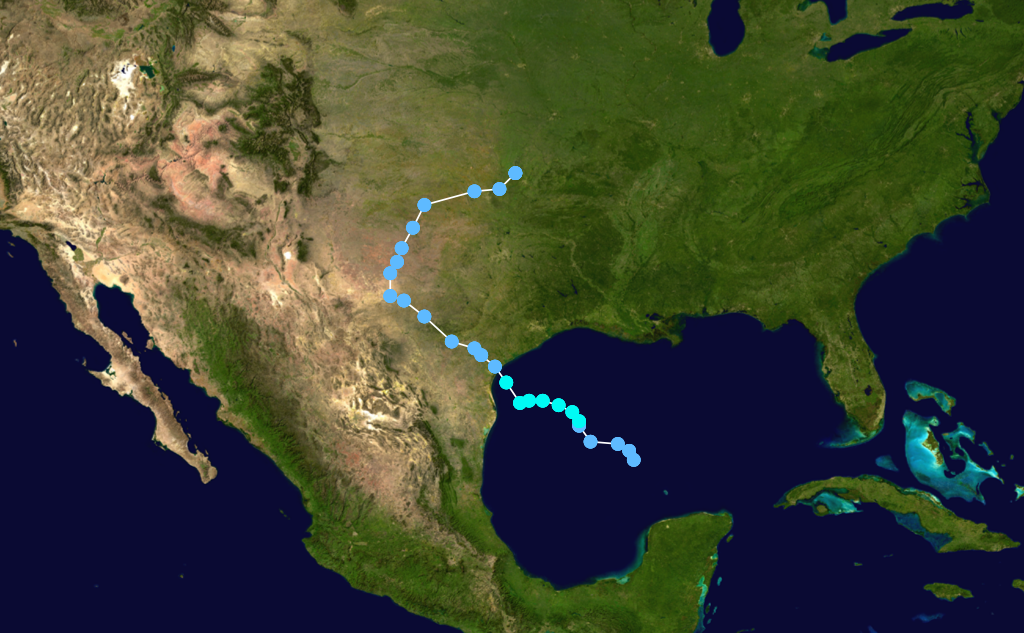 Tropical Storm Erin Track Saffir-Simpson Scale Color Legend |
A tropical depression formed on August 14 about 425 miles (685 km) east-southeast of Brownsville, Texas and about 425 miles (680 km) east of La Pesca, Mexico. It organized enough to be classified the next day as a tropical storm and given the name Erin. Erin weakened and crossed the Texas coast near Lamar on the 16th as a tropical storm and later became extratropical. The remnants of Erin continued northwestward through Texas and turned north and tracked over the south-central U.S., causing extensive flooding in Oklahoma on August 19. Although Erin was no longer a tropical system, radar imagery on the 19th indicated a clear hole resembling an eye in the precipitation field around which the heavy rain rotated. Peak intensity was 65 km/hr (35 knots or 40 mph) with a minimum pressure of 1003 mb. More information on Erin is available from the NOAA National Hurricane Center. | |
July
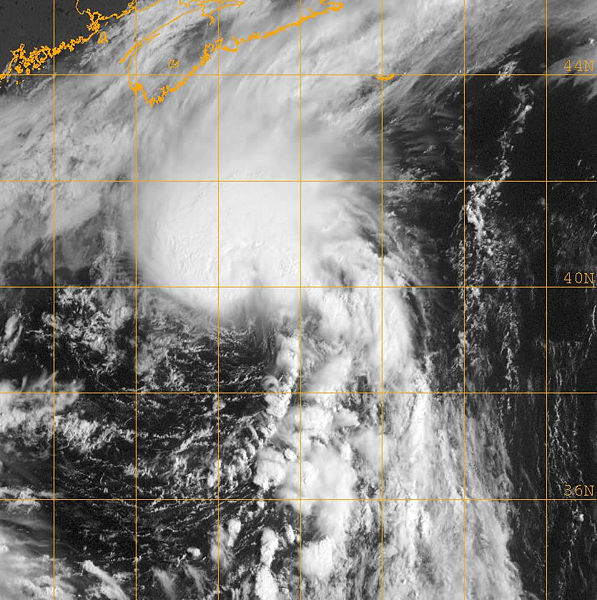 Tropical Storm Chantal Satellite Image |
 Tropical Storm Chantal Track  Saffir-Simpson Scale Color Legend |
On July 28th, an area of low pressure developed near the Bahamas and tracked to the north-northeast. As it organized, it was upgraded to a tropical depression late on the 30th. By the 31st, the system strengthened into a tropical storm south of Nova Scotia. Chantal became extratropical late that same day as it moved over the cool waters of the north Atlantic towards Newfoundland. Peak intensity was 85 km/hr (43 knots or 50 mph) with a minimum pressure of 994 mb. More information on Chantal is available from the NOAA National Hurricane Center. | |
June
 Tropical Storm Barry Satellite Image |
 Tropical Storm Barry Track |
Tropical storm Barry developed in the southeastern Gulf of Mexico on June 1st. Peak intensity was 93 km/hr (50 knots or 58 mph) with a minimum pressure of 997 mb. Beneficial rains fell in parts of Florida and Georgia. Precipitation totals from U.S. Climate Reference Network (USCRN) stations were accumulated over the June 1-5 period. More information on Barry is available from the NOAA National Hurricane Center. | |
May
 Subtropical Storm Andrea Satellite Image |
 Subtropical Storm Andrea Track |
Subtropical storm Andrea developed off the southeastern coast of the United States on the 9th, prior to the official Atlantic hurricane season (June 1st) becoming the first named storm in May since 1981. Andrea had maximum sustained winds of 65 km/hr (35 knots or 40 mph) and immediately weakened to a depression on the 10th (Associated Press/CNN News). Storms that occur prior to the official start of the hurricane season are not uncommon. As recently as 2003 a tropical storm developed earlier in the season when Tropical Storm Ana formed on April 22nd. More information on Andrea is available from the NOAA National Hurricane Center. | |
Useful Links
|
Questions?
|
For all climate questions other than questions concerning this report, please contact the National Climatic Data Center's Climate Services Division: Climate Services Division NOAA/National Climatic Data Center 151 Patton Avenue Asheville, NC 28801-5001 fax: 828-271-4876 phone: 828-271-4800 email: questions@ncdc.noaa.gov For further information on the historical climate perspective presented in this report, contact: David Levinson NOAA/National Climatic Data Center 151 Patton Avenue Asheville, NC 28801-5001 fax: 828-271-4328 email: David.Levinson@noaa.gov |
NCDC / Climate Monitoring / Climate of 2007 / hurricanes / Help


