Overview
Because a tornado is part of a severe convective storm, and these storms occur all over the Earth, tornadoes are not limited to any specific geographic location. In fact, tornadoes have been documented in every one of the United States, and on every continent, with the exception of Antarctica (even there, a tornado occurrence is not impossible). In fact, wherever the atmospheric conditions are exactly right, the occurrence of a tornadic storm is possible. More on the conditions necessary for tornado formation can be found at the NOAA National Severe Storms Laboratory Tornado Page.
However, some parts of the world are much more prone to tornadoes than others. Globally, the middle latitudes, between about 30° and 50° North or South, provide the most
favorable environment for tornadogenesis. This is the region where cold, polar air meets against warmer, subtropical air, often generating convective precipitation along the collision boundaries. In addition, air in the mid-lattitudes often flows at different speeds and directions at different levels of the troposphere, facilitating the development of rotation within a storm cell. Interestingly, the places that receive the most frequent tornadoes are also considered the most fertile agricultural zones of the world. This is due in part to the high number of convective storms delivering needed precipitation to these areas. Simply as a result of the large number of convective storms and the favorable environment, the odds are increased that some of these storms will produce tornadoes.
In terms of absolute tornado counts, the United States leads the list, with an average of over 1,000 tornadoes recorded each year. A distant second is Canada, with around 100
per year. Other locations that experience frequent tornado occurrences include northern Europe, western Asia, Bangladesh, Japan, Australia, New Zealand, China, South Africa and Argentina. In fact, the United Kingdom has more tornadoes, relative to its land area, than any other country. Fortunately, most UK tornadoes are relatively weak. [Encyclopaedia Britannica Article]
Regions of the world with increased likelihood of experiencing tornadoes.

Larger Map
 top of the page top of the page

Tornado Alley
In the United States, there are two regions with a disproportionately high frequency of tornadoes. Florida is one and "Tornado Alley" in the south-central U.S. is the other. Florida has numerous tornadoes simply due to the high frequency of almost daily thunderstorms. In addition, several tropical storms or hurricanes often impact the Florida peninsula each year. When these tropical systems move ashore, the embedded convective storms in the rain bands often produce tornadoes. However, despite the violent nature of a tropical storm or hurricane, the tornadoes they spawn (some as water spouts) tend to be weaker than those produced by non-tropical thunderstorms.
Tornado Alley is a nickname given to an area in the southern plains of the central U.S. that consistently experiences a high frequency of tornadoes each year. Tornadoes in this region typically happen in late Spring and occasionally the early fall. The Gulf Coast area has a separate tornado maximum nicknamed "Dixie Alley" with a relatively high frequency of tornadoes occurring in the late fall (October through December).
Strong to violent tornadoes (those of EF3 or stronger on the Enhanced Fujita Tornado Damage Intensity Scale), are relatively rare, and do not typically occur outside the United States. Although the boundaries of Tornado Alley are debatable (depending on which criteria you use - frequency, intensity, or events per unit area), the region from central Texas, northward to northern Iowa, and from central Kansas and Nebraska east to western Ohio is often collectively known as Tornado Alley. Meteorologically, the region known as Tornado Alley is ideally situated for the formation of supercell thunderstorms,often the producers of violent (EF2 or greater) tornadoes.
Overall, most tornadoes (around 77%) in the U.S. are considered weak (EF0 or EF1) and about 95% of all U.S. tornadoes are below EF3 intensity. The remaining small percentage of tornadoes are categorized as violent (EF3 and above). Of these violent twisters, only a few (0.1% of all tornadoes) acheive EF5 status, with estimated winds over 200 mph and nearly complete destruction. However, given that on average over 1000 tornadoes hit the U.S. each year, that means that 20 can be expected to be violent and possibly one might be incredible (EF5).
top of the page
Timing
Because most tornadoes are related to the strength of a thunderstorm, and thunderstorms normally gain most of their energy from solar heating and latent heat released by the condensation of water vapor, it is not surprising that most tornadoes occur in the afternoon and evening hours, with a minimum frequency around dawn (when temperatures are lowest and radiation deficits are highest). However, tornadoes have occurred at all hours of the day, and nighttime occurrences may give sleeping residents of a community little or no warning.
Tornado Occurrence by hour of day for the St. Louis Weather Forecast Office County Warning Area
In addition, tornadoes occur throughout the year. Because a tornado may occur at any time of the day or year somewhere in the U.S., there really is no national tornado "season" (as there is with Atlantic hurricanes). Instead, each region may experience increased tornadic potential at different times of the year. Like with the diurnal pattern, for the
United States (and hemisphere) as a whole, the months in which tornadoes are most likely correspond to the times of year with increased solar heating and strong frontal systems. Regionally, the frequency of tornadoes in the United States is closely tied
with the progression of the warm season when warm and cold air masses often clash. Most of the early spring tornadoes in the U.S. tend to occur in the Southeast and South Central regions. Gulf States, such as Mississippi and Louisiana are the frequent recipients of tornadoes from February to April. Late spring tornadoes generally spread a bit farther north, often into Kansas, Nebraska and the Tennessee Valley region. By mid-summer, most of Tornado Alley is active and tornadoes may occur throughout the U.S. Late summer tends to bring some of the stronger tornadoes into the upper Midwest and Ohio valleys, and the pattern shifts back southward into the late autumn. The fewest tornadoes are documented during the winter months. Although rare, deadly winter outbreaks do occur.
Average tornado frequency by month of year 2003-2005
 top of the page
Historical Records and Trends
Oldest Known Photograph of a Tornado (1884)
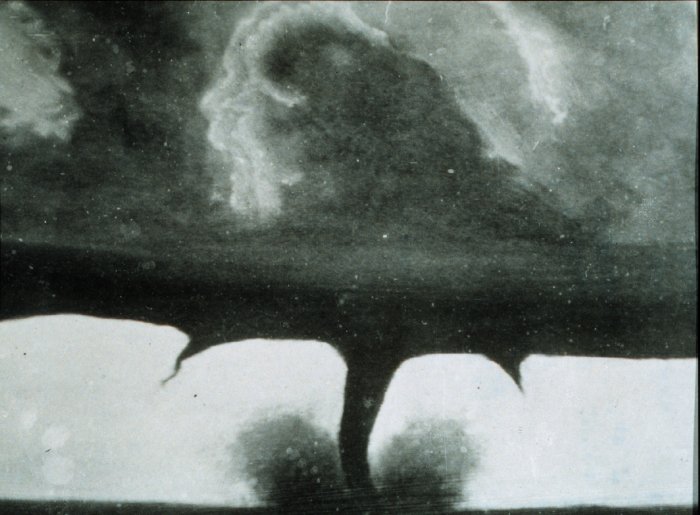
Click to visit NOAA Photo Library Page
One of the main difficulties with tornado records is that a tornado, or evidence of a tornado must have been observed. Unlike rainfall or temperature, which may be measured by a fixed instrument, tornadoes are ephemeral and very unpredictable. If a tornado occurs in a place with few or no people, it is not likely to be documented. Unfortunately, much of what we know as tornado alley was very sparsely populated until the 20th century, and so it is possible that many significant tornadoes may never have made it into the historical record.
Much early work on tornado climatology in the U.S. was done by John Park Finley in his book Tornadoes, published in 1887. While some of Finley's safety guidelines have
since been refuted as dangerous practices, the book itself remains a seminal work in tornado research. The University of Oklahoma has created a pdf copy of the entire book and made it accessible at: John Finley's 'Tornadoes'
Today, nearly all of the United States is reasonably well populated, or at least covered by NOAA's Doppler weather radars. Even if a tornado is not actually observed, modern damage assessments by NWS personnel can discern if a tornado caused the damage, and if so, how strong the tornado may have been. This disparity between tornado records of the past and current records contributes a great deal of uncertainty regarding questions about the long-term behavior or patterns of tornado occurrence. In addition, even today many smaller tornadoes still may go undocumented in places with low populations or inconsistent communication facilities.
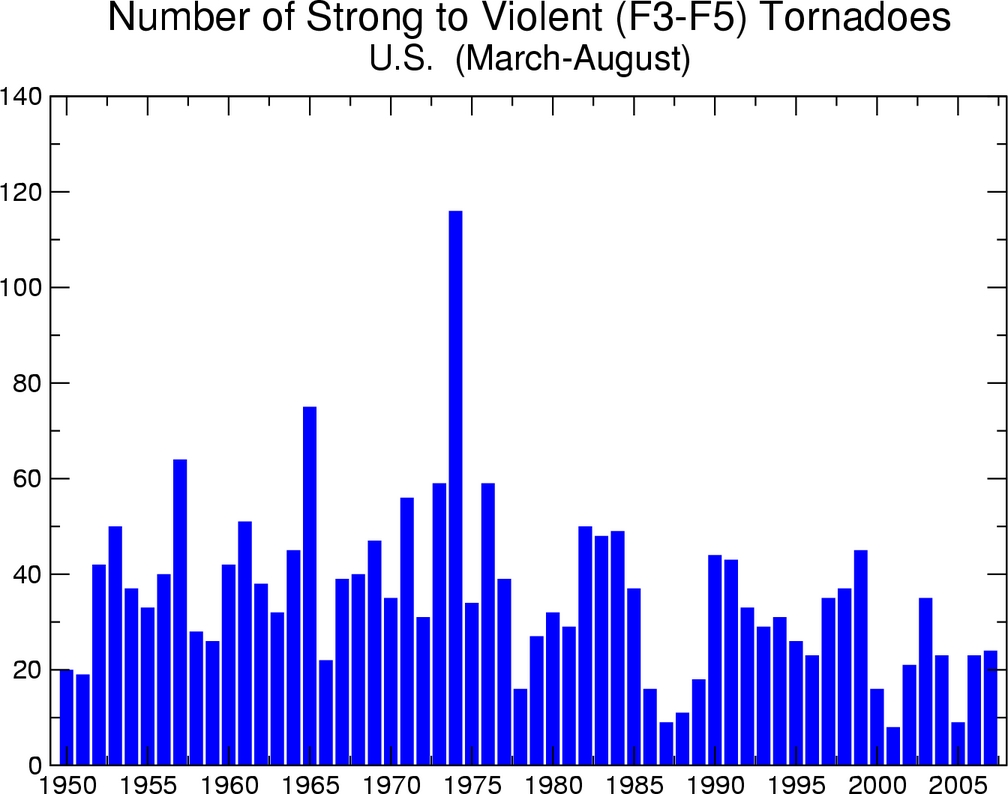
With increased national doppler radar coverage, increasing population, and greater attention to tornado reporting, there has been an increase in the number of tornado reports over the past several decades. This can create a misleading appearance of an increasing trend in tornado frequency. To better understand the true variability and trend in tornado frequency in the US, the total number of strong to violent tornadoes (EF3 to EF5 category on the Enhanced Fujita scale) can be analyzed. These are the tornadoes that would have likely been reported even during the decades before Dopplar radar use became widespread and practices resulted in increasing tornado reports. The bar chart below indicates there has been little trend in the frequency of the strongest tornadoes over the past 55 years.

Click to enlarge image
top of the page
State Occurrence Maps
The maps below give tornado statistics by state.
| Long Term Averages By State 1953-2004 |
Small-for quick view |
Large-for printing |
| Overall Average |
small |
large |
| Overall Average per 10,000 Square Miles |
small |
large |
| Strong-Violent Average |
small |
large |
| Strong-Violent Average per 10,000 Square Miles |
small |
large |
| US Annual Very Strong (F3-F5) Tornado Count, 1950-2003 |
small |
large |
top of the page
Deadliest Tornadoes
Most tornadoes do not result in death, and of those that do, most claim only a few lives. Also, as a result of improved forecasting and early warning systems, the death toll from tornadoes has dropped significantly over the years, despite increasing populations in tornado-prone areas. Unfortunately, super-violent tornadoes are still documented, some with exceptional death tolls. Interestingly, a number of these devastating tornadoes have occurred outside of Tornado Alley, and several at times of day or year not normally associated with violent tornadoes. Although all of most deadly tornadoes occurred prior to the invention of the Fujita Scale, historical records of their damage have led them to be classified as either F4 or F5.
| The ten deadliest documented tornado events |
|---|
| Rank | Date | Estimated intensity* | State | Injuries (Deaths) | Remarks |
|---|
| 1 | March 18, 1925 | F5 | MO, IL, IN | 2027 (695) | Tri-State Tornado
Wikipedia Entry
Tornado Project Page
The Weather Channel
|
| 2 | May 6, 1840 | Unkn. | LA, MS | 109 (317) | hit Nachez, MS
NWS information
Nachez Free Trader article
Wikipedia Information
Tornado Project Page
|
| 3 | May 27, 1896 | F4 | MO, IL | 1000 (255) | The Great St. Louis Tornado
NOAA Library article
St. Clair County, IL reports
Tornado Project Page
The Great Cyclone. SIU Press
St. Louis American Local History Network
|
| 4 | April 5, 1936 | F5 | MS | 700 (216) | hit Tupelo, MS
NWS information
Tornado Project Page
|
| 5 | April 6, 1936 | F4 | GA | 1600 (203) | hit Gainesville, GA
Tornado Project Page
About N. Georgia
|
| 6 | April 9, 1947 | F5 | TX, KS, OK | 970 (181) |
Norman, OK NWS WFO
Tornado Project Page
|
| 7 | April 24, 1908 | F4 | LA, MS | 770 (143) | hit Amite, LA and Purvis, MS
Tornado Project Page
|
| 8 | June 12, 1899 | F5 | WI | 200 (117) | hit New Richmond, WI
Summary by Don Lloyd
Tornado Project Page
|
| 9 | June 8, 1953 | F5 | MI | 844 (115) | hit Flint, MI
Tornado Project Page
|
| 10 | May 11, 1953 | F5 | TX | 597 (114) | hit Waco, TX
Wikipedia Entry
Tornado Project Page
|
| 10 | May 18, 1902 | Unk. | TX | 230 (114) | hit Goliad, TX
Wikipedia Entry
|
| * All events occurred prior to the implementation of the Fujita Scale, and intensities are estimated based on historical documentation. |
top of the page
Special Reports
Links to other information
|


 NCDC |
Climate Monitoring | Tornado Climatology |
Tornado Safety |
Search |
Help
NCDC |
Climate Monitoring | Tornado Climatology |
Tornado Safety |
Search |
Help


