


NOTE: In order to view/print the PDF links below, you must download the Adobe Acrobat PDF Reader 
 Overview
While the Fujita and Saffir-Simpson Scales characterize tornadoes and hurricanes respectively, there is no widely used scale to classify snowstorms. The Northeast Snowfall Impact Scale (NESIS) developed by Paul Kocin of The Weather Channel and Louis Uccellini of the National Weather Service (Kocin and Uccellini, 2004) characterizes and ranks high-impact Northeast snowstorms. These storms have large areas of 10 inch snowfall accumulations and greater. NESIS has five categories: Extreme, Crippling, Major, Significant, and Notable. The index differs from other meteorological indices in that it uses population information in addition to meteorological measurements. Thus NESIS gives an indication of a storm's societal impacts. This scale was developed because of the impact Northeast snowstorms can have on the rest of the country in terms of transportation and economic impact.
NESIS scores are a function of the area affected by the snowstorm, the amount of snow, and the number of people living in the path of the storm. The diagram below illustrates how NESIS values are calculated within a geographical information system (GIS). The aerial distribution of snowfall and population information are combined in an equation that calculates a NESIS score which varies from around one for smaller storms to over ten for extreme storms. The raw score is then converted into one of the five NESIS categories. The largest NESIS values result from storms producing heavy snowfall over large areas that include major metropolitan centers. For details on how NESIS scores are calculated at the National Climatic Data Center, see Squires and Lawrimore (2006).
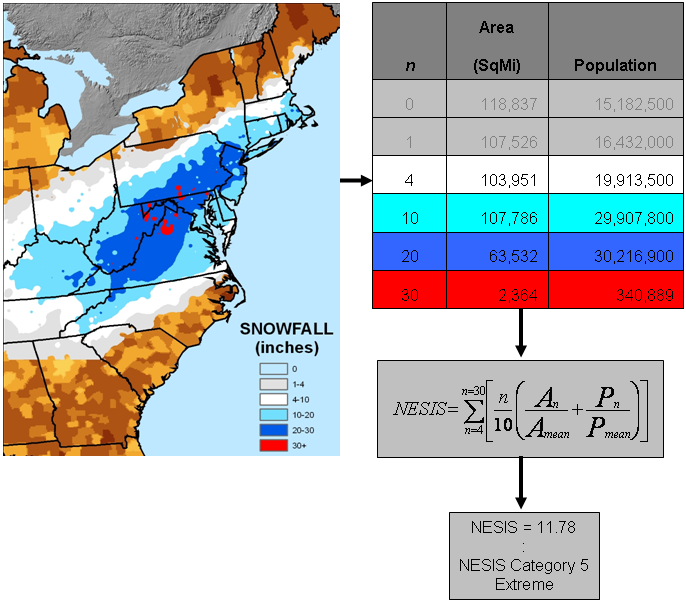
Table 1: NESIS categories, their corresponding NESIS values, and a descriptive adjective:
| Category | NESIS Value | Description |
|---|---|---|
| 1 | 1—2.499 | Notable |
| 2 | 2.5—3.99 | Significant |
| 3 | 4—5.99 | Major |
| 4 | 6—9.99 | Crippling |
| 5 | 10.0+ | Extreme |
Table 2: Ranks 35 high-impact snowstorms that affected the Northeast urban corridor.
(click on hyperlinked dates for map of storm)
| Rank | Date | NESIS | Category | Description |
|---|---|---|---|---|
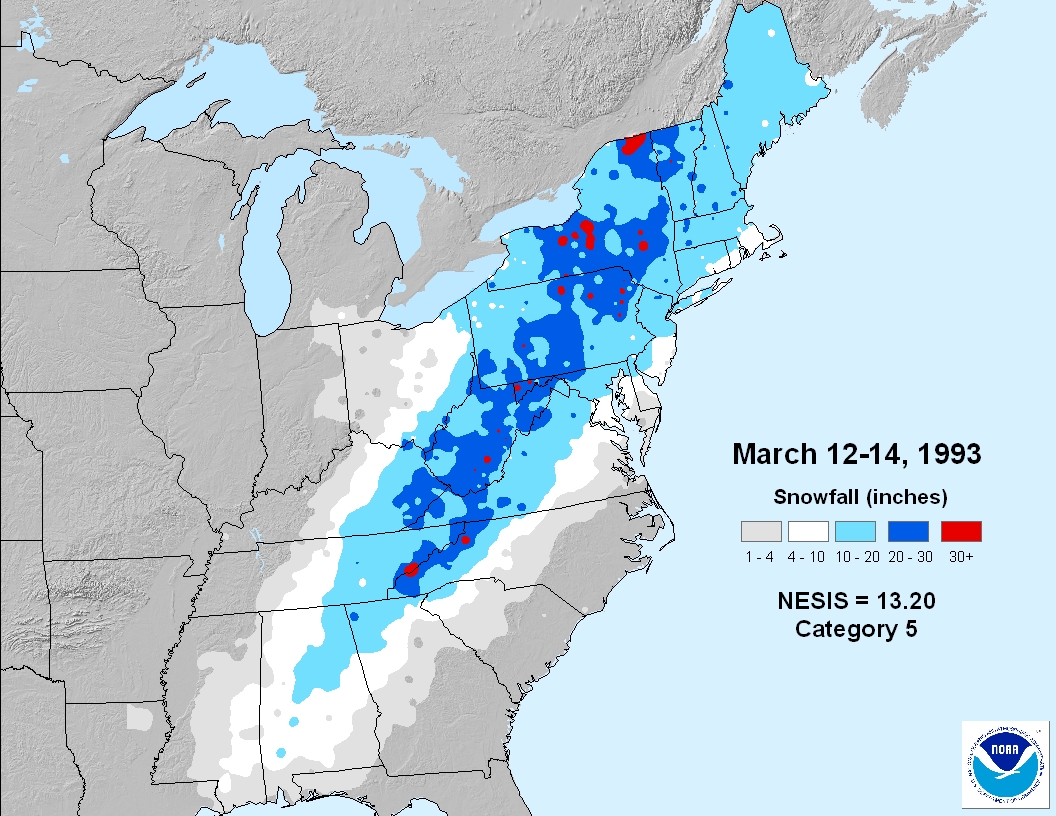
| 1 | Mar 12-14, 1993 | 13.20 | 5 | Extreme |
| 2 | Jan 6-8, 1996 | 11.78 | 5 | Extreme |
| 3 | Feb 15-18, 2003 | 8.91 | 4 | Crippling |
| 4 | Mar 2-5, 1960 | 8.77 | 4 | Crippling |
| 5 | Feb 2-5, 1961 | 7.06 | 4 | Crippling |
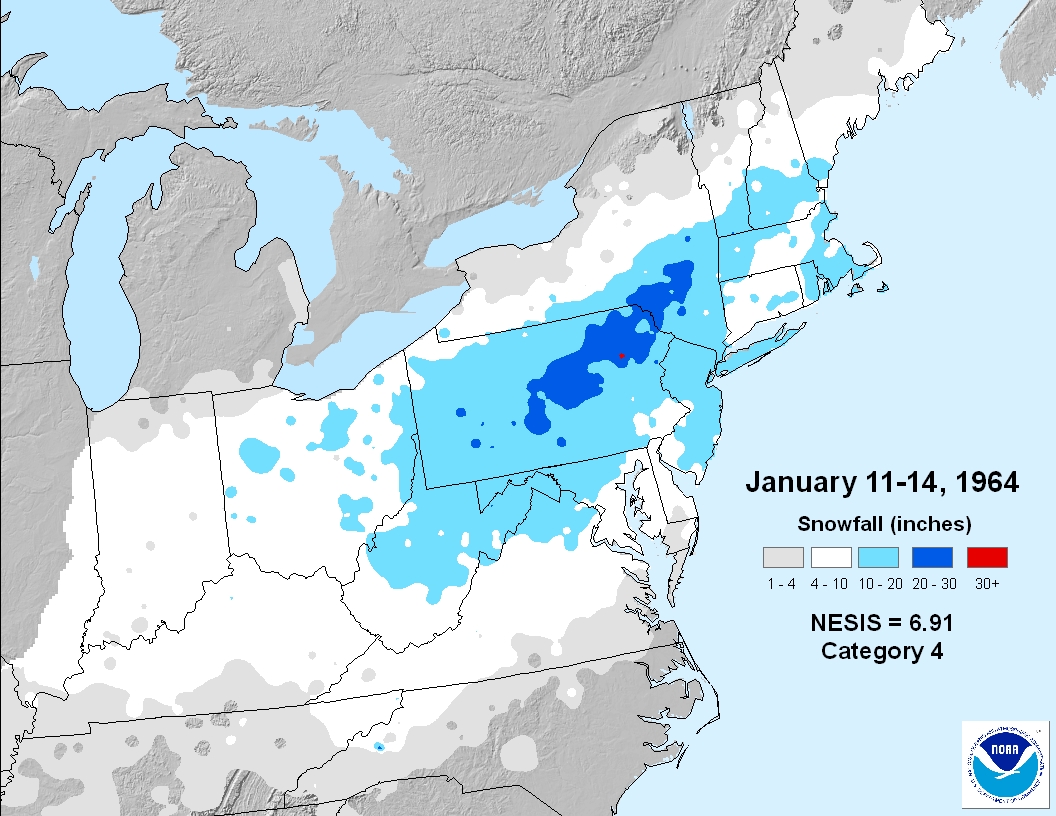
| 6 | Jan 11-14, 1964 | 6.91 | 4 | Crippling |
| 7 | Jan 21-24, 2005 | 6.80 | 4 | Crippling |
| 8 | Jan 19-21, 1978 | 6.53 | 4 | Crippling |
| 9 | Dec 25-28, 1969 | 6.29 | 4 | Crippling |
| 10 | Feb 10-12, 1983 | 6.25 | 4 | Crippling |
| 11 | Feb 14-17, 1958 | 6.25 | 4 | Crippling |
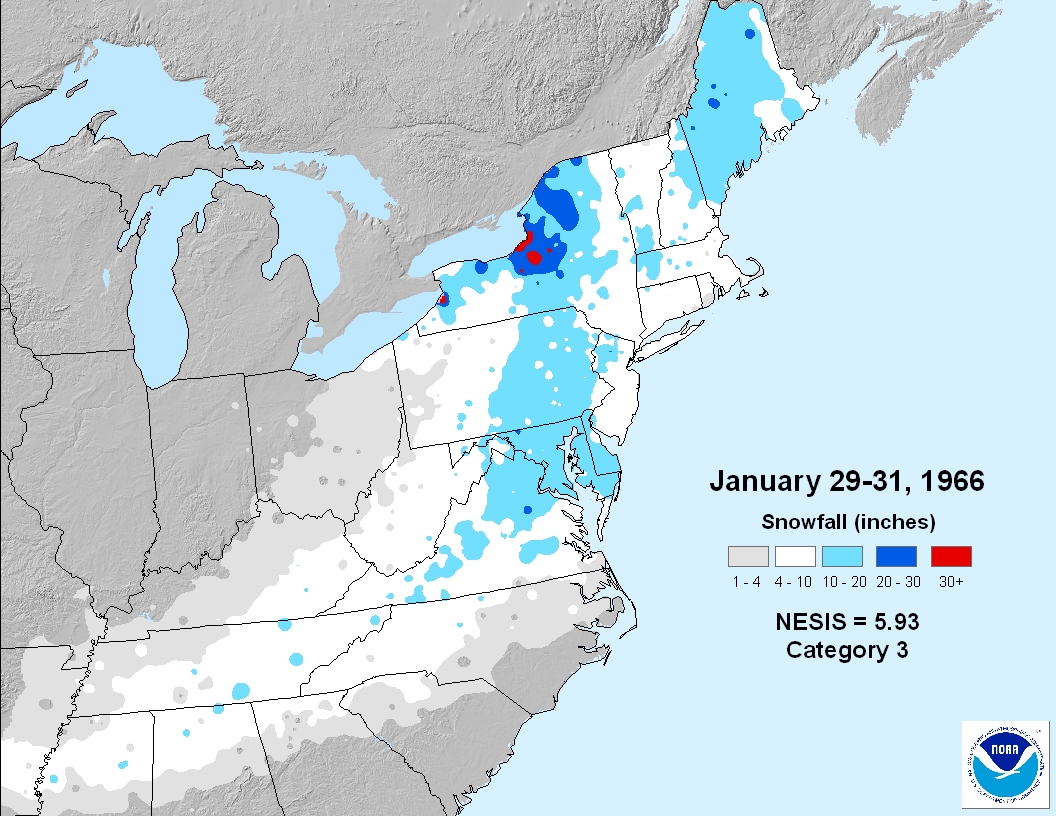
| 12 | Jan 29-31, 1966 | 5.93 | 3 | Major |
| 13 | Feb 5-7, 1978 | 5.78 | 3 | Major |
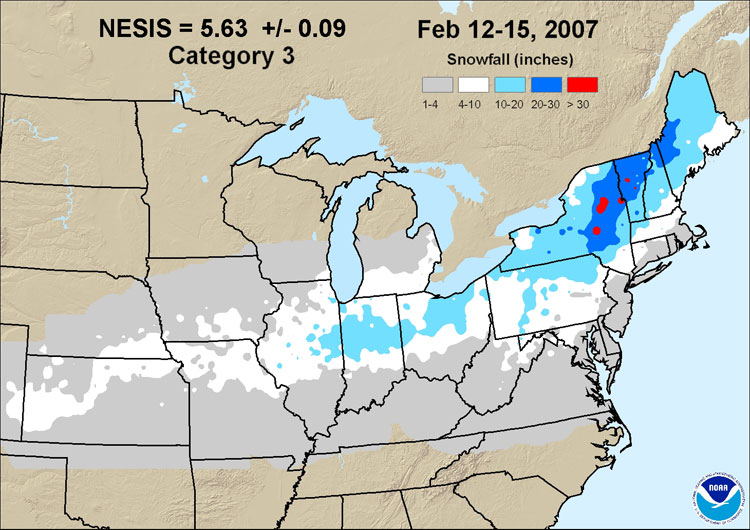
| 14 | Feb 12-15, 2007 | 5.63 | 3 | Major |
| 15 | Jan 21-23, 1987 | 5.40 | 3 | Major |
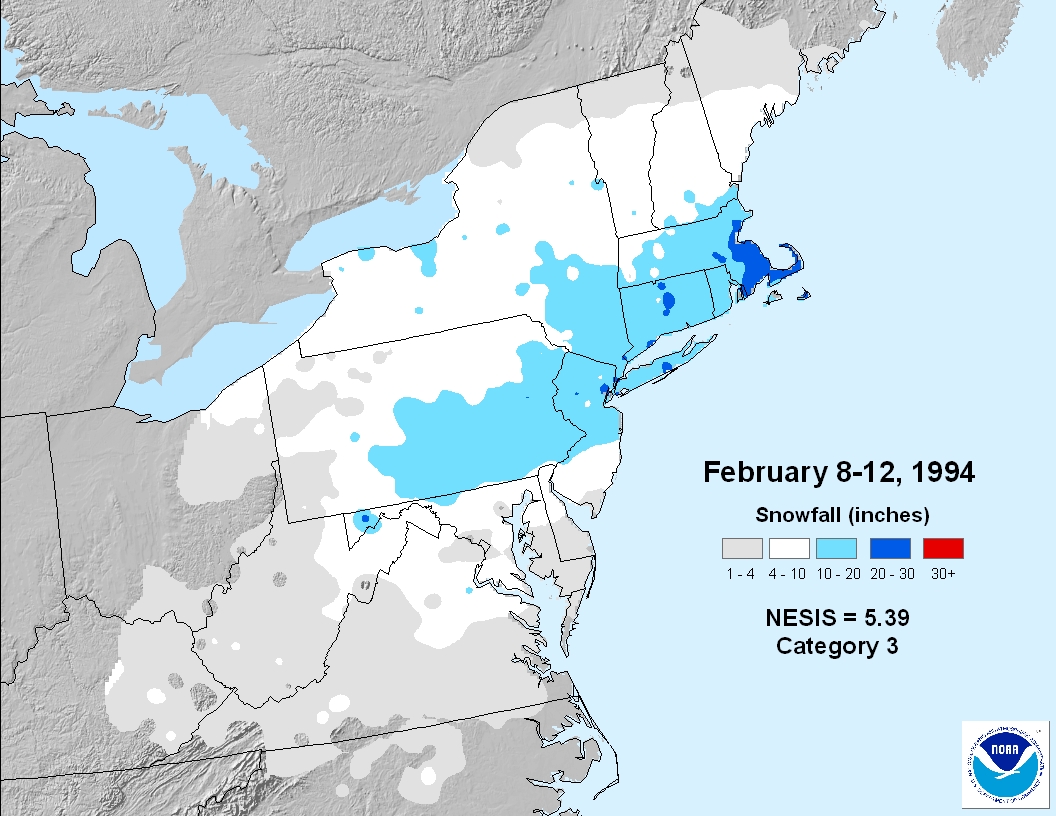
| 16 | Feb 8-12, 1994 | 5.39 | 3 | Major |
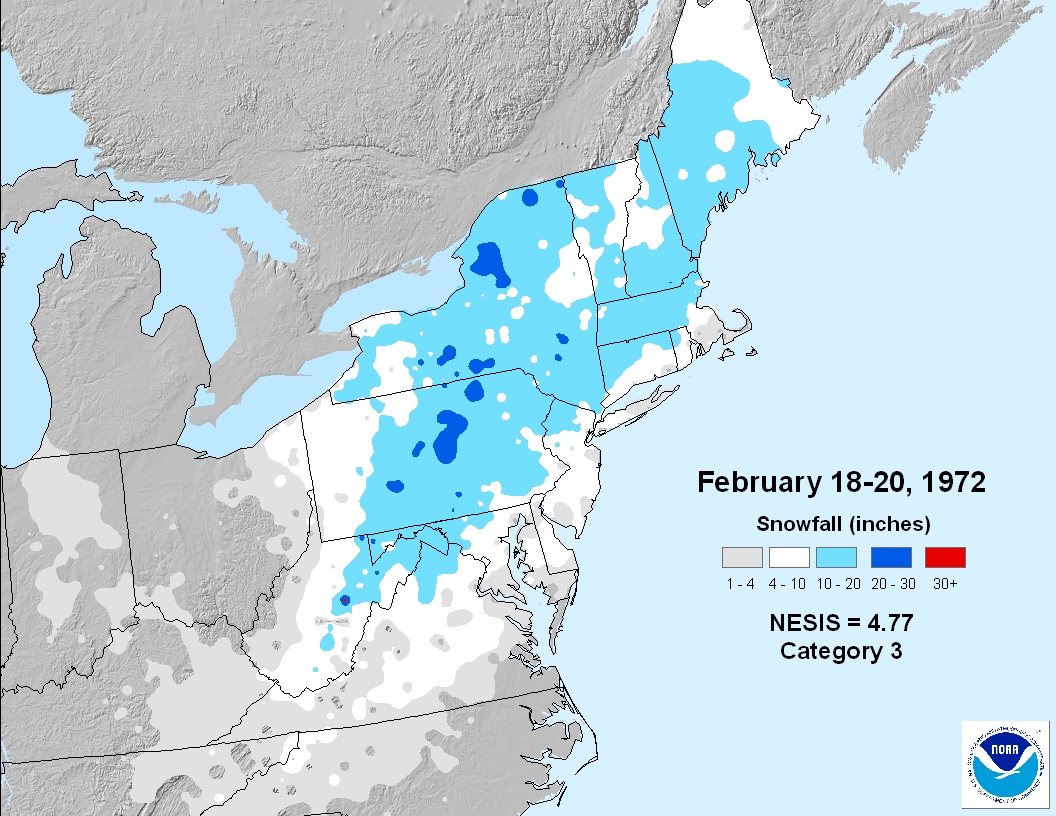
| 17 | Feb 18-20, 1972 | 4.77 | 3 | Major |
| 18 | Feb 17-19, 1979 | 4.77 | 3 | Major |
| 19 | Dec 11-13, 1960 | 4.53 | 3 | Major |
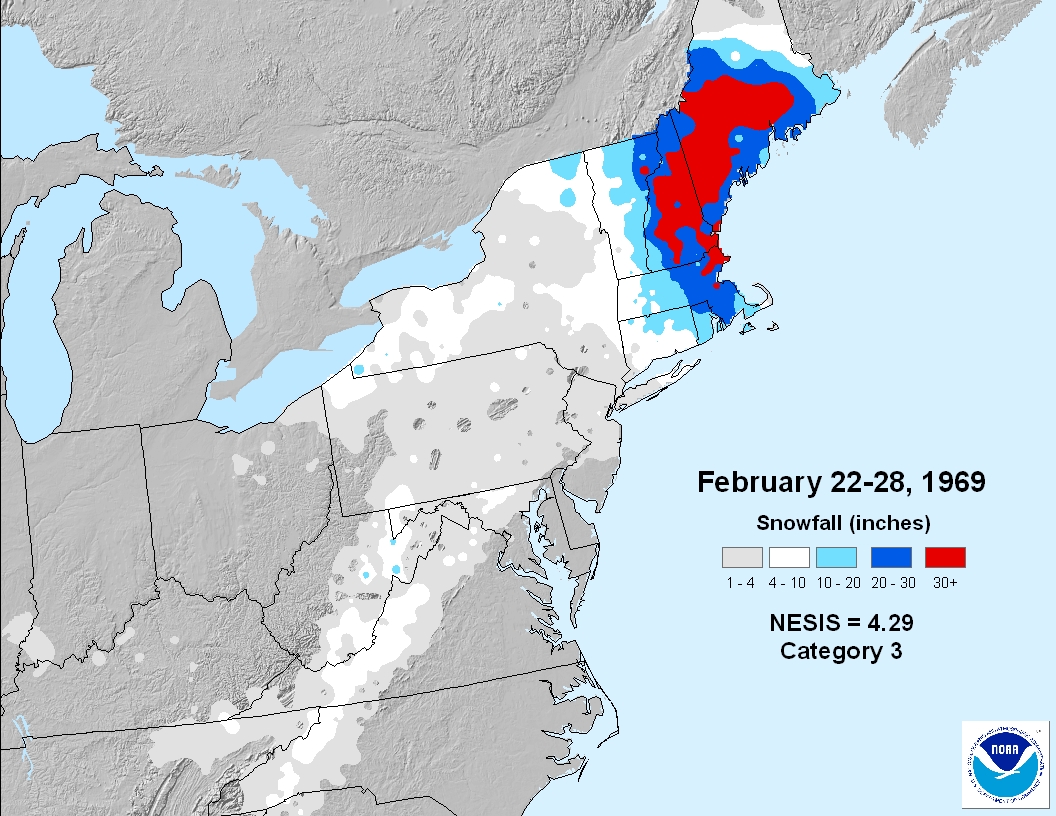
| 20 | Feb 22-28, 1969 | 4.29 | 3 | Major |
| 21 | Feb 12-13, 2006 | 4.10 | 3 | Major |
| 22 | Jan 18-21, 1961 | 4.04 | 3 | Major |
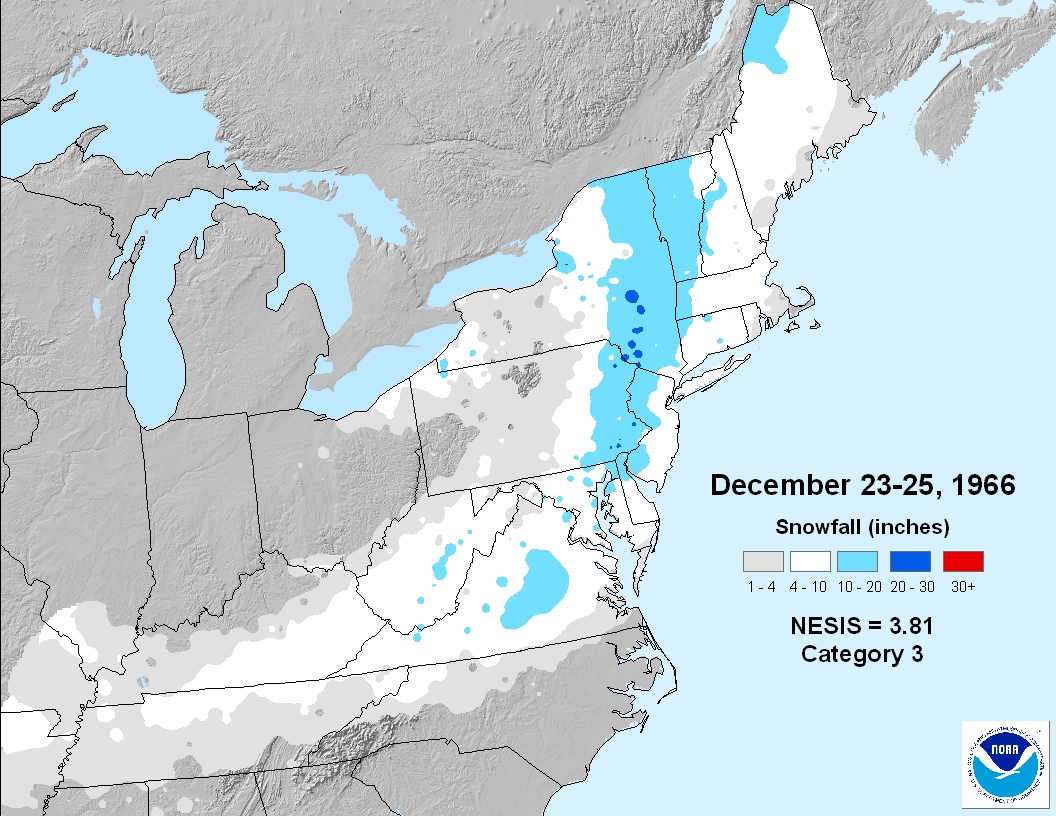
| 23 | Dec 23-25, 1966 | 3.81 | 2 | Significant |
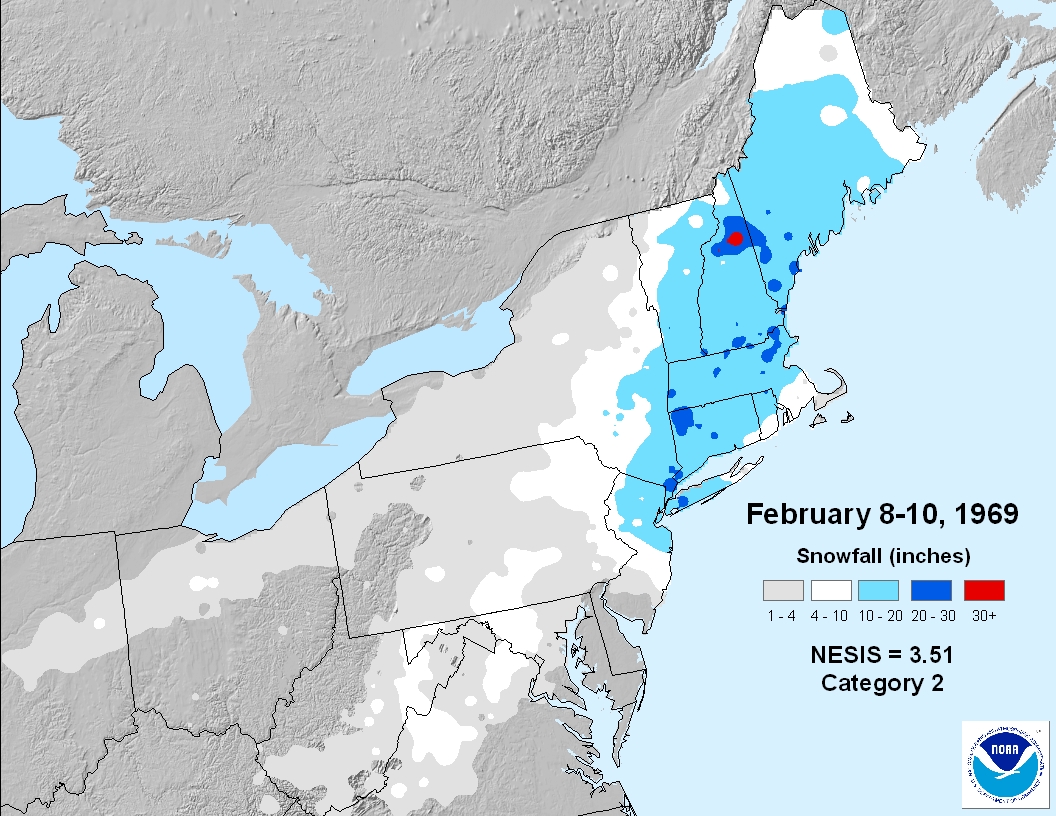
| 24 | Feb 8-10, 1969 | 3.51 | 2 | Significant |
| 25 | Mar 18-21, 1958 | 3.51 | 2 | Significant |
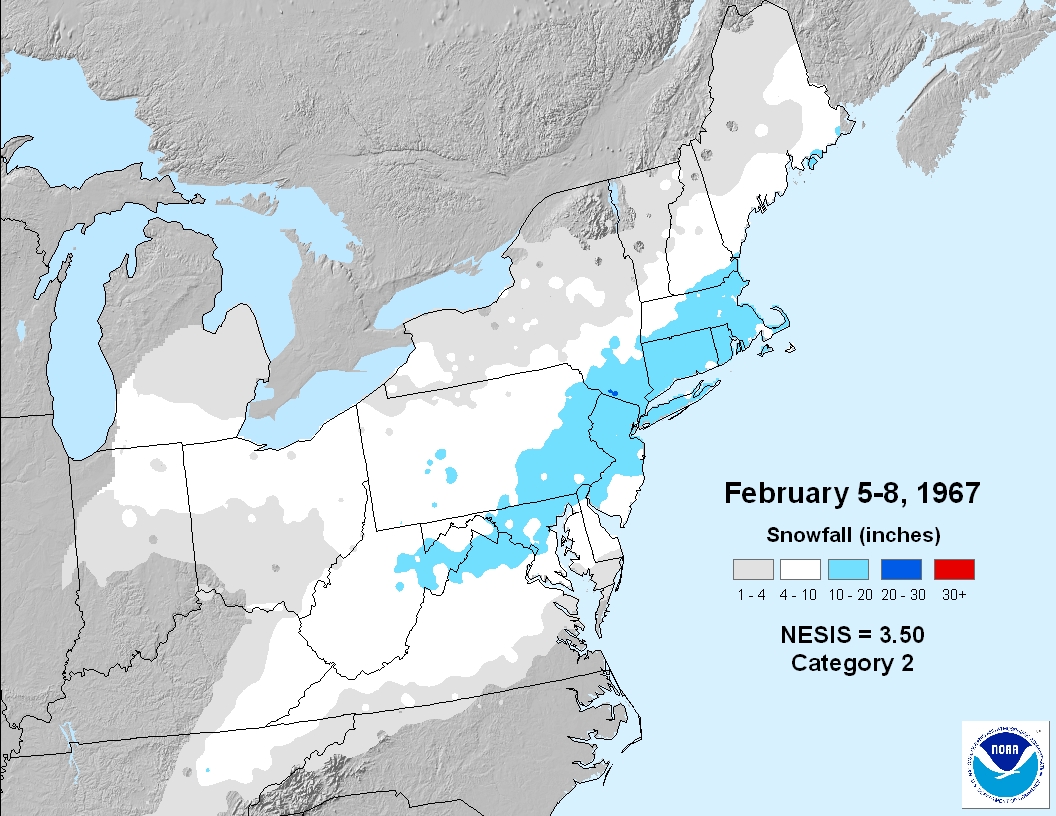
| 26 | Feb 5-8, 1967 | 3.50 | 2 | Significant |
| 27 | Apr 6-7, 1982 | 3.35 | 2 | Significant |
| 28 | Mar 15-18, 2007 | 2.55 | 2 | Significant |
| 29 | Jan 24-26, 2000 | 2.52 | 2 | Significant |
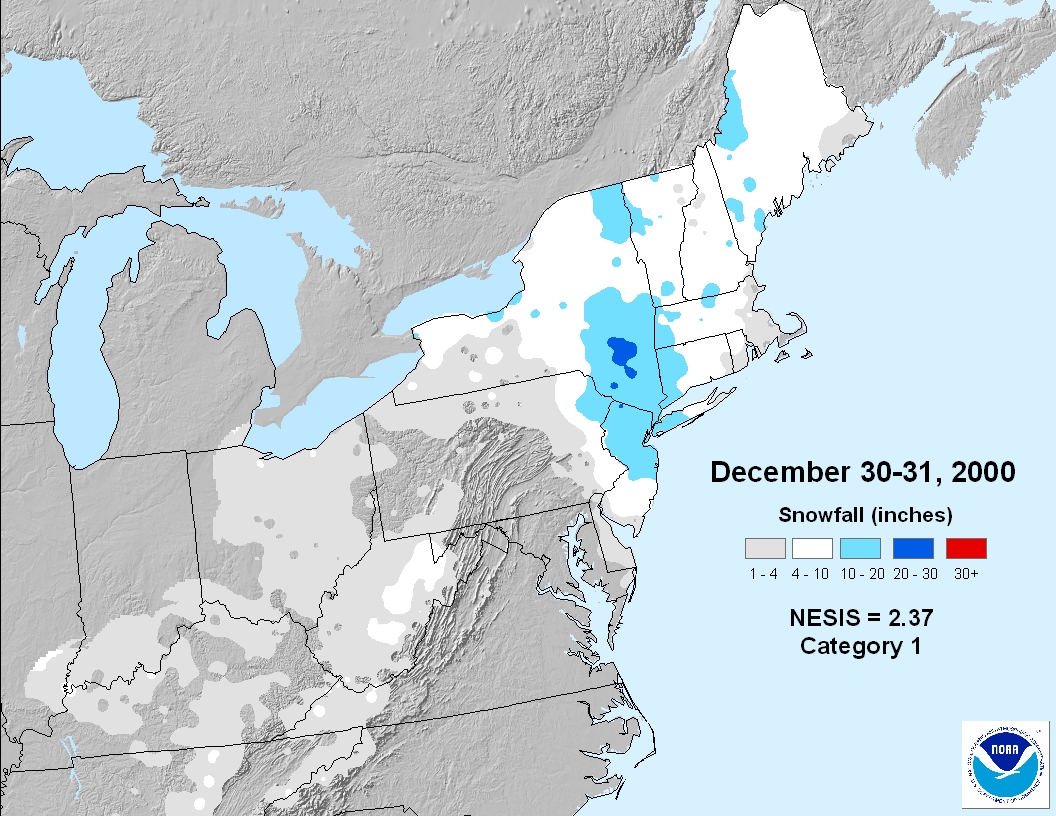
| 30 | Dec 30-31, 2000 | 2.37 | 1 | Notable |
| 31 | Mar 31 - Apr 1, 1997 | 2.29 | 1 | Notable |
| 32 | Mar 18-19, 1956 | 1.87 | 1 | Notable |
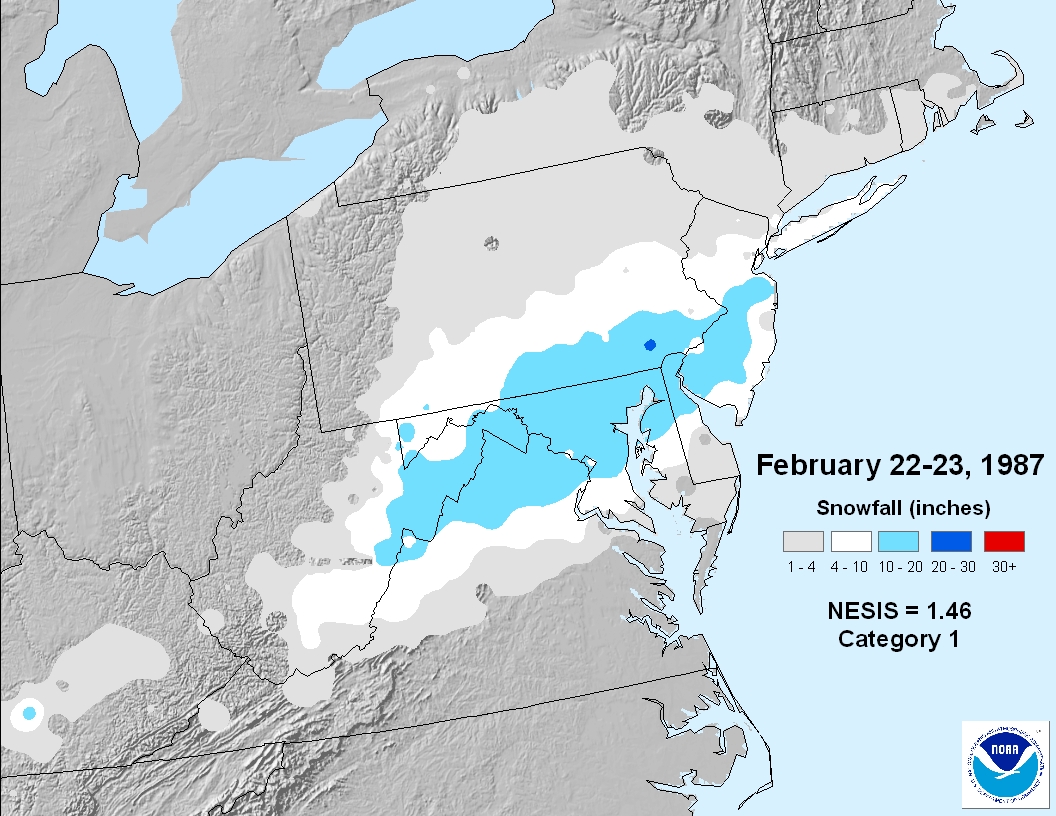
| 33 | Feb 22-23, 1987 | 1.46 | 1 | Notable |
| 34 | Feb 2-4, 1995 | 1.43 | 1 | Notable |
| 35 | Jan 25-26, 1987 | 1.19 | 1 | Notable |
References:Kocin, P. J. and L. W. Uccellini, 2004: A Snowfall Impact Scale Derived From Northeast Storm Snowfall Distributions. Bull. Amer. Meteor. Soc., 85, 177-194
Squires, M. F. and J. H. Lawrimore, 2006: Development of an Operational Snowfall Impact Scale. 22nd IIPS, Atlanta, GA.


