|
 Global Analysis / Global Hazards / United States / U.S.
Drought / Extremes
Global Analysis / Global Hazards / United States / U.S.
Drought / Extremes

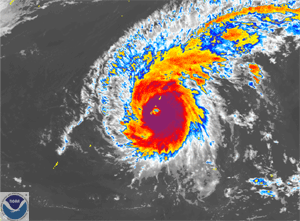
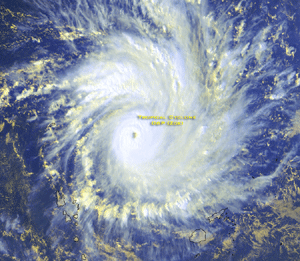
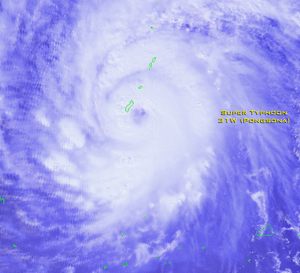 Super Typhoon Pongsona
|
Global Hazards and Significant Events
December 2002Super Typhoon Pongsona crossed Guam on December 8, 2002 and was one of the worst typhoons on record to strike the island. Additional information can be found below.
|

Drought & Heat | Flooding | Storms | Tropical Cyclones | Extratropical Cyclones | Severe Winter Weather

| Severe to exceptional drought continued throughout much of the western United States, specifically the Intermountain West. A continuation of above average precipitation in the eastern U.S. brought significant drought recovery, as a turn toward wetter weather which began in September continued in December. |

larger image
|
larger image
|
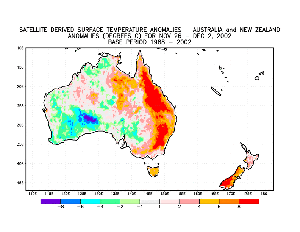
Unseasonably warm temperatures exacerbated severe drought conditions across Australia. Maximum temperatures in Melbourne reached 35.6°C (96°F) on the 2nd, which is over 11°C (20°F) above normal for the month of December. Temperatures throughout much of Australia were 1-2°C (1.8-3.6°F) above average for the month of December. |
Wildfires which continued in New South Wales in early December were characterized as the worst in nearly 30 years (BBC News). Around 70 brush fires burned north, south and west of the city of Sydney, with about 20 houses destroyed by the flames. Nearly 3,000 firefighters had responded to the blazes.
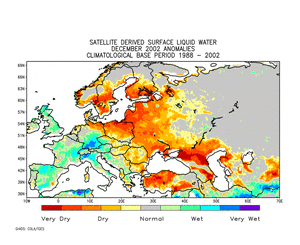
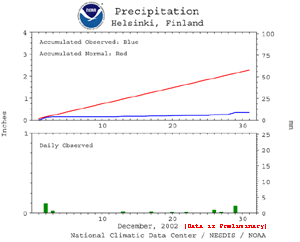
| An unusual drought that began during the summer of 2002 has left Scandinavians with soaring electricity prices and possible power outages. In Finland, reservoir levels which dropped to 10-year record lows resulted in a 10 percent increase in energy costs (Reuters). |
larger image
|
larger image
|
Precipitation in Helsinki, Finland totaled 9 mm (0.35 inches) for the month of December, which is 49 mm (1.93 inches) below normal.
|
Across Africa, drought in Mauritania is described as the worst in 20 years (World Vision). Malnutrition rates for children under 5 years of age rose to between 10 and 15 percent in parts of the country.
While locally heavy showers fell across parts of Ethiopia during December, ongoing drought in the country was responsible for producing food shortages for nearly 11 million people, as the drought cut cereal production by an estimated 20 to 30 percent in 2002 (WFP/FAO).
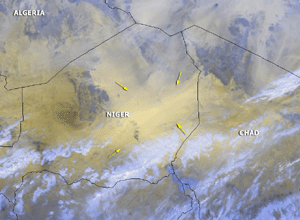
| A large dust storm affected parts of Chad and Niger around December 3, significantly reducing visibility. |
larger image
|


 Thunderstorms Produce Flooding and Mudslides in Brazil
|
Thunderstorms associated with a cold front brought excessive rains to parts of Brazil on the 9th, where mudslides impacted the city of Angra dos Reis, located about 160 km (100 miles) west of Rio De Janeiro. Mudslides buried houses and killed 39 people (Associated Press). Rainfall totals exceeded 125 mm (5 inches) in less than 24 hours, as reported by the National Weather Institute of Brazil.
|
Additional heavy rains on the 22nd prompted flooding in the mountain city of Teresopolis, located about 90 km (55 miles) north of Rio de Janeiro. A mudslide was responsible for 9 deaths and 50 injuries (Associated Press).
Heavy rainfall affected Panama and Costa Rica during late November and early December 2002, producing severe flooding in more than 110 communities in the two countries. Approximately 50,000 people were affected in Costa Rica and 15,000 in Panama, along with at least 6 deaths (IFRC).
In Indonesia, a mudslide triggered by heavy rains swept through Pacet village of East Java on the 11th, causing at least 32 fatalities (CIP report).
For an archive of flood events worldwide, see the Dartmouth Flood Observatory.

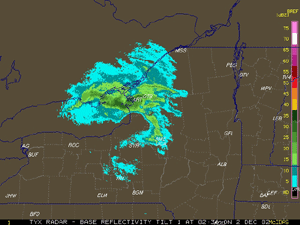
Additional severe weather occurred on the 18th, as more tornadoes occurred farther south in Arkansas, with two fatalities reported (Reuters). Thunderstorms spread east on the 19th, bringing severe weather to parts of Mississippi, where extensive tornado damage and over 50 injuries were reported in the town of Newton (Associated Press).

| Typhoon Pongsona developed in the western Pacific Ocean on the 2nd and became a typhoon on the 5th.
Pongsona reached super-typhoon status with maximum sustained winds of 240 km/hr (130 knots or 150 mph) by the 8th as it approached Guam.
|
larger image
|
| As the typhoon passed over the island, the airport observing station reported a wind gust to 240 km/hr (130 knots or 150 mph) before being rendered inoperative. Tiyan, Guam recorded 500 mm (19.67 inches) of rain which set a new record for daily rainfall during the month of December. The old daily rainfall record was 351 mm (13.81 inches) produced by Typhoon Paka in 1997. The storm destroyed thousands of homes and cut off all electricity, water and power on the island. President Bush declared the U.S. territory a federal disaster area on the 8th. Pongsona was one of the strongest recorded typhoons to impact the island of Guam.
|
Click For Radar Animation
|
 larger image
|
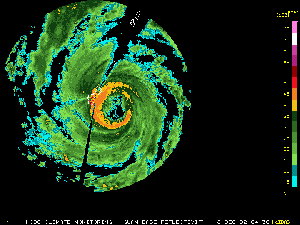
Tropical Cyclone Zoe developed in the South Pacific Ocean south of Tuvalu on the 25th, and impacted the southeastern Solomon Islands during the 28th-30th. The storm struck the Temotu Province, with widespread damage reported on the islands of Tikopia, Anuta and Fataka as maximum sustained winds were near 290 km/hr (155 knots or 180 mph) (OCHA). |
A preliminary summary of 2002 tropical storms and hurricanes in the Atlantic Basin is available.

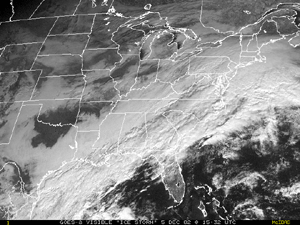
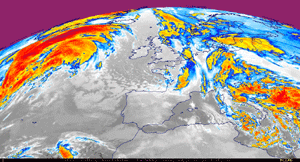 Infrared Satellite Image of Europe
|
A series of storm systems affected much of Europe during November and early December. Strong wind gusts reaching 130 km/hr (70 knots or 80 mph) affected Ireland on the 2nd, prompting numerous power outages. Meanwhile, above average precipitation continued over interior Europe, where severe flooding occurred in November across the Swiss Alps and northern Italy. |
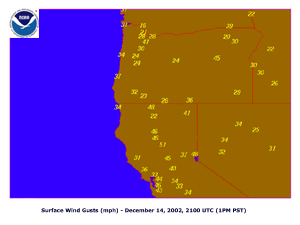
| A powerful Pacific storm system plowed into the western United States during the 13th-16th, producing high winds, heavy rains, significant mountain snowfall and causing 9 deaths (Associated Press). Rainfall amounts exceeding 254 mm (10 inches) occurred in parts of California, and wind gusts over 70 km/hr (~40 knots or 45 mph) produced up to 1.9 million power outages during the period (Pacific Gas & Electric).
|
larger image
|
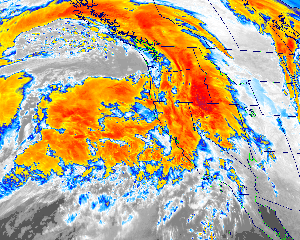 Powerful Storm System Affects U.S. West Coast
|
Winds gusted to near 160 km/hr (~85 knots or 100 mph) at the summit of Mount Diablo east of San Francisco Bay. Some higher elevation locations in the Sierra Nevada mountains received up to 254 cm (100 inches) of snow during the 12th-16th.
|
A storm system which tracked across the eastern Mediterranean region on the 20th brought strong winds and heavy rainfall to much of Lebanon, Israel and Egypt. Flooding was reported in northern Lebanon, and winds at the Beirut airport gusted to 95 km/hr (51 knots or 60 mph) during the afternoon of the 20th.

In parts of the Northeast U.S., strong winds gusting well over 65 km/hr (35 knots or 40 mph) produced significant blowing and drifting of snow, which severely reduced visibilities and stopped travel.
Radar Animation
Courtesy UCAR
|
During December 4-5, an early season winter storm brought an expansive shield of snow and ice through much of the eastern U.S., from the lower Ohio Valley, southern Appalachians and into the Northeast. Snow accumulations of 10-20 cm (4-8 inches) were common along the northern edge of the precipitation shield, while a significant accrual of glaze occurred in the Carolinas. The storm caused at least 17 fatalities, mostly from traffic accidents (CNN).
|
| In the Carolinas, electric utilities provider Duke Power characterized the ice storm as the worst in the company's history, with 1.2 million customers or nearly half its entire customer base without power on the morning of the 5th. This surpassed electrical outages inflicted by Hurricane Hugo as it swept through the central Carolinas in September 1989. |
larger image
|
After skies cleared on the 6th, enhanced satellite imagery depicted the extensive area of fresh snow cover, extending from the Oklahoma and Texas panhandles, eastward into the lower Ohio Valley.
| Heavy lake effect snow fell downwind of the U.S. Great Lakes during December 1-2. Buffalo, New York reported 41 cm (16 inches) of snow during this period, with thundersnow reported late in the afternoon on the 1st. |
larger image
|
larger image
|
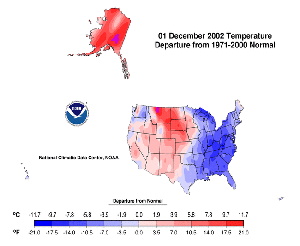
While the eastern U.S. experienced much colder than normal temperatures on December 1, much of Alaska was basking in above average warmth. Many daily temperature records were set across this region through the beginning of the month.
|
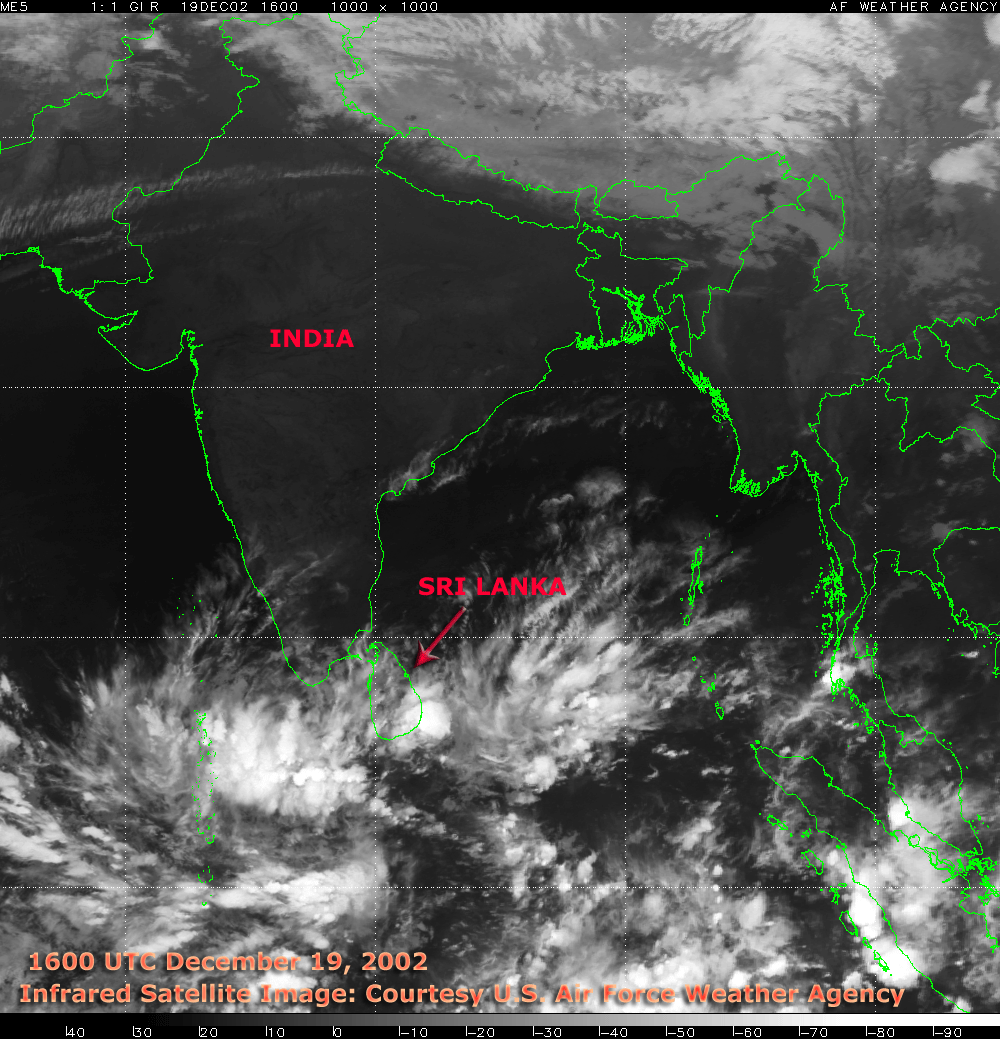
Across far northern India, heavy snowfall in the Kashmir Valley on the 19th caused the closure of the Srinagar-Jammu National Highway, the only link between the Kashmir Valley and the rest of the country.
| In Tajikstan, severe winter weather during December produced outages of electricity, water and gas in the Tajikstan capital of Dushanbe. Harsh weather conditions struck in early December, leaving fuel supplies at an all time low, damaging pipes and hampering transportation (IRIN). Snow cover throughout much of the region was above average during the month. |
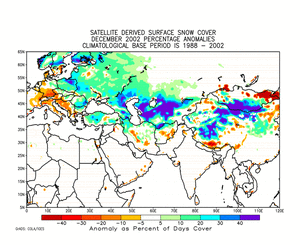
larger image
|
References:
Basist, A., N.C. Grody, T.C. Peterson and C.N. Williams, 1998: Using the Special Sensor Microwave/Imager to Monitor Land Surface Temperatures, Wetness, and Snow Cover. Journal of Applied Meteorology, 37, 888-911.
Peterson, Thomas C. and Russell S. Vose, 1997: An overview of the Global Historical Climatology Network temperature data base. Bulletin of the American Meteorological Society, 78, 2837-2849.
For all climate questions other than questions concerning this report, please contact the National Climatic Data Center's Climate Services Division:
Climate Services Division
NOAA/National Climatic Data Center
151 Patton Avenue, Room 120
Asheville, NC 28801-5001
fax: 828-271-4876
phone: 828-271-4800
email: ncdc.orders@noaa.gov
For more information, refer also to ...
November 2002 Hazardsand Significant Events
Selected U.S. City and State Extremes
2002 Atlantic Hurricanes
2002 U.S. Wildfire Summary
SSMI Derived Products
Global Historical Climatology Network (GHCN)
The Blended GHCN - SSM/I Product
The Global Temperature Anomalies
CLIMVIS - Global Summary of the Day
CAMS data provided by the Climate Prediction Center
Geographic Reference Maps (pdf format)
For further information on the historical climate perspective presented in this report, contact:
Scott Stephens
NOAA/National Climatic Data Center
151 Patton Avenue
Asheville, NC 28801-5001
fax: 828-271-4328
email: Scott.Stephens@noaa.gov
-or-
Jay Lawrimore
NOAA/National Climatic Data Center
151 Patton Avenue
Asheville, NC 28801-5001
fax: 828-271-4328
email: Jay.Lawrimore@noaa.gov
 NCDC / Climate
Monitoring / Climate
of 2002 / Hazards / Search / Help NCDC / Climate
Monitoring / Climate
of 2002 / Hazards / Search / Help
http://www.ncdc.noaa.gov/oa/climate/research/2002/dec/hazards.html
Downloaded Wednesday, 17-Sep-2008 06:57:56 EDT
Last Updated Friday, 22-Jul-2005 11:53:56 EDT by Scott.Stephens@noaa.gov
Please see the NCDC Contact Page if you have questions or comments.
|
 Super Typhoon Pongsona


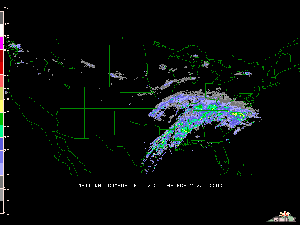
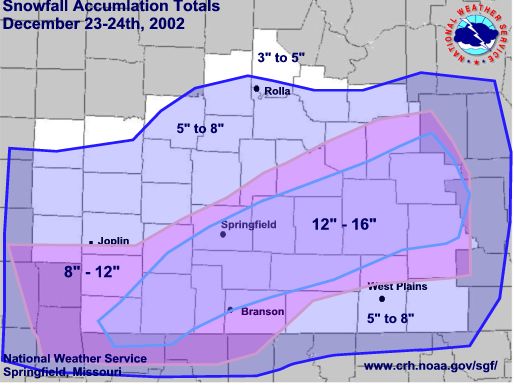
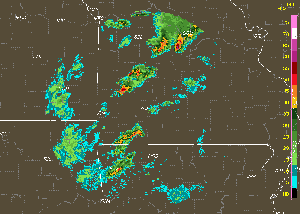 Thunderstorms Produce Severe Weather in Missouri
 larger image
 Infrared Satellite Image of Europe
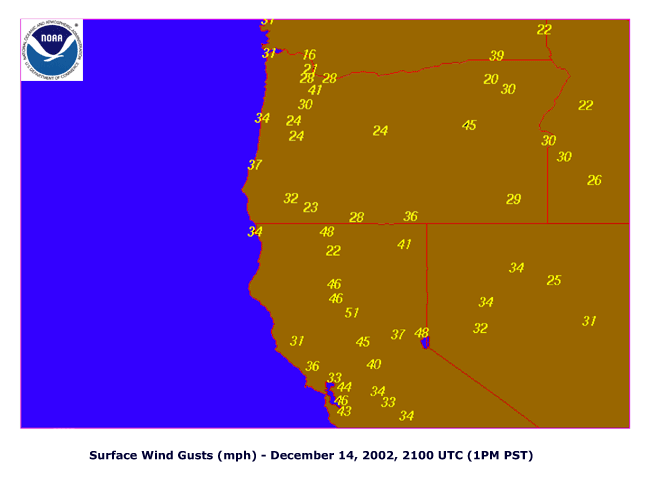
 Powerful Storm System Affects U.S. West Coast
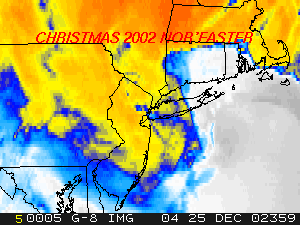


