

Internet Address: http://www.bls.gov/ro2/
Fax-On-Demand: (212) 337-2412
Media Contact: Michael L. Dolfman,(212) 337-2500
Information: Martin Kohli,(212) 337-2420           FOR RELEASE: August 27, 2007
JULY 2007 JOB COUNT FOR THE GREATER NEW YORK AREA ROSE 76,800
OVER THE YEAR
Total nonfarm employment for the New York-Northern New Jersey-Long
Island Metropolitan Statistical Area1 stood at 8,544,600 in July 2007,
76,800 above its year-ago level, the Bureau of Labor Statistics of the
U.S. Department of Labor reported today. Regional Commissioner Michael
L. Dolfman pointed out that the July increase was in line with increases
over the previous four months. New York City accounted for most of the
area's job growth, adding 52,500 jobs over the year. The City also
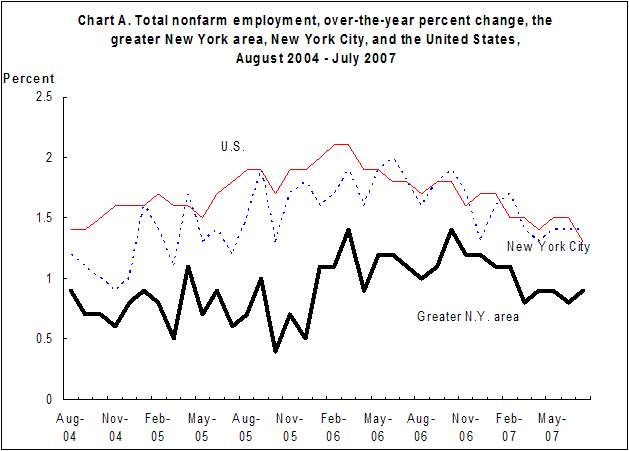
outpaced the greater New York area in job growth from July a year ago-1.4
percent versus 0.9 percent. In fact, the job growth rate for the City
has been either 1.4 or 1.3 percent and for the metropolitan area, 0.9 or
0.8 percent, since March 2007. Nationally, employment increased 1.3
percent from July a year ago, and while the City kept pace with the
national average, the greater New York area lagged behind. (See chart A.
All data in this release are not seasonally adjusted; accordingly, over-
the-year analysis is used throughout.)
Since July 2003, the New York metropolitan area has added 293,800
jobs, more than offsetting the losses incurred from July 2001 to July
2003. As a result, the July 2007 employment count in the greater New
York area stood 1.2 percent above its previous peak in July 2001.
Nationally, the economy enjoyed a much stronger recovery, with job growth
of 5.7 percent since July 2001.
In New York City, by contrast, the recovery from the 2001 recession
remained incomplete. Despite adding 200,400 jobs over the past four
years, New York City's job count stood 0.2 percent below its previous
July peak in 2000.
Industry employment in the greater New York area
In the greater New York area, employment advanced in all but two
industry supersectors from July 2006 to July 2007, and two added more
than 20,000 jobs. Professional and business services experienced the.
strongest employment growth, adding 21,600 jobs over the year-roughly the
same number as in the previous four months. Most of these jobs were in
professional, scientific, and technical services, which increased by
18,900. The job count in the education and health services supersector
rose by 20,500 over the year, the smallest gain posted since August 2005.
Another supersector, leisure and hospitality, added 13,100 jobs from July
a year ago, and four others (natural resources, mining, and construction;
financial activities; other services; and government) had increases
between 8,000 and 10,000.
In contrast, manufacturing shed 17,600 jobs from July 2006 to July
2007 in the New York metropolitan area. Employment in the information
supersector declined 1,600, the first over-the-year loss since May 2005.
Although natural resources, mining, and construction had the fourth
largest numeric increase in jobs (9,800), it had the largest over-the-
year percentage change in the greater metropolitan area, 2.7 percent.
The other services supersector had the next fastest growth rate, 2.4
percent, followed by four others with job gains of 1.0 percent or more
(leisure and hospitality, professional and business services, education
and health, and financial activities).
 Growth rates by industry supersector were generally higher at the
national level. The natural resources and mining supersector, published
separately from construction at the national level, recorded the sharpest
growth in employment, up 4.8 percent from July a year ago. Two
supersectors, education and health services and leisure and hospitality,
had the next highest percentage gain, both at 3.2 percent. Six other
supersectors had growth rates at or above 1.0 percent.
Two supersectors in the United States lost jobs over the year. In
manufacturing employment was down 1.2 percent from July 2006. (In
comparison, the rate of job loss in this supersector was much higher in
the New York area, -3.8 percent.) Construction employment at the
national level was also down from July a year ago, shrinking 0.8 percent.
Including the July 2007 decline, this supersector has recorded over-the-
year losses for four consecutive months.
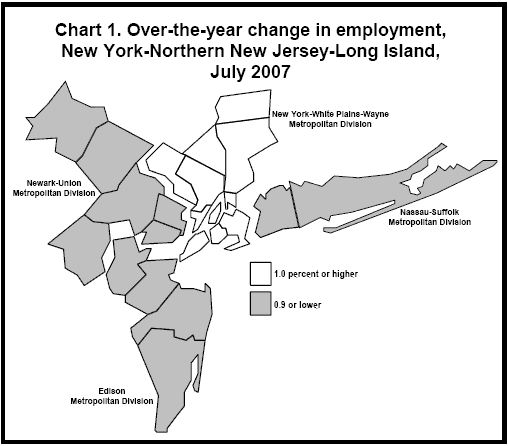
Metropolitan divisions
The greater New York area contains four metropolitan divisions,
essentially separately identifiable employment centers within a
metropolitan area. Each of these divisions added jobs from July 2006 to
July 2007. Not unexpectedly, the New York-White Plains-Wayne
Metropolitan Division, comprising over 60 percent of the area workforce,
experienced the largest employment gain, 59,100. This was in line with
over-the-year increases during the previous four months, which had ranged
from 53,100 to 55,500. Two metropolitan divisions added a similar number
of jobs, Nassau-Suffolk (8,000) and Edison (7,500). Employment in the
Newark-Union Metropolitan Division increased 2,200 over the year. In
these last three divisions, the 12-month gain in July was also consistent
with trends of the previous four months.
The New York-White Plains-Wayne Metropolitan Division consists of New
York City and two three-county areas: Putnam-Rockland-Westchester in New
York and Bergen-Hudson-Passaic in New Jersey. Of these three components,
New York City accounted for most of the division's, not to mention
metropolitan area's, over-the-year increase in employment with the
addition of 52,500 jobs in July. Putnam-Rockland-Westchester added 6,400
jobs. Employment in Bergen-Hudson-Passaic, however, was virtually
unchanged.
July 2007 job growth in New York City was led by professional and
business services, which expanded by 14,700. The next largest increase
occurred in financial activities (11,800), followed by education and
health services (10,700). Not surprisingly, these three supersectors
were also among the top job gainers in the New York-White Plains-Wayne
Metropolitan Division and the greater New York area.
All four divisions in the greater New York area had over-the-year job
growth below that of the nation (1.3 percent), although New York-White
Plains-Wayne (1.2 percent) was close. (See chart 1.) Employment in
Edison grew by 0.7 percent and in Nassau-Suffolk, by 0.6 percent. Job
growth in Newark-Union edged up 0.2 percent.
Table A. Nonfarm employment, New York-Northern New Jersey-Long Island, not seasonally adjusted
(Numbers in thousands)
_________________________________________________________________________________________________
| | | | | Change from
Area | 2006 | 2007 | 2007 | 2007 | July 2006
| July | May | June | July p |to July p 2007
___________________________________________|________|________|________|_________|________________
New York-Northern New Jersey-Long Island 8,467.8 8,547.8 8,619.4 8,544.6 76.8
Edison 1,041.2 1,041.4 1,058.4 1,048.7 7.5
Nassau-Suffolk 1,253.0 1,263.9 1,279.9 1,261.0 8.0
New York-White Plains-Wayne 5,135.4 5,201.3 5,231.8 5,194.5 59.1
Bergen-Hudson-Passaic 897.4 905.0 910.6 897.6 0.2
New York City 3,665.9 3,721.1 3,738.5 3,718.4 52.5
Putnam-Rockland-Westchester 572.1 575.2 582.7 578.5 6.4
Newark-Union 1,038.2 1,041.2 1,049.3 1,040.4 2.2
_________________________________________________________________________________________________
p = preliminary.
NOTE: The Edison Metropolitan Division consists of Middlesex, Monmouth, Ocean, and Somerset
Counties in New Jersey. The Nassau-Suffolk Metropolitan Division consists of Nassau and Suffolk
Counties in New York. The New York-Wayne-White Plains Metropolitan Division consists of New York
City and Westchester, Rockland,and Putnam Counties in New York; and Bergen, Hudson, and Passaic
Counties in New Jersey. The Newark-Union Metropolitan Division consists of Essex, Hunterdon,
Morris, Sussex, and Union Counties in New Jersey; and Pike County in Pennsylvania.
Industry supersectors. In July 2007, employment growth in the New
York-White Plains-Wayne division was brisk in natural resources, mining,
and construction, up 3.8 percent, and even faster paced in New York City,
5.9 percent. (See table 1.) Within this supersector, job gains were
particularly robust in construction of buildings in the City, up 9.6
percent over the year. Relatively strong growth in this division also
occurred in leisure and hospitality (3.2 percent) and other services and
professional and business services (both 1.9 percent). The increase in
financial activities, 1.8 percent, was driven largely by the securities
industry, which advanced 4.9 percent over the year in New York City.
Employment in education and health services increased 1.7 percent. In
four other supersectors-leisure and hospitality, other services,
professional and business services, and financial activities-job growth
rates in this division matched or exceeded their respective national
averages.
Manufacturing and information were the only two supersectors in the
New York-White Plains-Wayne Metropolitan Division to shed jobs over the
year with declines of 5.1 and 1.4 percent, respectively. The losses in
manufacturing were concentrated in New York City (-6.9 percent) and
Bergen-Hudson-Passaic (-4.6 percent).
In the Nassau-Suffolk Metropolitan Division, employment growth was led
by natural resources, mining, and construction, with a 3.9-percent gain.
Professional and business services followed with a 2.4-percent gain,
outpacing the national increase of 1.8 percent. Two supersectors lost at
least 1,000 jobs. Employment in manufacturing was down 1.9 percent, and
in financial activities, 2.1 percent. Financial activities has recorded
over-the-year job declines every month since January 2005, a period of
employment loss that exceeds the 30-month streak for manufacturing.
In the Edison Metropolitan Division, other services (7.1 percent) and
information (3.3 percent) experienced the greatest job growth from July
2006 to July 2007; each of these industries grew at a pace that surpassed
its respective national industry average. Manufacturing and trade,
transportation, and utilities both lost more than 1,000 jobs, declining
by 1.5 and 0.7 percent, respectively. Nationally, trade, transportation,
and utilities increased by 1.0 percent over the year.
In the Newark-Union Metropolitan Division, government added more jobs
over the year than any supersector, increasing 1.7 percent; this was
above the national rate of growth of 1.1 percent. Education and health
services (1.4 percent) posted the next highest increase, but this change
lagged the national gain of 3.2 percent. Trade, transportation, and
utilities (1.0 percent) had the next strongest employment growth,
matching its national percentage. Manufacturing employment shrank 4.4
percent in this division from July a year ago, and leisure and
hospitality decreased 1.4 percent. Nationally, leisure and hospitality
added jobs, increasing 3.2 percent over the year.
Employment in the 12 largest areas
The New York-Northern New Jersey-Long Island area was 1 of the
nation's 12 largest metropolitan statistical areas in July 2007. Six of
these 12 areas experienced over-the-year job growth greater than the
national increase of 1.3 percent. The top two high-growth areas, both in
Texas, had employment gains greater than twice the U.S. average-Houston-
Baytown-Sugarland (3.4 percent) and Dallas-Fort Worth-Arlington (3.2
percent). Atlanta-Sandy Springs-Marietta, Ga. (2.1 percent); Washington-
Arlington-Alexandria, D.C.-Va.-Md.-W.Va. (1.7 percent); and San Francisco-
Oakland-Fremont, Calif., and Miami-Fort Lauderdale-Pompano Beach, Fla.
(both 1.6 percent) followed. Of these six high-growth areas, only San
Francisco was not located in the South region of the country. (See chart
B and table 2.)
Growth rates by industry supersector were generally higher at the
national level. The natural resources and mining supersector, published
separately from construction at the national level, recorded the sharpest
growth in employment, up 4.8 percent from July a year ago. Two
supersectors, education and health services and leisure and hospitality,
had the next highest percentage gain, both at 3.2 percent. Six other
supersectors had growth rates at or above 1.0 percent.
Two supersectors in the United States lost jobs over the year. In
manufacturing employment was down 1.2 percent from July 2006. (In
comparison, the rate of job loss in this supersector was much higher in
the New York area, -3.8 percent.) Construction employment at the
national level was also down from July a year ago, shrinking 0.8 percent.
Including the July 2007 decline, this supersector has recorded over-the-
year losses for four consecutive months.
Metropolitan divisions
The greater New York area contains four metropolitan divisions,
essentially separately identifiable employment centers within a
metropolitan area. Each of these divisions added jobs from July 2006 to
July 2007. Not unexpectedly, the New York-White Plains-Wayne
Metropolitan Division, comprising over 60 percent of the area workforce,
experienced the largest employment gain, 59,100. This was in line with
over-the-year increases during the previous four months, which had ranged
from 53,100 to 55,500. Two metropolitan divisions added a similar number
of jobs, Nassau-Suffolk (8,000) and Edison (7,500). Employment in the
Newark-Union Metropolitan Division increased 2,200 over the year. In
these last three divisions, the 12-month gain in July was also consistent
with trends of the previous four months.
The New York-White Plains-Wayne Metropolitan Division consists of New
York City and two three-county areas: Putnam-Rockland-Westchester in New
York and Bergen-Hudson-Passaic in New Jersey. Of these three components,
New York City accounted for most of the division's, not to mention
metropolitan area's, over-the-year increase in employment with the
addition of 52,500 jobs in July. Putnam-Rockland-Westchester added 6,400
jobs. Employment in Bergen-Hudson-Passaic, however, was virtually
unchanged.
July 2007 job growth in New York City was led by professional and
business services, which expanded by 14,700. The next largest increase
occurred in financial activities (11,800), followed by education and
health services (10,700). Not surprisingly, these three supersectors
were also among the top job gainers in the New York-White Plains-Wayne
Metropolitan Division and the greater New York area.
All four divisions in the greater New York area had over-the-year job
growth below that of the nation (1.3 percent), although New York-White
Plains-Wayne (1.2 percent) was close. (See chart 1.) Employment in
Edison grew by 0.7 percent and in Nassau-Suffolk, by 0.6 percent. Job
growth in Newark-Union edged up 0.2 percent.
Table A. Nonfarm employment, New York-Northern New Jersey-Long Island, not seasonally adjusted
(Numbers in thousands)
_________________________________________________________________________________________________
| | | | | Change from
Area | 2006 | 2007 | 2007 | 2007 | July 2006
| July | May | June | July p |to July p 2007
___________________________________________|________|________|________|_________|________________
New York-Northern New Jersey-Long Island 8,467.8 8,547.8 8,619.4 8,544.6 76.8
Edison 1,041.2 1,041.4 1,058.4 1,048.7 7.5
Nassau-Suffolk 1,253.0 1,263.9 1,279.9 1,261.0 8.0
New York-White Plains-Wayne 5,135.4 5,201.3 5,231.8 5,194.5 59.1
Bergen-Hudson-Passaic 897.4 905.0 910.6 897.6 0.2
New York City 3,665.9 3,721.1 3,738.5 3,718.4 52.5
Putnam-Rockland-Westchester 572.1 575.2 582.7 578.5 6.4
Newark-Union 1,038.2 1,041.2 1,049.3 1,040.4 2.2
_________________________________________________________________________________________________
p = preliminary.
NOTE: The Edison Metropolitan Division consists of Middlesex, Monmouth, Ocean, and Somerset
Counties in New Jersey. The Nassau-Suffolk Metropolitan Division consists of Nassau and Suffolk
Counties in New York. The New York-Wayne-White Plains Metropolitan Division consists of New York
City and Westchester, Rockland,and Putnam Counties in New York; and Bergen, Hudson, and Passaic
Counties in New Jersey. The Newark-Union Metropolitan Division consists of Essex, Hunterdon,
Morris, Sussex, and Union Counties in New Jersey; and Pike County in Pennsylvania.
Industry supersectors. In July 2007, employment growth in the New
York-White Plains-Wayne division was brisk in natural resources, mining,
and construction, up 3.8 percent, and even faster paced in New York City,
5.9 percent. (See table 1.) Within this supersector, job gains were
particularly robust in construction of buildings in the City, up 9.6
percent over the year. Relatively strong growth in this division also
occurred in leisure and hospitality (3.2 percent) and other services and
professional and business services (both 1.9 percent). The increase in
financial activities, 1.8 percent, was driven largely by the securities
industry, which advanced 4.9 percent over the year in New York City.
Employment in education and health services increased 1.7 percent. In
four other supersectors-leisure and hospitality, other services,
professional and business services, and financial activities-job growth
rates in this division matched or exceeded their respective national
averages.
Manufacturing and information were the only two supersectors in the
New York-White Plains-Wayne Metropolitan Division to shed jobs over the
year with declines of 5.1 and 1.4 percent, respectively. The losses in
manufacturing were concentrated in New York City (-6.9 percent) and
Bergen-Hudson-Passaic (-4.6 percent).
In the Nassau-Suffolk Metropolitan Division, employment growth was led
by natural resources, mining, and construction, with a 3.9-percent gain.
Professional and business services followed with a 2.4-percent gain,
outpacing the national increase of 1.8 percent. Two supersectors lost at
least 1,000 jobs. Employment in manufacturing was down 1.9 percent, and
in financial activities, 2.1 percent. Financial activities has recorded
over-the-year job declines every month since January 2005, a period of
employment loss that exceeds the 30-month streak for manufacturing.
In the Edison Metropolitan Division, other services (7.1 percent) and
information (3.3 percent) experienced the greatest job growth from July
2006 to July 2007; each of these industries grew at a pace that surpassed
its respective national industry average. Manufacturing and trade,
transportation, and utilities both lost more than 1,000 jobs, declining
by 1.5 and 0.7 percent, respectively. Nationally, trade, transportation,
and utilities increased by 1.0 percent over the year.
In the Newark-Union Metropolitan Division, government added more jobs
over the year than any supersector, increasing 1.7 percent; this was
above the national rate of growth of 1.1 percent. Education and health
services (1.4 percent) posted the next highest increase, but this change
lagged the national gain of 3.2 percent. Trade, transportation, and
utilities (1.0 percent) had the next strongest employment growth,
matching its national percentage. Manufacturing employment shrank 4.4
percent in this division from July a year ago, and leisure and
hospitality decreased 1.4 percent. Nationally, leisure and hospitality
added jobs, increasing 3.2 percent over the year.
Employment in the 12 largest areas
The New York-Northern New Jersey-Long Island area was 1 of the
nation's 12 largest metropolitan statistical areas in July 2007. Six of
these 12 areas experienced over-the-year job growth greater than the
national increase of 1.3 percent. The top two high-growth areas, both in
Texas, had employment gains greater than twice the U.S. average-Houston-
Baytown-Sugarland (3.4 percent) and Dallas-Fort Worth-Arlington (3.2
percent). Atlanta-Sandy Springs-Marietta, Ga. (2.1 percent); Washington-
Arlington-Alexandria, D.C.-Va.-Md.-W.Va. (1.7 percent); and San Francisco-
Oakland-Fremont, Calif., and Miami-Fort Lauderdale-Pompano Beach, Fla.
(both 1.6 percent) followed. Of these six high-growth areas, only San
Francisco was not located in the South region of the country. (See chart
B and table 2.)
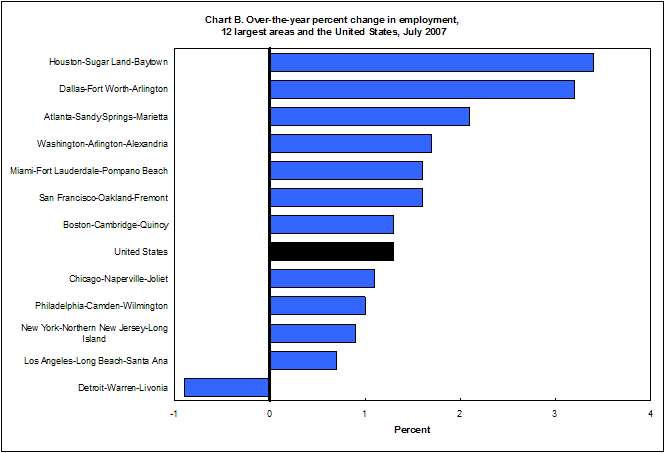
Five metropolitan areas had employment growth equal to or below the
national average, ranging from 1.3 to 0.7 percent: Boston-Cambridge-
Quincy, Mass.-N.H.; Chicago-Naperville-Joliet, Ill.-Ind.-Wis.;
Philadelphia-Camden-Wilmington, Pa.-N.J.-Del.-Md.; New York-Northern New
Jersey-Long Island, N.Y.-N.J.-Pa.; and Los Angeles-Long Beach-Santa Ana,
Calif. Detroit-Warren-Livonia, Mich., was the only area of the 12 to
lose jobs over the year, dropping 0.9 percent of its employment.
The fastest-growing supersector from July 2006 to July 2007 varied
among metropolitan areas. Among those industries adding at least 1,000
jobs over the year, education and health services had the highest
percentage increase in employment in 4 of the 12 areas (Boston, Detroit,
Los Angeles, and San Francisco) and ranked 2nd in 3 other areas (Atlanta,
Miami, and Washington, D.C.). One industry, construction, had a varied
performance across the metropolitan areas. Job growth in this industry
was strong in Houston (6.3 percent), Chicago (2.4 percent), and Atlanta
(2.1 percent), but particularly weak in San Francisco (-3.1 percent) and
Los Angeles (-1.4 percent). Nationwide, construction jobs were down 0.8
percent over the year.
The two areas with the fastest rates of job growth-Houston and
Dallas-also added the most jobs. Employment grew by 91,000 in Dallas and
by 82,000 in Houston. In 7 of the 12 areas-Chicago, Dallas, Houston, New
York, Philadelphia, San Francisco, and Washington, D.C.-professional and
business services added the most jobs. In four areas-Boston, Detroit,
Los Angeles, and Miami-the education and health services supersector had
the largest numerical increase.
_________________________________
1The New York-Northern New Jersey-Long Island, NY-NJ-PA Metropolitan
Statistical Area (MSA) consists of New York City, Nassau, Putnam,
Rockland, Suffolk, and Westchester Counties in New York; Bergen, Essex,
Hudson, Hunterdon, Middlesex, Monmouth, Morris, Ocean, Passaic, Somerset,
Sussex, and Union Counties in New Jersey; and Pike County, Pennsylvania.
For convenience, the New York-Northern New Jersey-Long Island MSA is
referred to as the greater New York area throughout this release.
NYLS - 7297 Labor - New York
8/23/07
Technical Note
This release presents nonfarm payroll employment estimates from the
Current Employment Statistics (CES) program for the New York-Northern New
Jersey-Long Island Metropolitan Statistical Area and the 12 largest
metropolitan areas. The rankings were based on population estimates by
the U.S. Census Bureau in 2000. The CES program is a Federal-State
cooperative endeavor.
Employment
Definitions. Employment data refer to persons on establishment
payrolls who receive pay for any part of the pay period which includes
the 12th of the month. Persons are counted at their place of work
rather than at their place of residence; those appearing on more than
one payroll are counted on each payroll. Industries are classified on
the basis of their principal activity in accordance with the 2002
version of the North American Industry Classification System.
Method of estimation. The employment data are estimated using a "link
relative" technique in which a ratio (link relative) of current-month
employment to that of the previous month is computed from a sample of
establishments reporting for both months. The estimates of employment
for the current month are obtained by multiplying the estimates for the
previous month by these ratios. Small-domain models are used as the
official estimators for the approximately 10 percent of CES published
series.
Annual revisions. Employment estimates are adjusted annually to a
complete count of jobs, called benchmarks, derived principally from tax
reports which are submitted by employers who are covered under state
unemployment insurance (UI) laws. The benchmark information is used to
adjust the monthly estimates between the new benchmark and the preceding
one and also to establish the level of employment for the new benchmark
month. Thus, the benchmarking process establishes the level of
employment, and the sample is used to measure the month-to-month changes
in the level for the subsequent months.
Reliability of the estimates
The estimates presented in this release are based on sample survey and
administrative data and thus are subject to sampling and other types of
errors. Sampling error is a measure of sampling variability--that is,
variation that occurs by chance because a sample rather than the entire
population is surveyed. Survey data are also subject to nonsampling
errors, such as those which can be introduced into the data collection
and processing operations. Estimates not directly derived from sample
surveys are subject to additional errors resulting from the special
estimation processes used. The sums of individual items may not always
equal the totals shown in the same tables because of rounding.
Employment estimates. Measures of sampling error are available for
state CES data at the NAICS supersector level and for metropolitan area
CES data at the total nonfarm level. Information on recent benchmark
revisions for states is available on the BLS Web site at
(http://www.bls.gov/sae/).
Area definitions. The substate area data published in this release
reflect the standards and definitions established by the U.S. Office of
Management and Budget on December 5, 2005. A detailed list of the
geographic definitions is published annually in the May issue of
Employment and Earnings.
Additional information
More complete information on the technical procedures used to develop
these estimates and additional data appear in Employment and Earnings,
which is available by subscription from the Superintendent of Documents,
U.S. Government Printing Office, Washington, DC 20402 (telephone 202-512-
1800).
Information in this release will be made available to sensory impaired
individuals upon request. Voice phone: 202-691-5200; TDD message
referral phone: 1-800-877-8339.
Table 1. Employees on nonfarm payrolls by industry supersector, New York-Northern New Jersey-
Long Island and United States, not seasonally adjusted
(Numbers in thousands)
Change from
July 2006 to
2006 2007 2007 2007 July p 2007
Area and industry supersector July May June July p Number Percent
United States
Total nonfarm 136,006.0 138,655.0 139,161.0 137,828.0 1,822.0 1.3
Natural resources and mining 702.0 719.0 733.0 736.0 34.0 4.8
Construction 8,011.0 7,736.0 7,913.0 7,947.0 -64.0 -0.8
Manufacturing 14,261.0 14,059.0 14,149.0 14,088.0 -173.0 -1.2
Trade, transportation, and utilities 26,213.0 26,420.0 26,524.0 26,467.0 254.0 1.0
Information 3,060.0 3,105.0 3,117.0 3,104.0 44.0 1.4
Financial activities 8,434.0 8,454.0 8,518.0 8,554.0 120.0 1.4
Professional and business services 17,733.0 17,891.0 18,106.0 18,056.0 323.0 1.8
Education and health services 17,481.0 18,377.0 18,183.0 18,042.0 561.0 3.2
Leisure and hospitality 13,826.0 13,763.0 14,156.0 14,263.0 437.0 3.2
Other services 5,489.0 5,502.0 5,556.0 5,550.0 61.0 1.1
Government 20,796.0 22,629.0 22,206.0 21,021.0 225.0 1.1
New York-Northern New Jersey-Long Island Metropolitan Statistical Area
Total nonfarm 8,467.8 8,547.8 8,619.4 8,544.6 76.8 0.9
Natural resources, mining, and
construction 357.3 358.2 364.1 367.1 9.8 2.7
Manufacturing 465.1 452.6 455.2 447.5 -17.6 -3.8
Trade, transportation, and utilities 1,579.5 1,593.9 1,609.6 1,584.9 5.4 0.3
Information 293.6 291.8 294.2 292.0 -1.6 -0.5
Financial activities 802.1 796.4 805.6 810.9 8.8 1.1
Professional and business services 1,282.8 1,286.5 1,307.7 1,304.4 21.6 1.7
Education and health services 1,381.1 1,441.9 1,426.6 1,401.6 20.5 1.5
Leisure and hospitality 666.2 650.8 674.3 679.3 13.1 2.0
Other services 367.0 373.5 377.2 375.7 8.7 2.4
Government 1,273.1 1,302.2 1,304.9 1,281.2 8.1 0.6
Edison Metropolitan Division
Total nonfarm 1,041.2 1,041.4 1,058.4 1,048.7 7.5 0.7
Natural resources, mining, and
construction 50.4 48.5 49.5 50.1 -0.3 -0.6
Manufacturing 77.5 76.3 76.9 76.3 -1.2 -1.5
Trade, transportation, and utilities 225.9 223.9 226.6 224.3 -1.6 -0.7
Information 30.5 31.3 31.8 31.5 1.0 3.3
Financial activities 65.5 64.4 64.9 66.0 0.5 0.8
Professional and business services 172.5 173.5 176.2 175.1 2.6 1.5
Education and health services 134.2 136.5 137.0 135.9 1.7 1.3
Leisure and hospitality 91.6 83.2 89.2 91.5 -0.1 -0.1
Other services 49.2 51.0 52.2 52.7 3.5 7.1
Government 143.9 152.8 154.1 145.3 1.4 1.0
Nassau-Suffolk Metropolitan Division
Total nonfarm 1,253.0 1,263.9 1,279.9 1,261.0 8.0 0.6
Natural resources, mining, and
construction 71.8 72.2 73.1 74.6 2.8 3.9
Manufacturing 85.4 83.7 84.8 83.8 -1.6 -1.9
Trade, transportation, and utilities 269.3 269.7 273.5 269.2 -0.1 0.0
Information 30.1 30.1 30.3 30.3 0.2 0.7
Financial activities 81.0 78.3 79.4 79.3 -1.7 -2.1
Professional and business services 165.6 166.5 170.0 169.6 4.0 2.4
Education and health services 199.1 206.9 202.9 200.6 1.5 0.8
Leisure and hospitality 109.9 99.9 107.8 111.5 1.6 1.5
Other services 52.1 52.4 53.6 52.7 0.6 1.2
Government 188.7 204.2 204.5 189.4 0.7 0.4
New York-White Plains-Wayne Metropolitan Division
Total nonfarm 5,135.4 5,201.3 5,231.8 5,194.5 59.1 1.2
Natural resources, mining, and
construction 189.9 193.2 196.6 197.2 7.3 3.8
Manufacturing 211.2 205.1 205.6 200.4 -10.8 -5.1
Trade, transportation, and utilities 872.5 884.6 892.1 877.4 4.9 0.6
Information 208.1 205.9 207.4 205.2 -2.9 -1.4
Financial activities 577.3 576.8 583.9 587.6 10.3 1.8
Professional and business services 779.5 783.6 796.7 794.4 14.9 1.9
Education and health services 907.5 954.0 942.9 922.9 15.4 1.7
Leisure and hospitality 394.3 400.9 408.0 406.9 12.6 3.2
Other services 216.5 221.3 221.7 220.6 4.1 1.9
Government 778.6 775.9 776.9 781.9 3.3 0.4
New York City
Total nonfarm 3,665.9 3,721.1 3,738.5 3,718.4 52.5 1.4
Natural resources, mining, and
construction 119.4 124.4 126.7 126.5 7.1 5.9
Manufacturing 105.1 100.4 100.6 97.9 -7.2 -6.9
Trade, transportation, and utilities 550.9 560.7 565.5 556.8 5.9 1.1
Information 165.7 164.6 165.8 164.0 -1.7 -1.0
Financial activities 465.0 466.8 473.0 476.8 11.8 2.5
Professional and business services 576.2 582.0 592.7 590.9 14.7 2.6
Education and health services 676.2 714.4 704.8 686.9 10.7 1.6
Leisure and hospitality 286.0 296.1 299.0 295.7 9.7 3.4
Other services 153.8 156.7 156.5 154.6 0.8 0.5
Government 567.6 555.0 553.9 568.3 0.7 0.1
Newark-Union Metropolitan Division
Total nonfarm 1,038.2 1,041.2 1,049.3 1,040.4 2.2 0.2
Natural resources, mining, and
construction 45.2 44.3 44.9 45.2 0.0 0.0
Manufacturing 91.0 87.5 87.9 87.0 -4.0 -4.4
Trade, transportation, and utilities 211.8 215.7 217.4 214.0 2.2 1.0
Information 24.9 24.5 24.7 25.0 0.1 0.4
Financial activities 78.3 76.9 77.4 78.0 -0.3 -0.4
Professional and business services 165.2 162.9 164.8 165.3 0.1 0.1
Education and health services 140.3 144.5 143.8 142.2 1.9 1.4
Leisure and hospitality 70.4 66.8 69.3 69.4 -1.0 -1.4
Other services 49.2 48.8 49.7 49.7 0.5 1.0
Government 161.9 169.3 169.4 164.6 2.7 1.7
_______________________________________________________________________________________________
p =preliminary.
NOTE: Data are counts of jobs by place of work. Estimates are currently projected from March
2006 benchmark levels. Estimates subsequent to the current benchmark month are provisional and
will be revised when new information becomes available.
Table 2. Employees on nonfarm payrolls by industry supersector, 12 largest metropolitan
statistical areas, not seasonally adjusted
(Numbers in thousands)
Change from
July 2006 to
2006 2007 2007 2007 July p 2007
Area and industry supersector July May June July p Number Percent
Atlanta-Sandy Springs-Marietta, GA
Total nonfarm 2,385.2 2,442.0 2,443.9 2,434.8 49.6 2.1
Natural resources and mining 2.1 2.1 2.1 2.1 0.0 0.0
Construction 140.4 140.6 142.1 143.3 2.9 2.1
Manufacturing 177.0 176.5 176.7 175.6 -1.4 -0.8
Trade, transportation, and utilities 546.4 556.1 558.0 558.6 12.2 2.2
Information 89.0 89.6 90.5 89.8 0.8 0.9
Financial activities 162.3 163.5 163.8 164.1 1.8 1.1
Professional and business services 401.2 403.9 406.7 408.2 7.0 1.7
Education and health services 239.4 249.2 247.7 248.7 9.3 3.9
Leisure and hospitality 230.3 236.3 238.8 236.1 5.8 2.5
Other services 98.3 96.7 97.0 97.2 -1.1 -1.1
Government 298.8 327.5 320.5 311.1 12.3 4.1
Boston-Cambridge-Quincy, MA-NH
Total nonfarm 2,445.4 2,483.3 2,500.1 2,477.2 31.8 1.3
Natural resources and mining 1.3 1.3 1.3 1.4 0.1 7.7
Construction 107.4 102.8 106.0 106.9 -0.5 -0.5
Manufacturing 222.4 222.0 222.9 222.8 0.4 0.2
Trade, transportation, and utilities 415.2 416.9 421.9 417.6 2.4 0.6
Information 75.0 75.3 76.3 76.2 1.2 1.6
Financial activities 191.1 188.2 191.0 192.9 1.8 0.9
Professional and business services 401.3 405.8 413.5 412.2 10.9 2.7
Education and health services 438.5 461.5 452.3 451.7 13.2 3.0
Leisure and hospitality 225.2 217.7 226.8 229.0 3.8 1.7
Other services 89.3 85.3 86.3 87.7 -1.6 -1.8
Government 278.7 306.5 301.8 278.8 0.1 0.0
Chicago-Naperville-Joliet, IL-IN-WI
Total nonfarm 4,547.6 4,577.5 4,618.9 4,597.3 49.7 1.1
Natural resources and mining 2.8 2.5 2.6 2.7 -0.1 -3.6
Construction 229.4 225.8 232.8 234.8 5.4 2.4
Manufacturing 487.9 483.2 486.0 483.8 -4.1 -0.8
Trade, transportation, and utilities 920.4 923.0 927.8 924.3 3.9 0.4
Information 91.6 90.1 90.7 90.7 -0.9 -1.0
Financial activities 335.2 336.4 338.0 338.1 2.9 0.9
Professional and business services 738.1 745.0 754.1 755.0 16.9 2.3
Education and health services 568.4 590.4 584.6 580.3 11.9 2.1
Leisure and hospitality 420.0 411.2 426.6 428.0 8.0 1.9
Other services 202.9 198.2 202.3 202.9 0.0 0.0
Government 550.9 571.7 573.4 556.7 5.8 1.1
Dallas-Fort Worth-Arlington-Arlington, TX
Total nonfarm 2,849.8 2,949.8 2,954.3 2,940.8 91.0 3.2
Natural resources, mining, and
construction 176.8 182.9 186.0 186.7 9.9 5.6
Manufacturing 301.0 304.1 305.3 305.4 4.4 1.5
Trade, transportation, and utilities 611.1 618.0 618.3 618.7 7.6 1.2
Information 92.4 93.3 93.4 92.5 0.1 0.1
Financial activities 230.1 237.9 239.8 240.1 10.0 4.3
Professional and business services 413.9 432.3 434.2 436.3 22.4 5.4
Education and health services 299.5 309.8 309.0 311.1 11.6 3.9
Leisure and hospitality 270.4 283.4 286.6 283.3 12.9 4.8
Other services 107.8 112.0 112.9 112.3 4.5 4.2
Government 346.8 376.1 368.8 354.4 7.6 2.2
Detroit-Warren-Livonia, MI
Total nonfarm 1,959.6 2,004.6 2,008.3 1,941.6 -18.0 -0.9
Natural resources, mining, and
construction 83.9 71.1 74.5 75.6 -8.3 -9.9
Manufacturing 243.1 265.9 265.1 241.0 -2.1 -0.9
Trade, transportation, and utilities 368.6 364.0 364.2 359.6 -9.0 -2.4
Information 34.3 34.0 33.9 33.9 -0.4 -1.2
Financial activities 116.0 113.1 114.1 113.2 -2.8 -2.4
Professional and business services 354.3 360.8 364.7 358.2 3.9 1.1
Education and health services 270.9 279.0 278.4 276.7 5.8 2.1
Leisure and hospitality 188.7 190.5 191.4 189.5 0.8 0.4
Other services 91.0 91.0 91.1 90.9 -0.1 -0.1
Government 208.8 235.2 230.9 203.0 -5.8 -2.8
Houston-Sugar Land-Baytown, TX
Total nonfarm 2,436.3 2,517.2 2,522.8 2,518.3 82.0 3.4
Natural resources and mining 78.2 82.5 84.5 85.6 7.4 9.5
Construction 180.2 190.9 192.9 191.5 11.3 6.3
Manufacturing 224.8 224.0 225.8 225.8 1.0 0.4
Trade, transportation, and utilities 500.4 503.8 505.6 507.7 7.3 1.5
Information 36.1 36.1 36.5 36.2 0.1 0.3
Financial activities 140.9 142.7 142.9 143.9 3.0 2.1
Professional and business services 359.0 368.8 374.1 376.7 17.7 4.9
Education and health services 269.6 280.6 279.6 279.8 10.2 3.8
Leisure and hospitality 222.9 229.3 234.3 233.4 10.5 4.7
Other services 95.3 98.6 100.1 100.2 4.9 5.1
Government 328.9 359.9 346.5 337.5 8.6 2.6
Los Angeles-Long Beach-Santa Ana, CA
Total nonfarm 5,591.1 5,669.9 5,673.2 5,630.9 39.8 0.7
Natural resources and mining 4.6 4.4 4.5 4.6 0.0 0.0
Construction 267.9 262.9 263.9 264.2 -3.7 -1.4
Manufacturing 645.1 639.9 641.2 639.2 -5.9 -0.9
Trade, transportation, and utilities 1,081.4 1,078.9 1,080.9 1,082.3 0.9 0.1
Information 241.6 243.6 242.6 240.1 -1.5 -0.6
Financial activities 385.6 385.6 384.0 383.0 -2.6 -0.7
Professional and business services 873.3 879.7 882.8 883.6 10.3 1.2
Education and health services 607.2 641.7 634.8 627.0 19.8 3.3
Leisure and hospitality 568.2 570.5 575.3 578.0 9.8 1.7
Other services 193.8 197.0 197.5 196.9 3.1 1.6
Government 722.4 765.7 765.7 732.0 9.6 1.3
Miami-Fort Lauderdale-Pompano Beach, FL
Total nonfarm 2,366.3 2,462.8 2,430.4 2,405.1 38.8 1.6
Natural resources and mining 0.6 0.6 0.6 0.6 0.0 0.0
Construction 161.5 160.7 160.5 160.6 -0.9 -0.6
Manufacturing 99.4 98.9 99.4 98.0 -1.4 -1.4
Trade, transportation, and utilities 535.5 547.6 547.0 543.3 7.8 1.5
Information 54.4 53.6 53.7 53.5 -0.9 -1.7
Financial activities 182.4 186.7 186.8 186.7 4.3 2.4
Professional and business services 395.0 407.4 406.0 401.8 6.8 1.7
Education and health services 299.8 312.8 313.2 309.5 9.7 3.2
Leisure and hospitality 243.0 260.0 258.2 251.2 8.2 3.4
Other services 101.3 103.8 103.5 102.7 1.4 1.4
Government 293.4 330.7 301.5 297.2 3.8 1.3
New York-Northern New Jersey-Long Island, NY-NJ-PA
Total nonfarm 8,467.8 8,547.8 8,619.4 8,544.6 76.8 0.9
Natural resources, mining, and
construction 357.3 358.2 364.1 367.1 9.8 2.7
Manufacturing 465.1 452.6 455.2 447.5 -17.6 -3.8
Trade, transportation, and utilities 1,579.5 1,593.9 1,609.6 1,584.9 5.4 0.3
Information 293.6 291.8 294.2 292.0 -1.6 -0.5
Financial activities 802.1 796.4 805.6 810.9 8.8 1.1
Professional and business services 1,282.8 1,286.5 1,307.7 1,304.4 21.6 1.7
Education and health services 1,381.1 1,441.9 1,426.6 1,401.6 20.5 1.5
Leisure and hospitality 666.2 650.8 674.3 679.3 13.1 2.0
Other services 367.0 373.5 377.2 375.7 8.7 2.4
Government 1,273.1 1,302.2 1,304.9 1,281.2 8.1 0.6
Philadelphia-Camden-Wilmington, PA-NJ-DE-MD
Total nonfarm 2,788.7 2,842.5 2,846.9 2,815.2 26.5 1.0
Natural resources, mining, and
construction 136.5 135.0 136.9 137.9 1.4 1.0
Manufacturing 229.2 225.1 226.0 224.5 -4.7 -2.1
Trade, transportation, and utilities 529.3 537.1 539.9 536.0 6.7 1.3
Information 55.8 55.5 55.0 55.2 -0.6 -1.1
Financial activities 221.4 219.8 221.2 221.5 0.1 0.0
Professional and business services 421.6 426.4 430.5 430.3 8.7 2.1
Education and health services 505.1 523.7 513.6 511.1 6.0 1.2
Leisure and hospitality 230.0 229.0 235.8 235.0 5.0 2.2
Other services 125.8 126.7 128.5 128.0 2.2 1.7
Government 334.0 364.2 359.5 335.7 1.7 0.5
San Francisco-Oakland-Fremont, CA
Total nonfarm 2,003.1 2,044.3 2,051.6 2,036.0 32.9 1.6
Natural resources and mining 1.4 1.6 1.6 1.7 0.3 21.4
Construction 119.2 114.4 116.4 115.5 -3.7 -3.1
Manufacturing 140.8 142.1 142.8 142.8 2.0 1.4
Trade, transportation, and utilities 356.9 358.9 360.3 360.3 3.4 1.0
Information 68.6 68.0 68.2 68.1 -0.5 -0.7
Financial activities 158.2 159.8 159.5 158.5 0.3 0.2
Professional and business services 347.7 355.4 357.9 357.4 9.7 2.8
Education and health services 222.8 233.3 231.4 229.6 6.8 3.1
Leisure and hospitality 208.9 212.2 215.2 215.2 6.3 3.0
Other services 74.0 74.9 75.8 75.3 1.3 1.8
Government 304.6 323.7 322.5 311.6 7.0 2.3
Washington-Arlington-Alexandria, DC-VA-MD-WV
Total nonfarm 2,978.2 3,022.5 3,041.1 3,030.2 52.0 1.7
Natural resources, mining, and
construction 196.7 194.7 197.9 199.1 2.4 1.2
Manufacturing 64.1 63.3 63.9 63.5 -0.6 -0.9
Trade, transportation, and utilities 403.1 406.8 410.9 408.8 5.7 1.4
Information 99.2 98.0 98.4 98.9 -0.3 -0.3
Financial activities 162.8 163.9 165.1 165.5 2.7 1.7
Professional and business services 674.0 686.0 695.2 694.6 20.6 3.1
Education and health services 307.0 322.7 318.3 313.2 6.2 2.0
Leisure and hospitality 261.3 257.5 265.8 265.1 3.8 1.5
Other services 177.0 177.9 179.9 180.4 3.4 1.9
Government 633.0 651.7 645.7 641.1 8.1 1.3
_______________________________________________________________________________________________
p =preliminary.
NOTE: Data are counts of jobs by place of work. Estimates are currently projected from March
2006 benchmark levels. Estimates subsequent to the current benchmark month are provisional and
will be revised when new information becomes available.
Last Modified Date: December 3, 2007