

Internet Address: http://www.bls.gov/ro2/
Media Contact: Michael L. Dolfman,(212) 337-2500
Information: Martin Kohli,(646) 264-3620          FOR RELEASE: June 30, 2008
EMPLOYMENT IN THE NEW YORK AREA ROSE 0.5 PERCENT
OVER THE YEAR IN MAY 2008
Total nonfarm employment for the New York-Northern New Jersey-Long
Island Metropolitan Statistical Area1 stood at 8,647,700 in May 2008,
39,800 or 0.5 percent above its year-ago level, the Bureau of Labor
Statistics of the U.S. Department of Labor reported today. Regional
Commissioner Michael L. Dolfman pointed out that this was the area's
smallest percentage gain over a 12-month period since December 2005, when
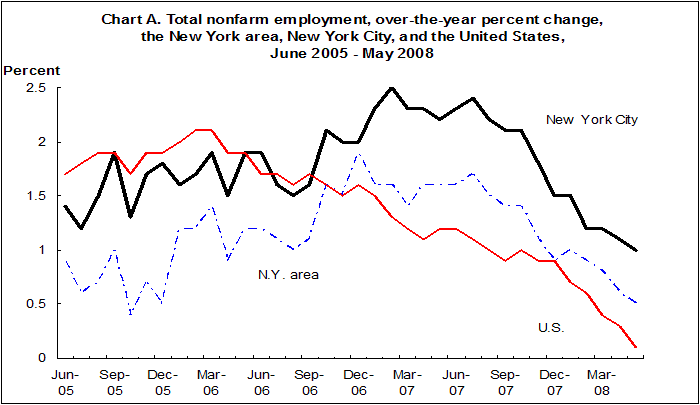
it was also 0.5 percent. (See chart A. All data in this release are not
seasonally adjusted; accordingly, over-the-year analysis is used
throughout.)
New York City, where two out of every five jobs in the area are located,
accounted for over 90 percent of the area's job growth in May, adding
36,700 jobs over the year, an increase of 1.0 percent. Still, this was
the City's smallest 12-month rate of employment growth since December
2004. Despite the slower pace of job growth, New York City, as well as
the entire metropolitan area, surpassed the 0.1-percent rate of increase
for the nation in May 2008.
 Industry employment in the New York area
In the New York area, employment advanced in all but two industry
supersectors from May 2007 to May 2008, with three adding more than
10,000 jobs. The job count in the education and health services
supersector increased by 21,000 over the year, in line with the increases
recorded since January. Government followed with a gain of 12,100, while
leisure and hospitality added 10,300 jobs, its smallest 12-month gain
since April 2006. Five other supersectors had increases between 7,000
and 2,000. In contrast to these widespread gains, employment losses were
confined to financial activities and manufacturing, which shed 6,900 and
18,700 jobs, respectively, over the year. The loss in financial
activities was the largest since April 2003, with cutbacks particularly
sharp in credit intermediation (or banking), down 6,700 jobs over the
year.
Information, up 6,500, had the fourth largest numeric increase in jobs
in the New York area in May 2008, but the largest over-the-year
percentage gain, 2.2 percent. Other services and leisure and hospitality
had the next highest rates of job growth, 1.7 and 1.6 percent,
respectively. Two additional supersectors-education and health services
and government-had employment growth of 1.4 and 0.9 percent,
respectively.
At the national level, the natural resources and mining supersector,
published separately from construction, recorded the sharpest growth in
employment, up 4.9 percent from May a year ago. Education
and health had the next highest rate of job growth, 3.1 percent,
followed by leisure and hospitality, 1.8 percent. Two other
supersectors, government and other services, had percentage increases of
1.0 and 0.7 percent, respectively.
Five supersectors in the United States lost jobs from May 2007 to May
2008. In construction, employment decreased 5.5 percent, the 14th
consecutive month of over-the-year job losses. The job count in
manufacturing shrank 2.5 percent and in information, jobs were down 1.2
percent. (As previously noted, the information supersector in the New
York area enjoyed particularly strong growth in May, counter to the
decline at the national level.) Nationally, employment also contracted
in financial activities, down 1.1 percent, and in trade, transportation,
and utilities, down 0.6 percent.
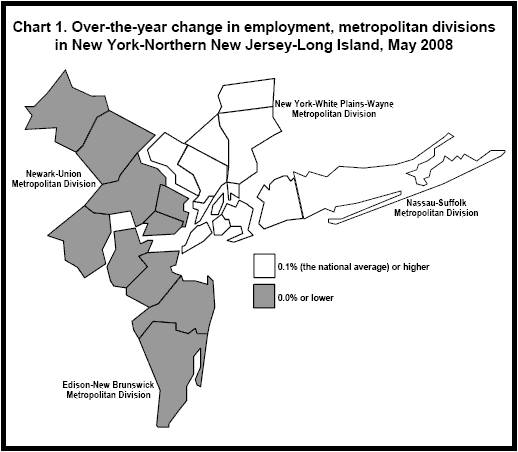
Metropolitan divisions
The New York area contains four metropolitan divisions, essentially
separately identifiable employment centers within a metropolitan area.
Only two divisions added jobs from May 2007 to May 2008. Not
unexpectedly, the New York-White Plains-Wayne Metropolitan Division
experienced the larger employment gain, 40,900, though this was the
smallest increase since June 2004. The Nassau-Suffolk Metropolitan
Division added 5,100 jobs. Employment also grew at a faster pace in New
York-White Plains-Wayne than in Nassau-Suffolk, 0.8 percent versus 0.4
percent; however both divisions exceeded the 0.1-percent increase in jobs
for the nation. (See chart 1.)
In the other two metropolitan divisions, Newark-Union lost 2,700 jobs
after two months of virtually no change. In Edison-New Brunswick,
employment fell by 3,500-the largest 12-month decline since July 2002.
Both areas lost jobs at a 0.3-percent pace over the year.
The New York-White Plains-Wayne Metropolitan Division consists of New
York City and two three-county areas: Putnam-Rockland-Westchester in New
York and Bergen-Hudson-Passaic in New Jersey. Of these three components,
New York City accounted for most of the division's, not to mention the
metropolitan area's, over-the-year increase in employment with the
addition of 36,700 jobs in May. Putnam-Rockland-Westchester gained 3,700
jobs, while Bergen-Hudson-Passaic recorded relatively little change in
employment.
In May 2008, trade, transportation, and utilities had the largest over-
the-year increase in employment, 9,800, in New York City. The next
largest advance, 9,100, occurred in education and health services. In
the New York-White Plains-Wayne Metropolitan Division, however, education
and health services (12,300) led all other supersectors in job gains.
Table A. Nonfarm employment, New York-Northern New Jersey-Long Island, not seasonally adjusted
(Numbers in thousands)
_________________________________________________________________________________________________
| | | | | Change from
Area | 2007 | 2008 | 2008 | 2008 | May 2007
| May | March | April | May p | to May p 2008
___________________________________________|________|________|________|_________|_______________
New York-Northern New Jersey-Long Island 8,607.9 8,540.7 8,586.4 8,647.7 39.8
Edison-New Brunswick 1,049.2 1,025.0 1,034.8 1,045.7 -3.5
Nassau-Suffolk 1,227.6 1,255.9 1,266.0 1,282.7 5.1
New York-White Plains-Wayne 5,238.8 5,234.2 5,253.2 5,279.7 40.9
Bergen-Hudson-Passaic 910.4 902.0 905.9 910.9 0.5
New York City 3,746.4 3,758.0 3,767.9 3,783.1 36.7
Putnam-Rockland-Westchester 582.0 574.2 579.4 585.7 3.7
Newark-Union 1,042.3 1,025.6 1,032.4 1,039.6 -2.7
_________________________________________________________________________________________________
p = preliminary.
NOTE: The Edison Metropolitan Division consists of Middlesex, Monmouth, Ocean, and Somerset
Counties in New Jersey. The Nassau-Suffolk Metropolitan Division consists of Nassau and Suffolk
Counties in New York. The New York-Wayne-White Plains Metropolitan Division consists of New York
City and Westchester, Rockland,and Putnam Counties in New York; and Bergen, Hudson, and Passaic
Counties in New Jersey. The Newark-Union Metropolitan Division consists of Essex, Hunterdon,
Morris, Sussex, and Union Counties in New Jersey; and Pike County in Pennsylvania.
Industry supersectors. In May 2008, the information supersector had
the strongest rates of over-the-year employment growth in both the New
York division, 3.4 percent, and in New York City, 4.2 percent. (See
table 1.) For New York City, this supersector's growth rates for April
(4.3 percent) and May were the two largest percent changes since July and
August of 2001. Three other supersectors in the division recorded
employment growth of 1.7 percent: leisure and hospitality; natural
resources, mining, and construction; and other services. Job growth in
these three supersectors has either slowed or changed little since
January. The slower job growth in the division's leisure and hospitality
supersector was reflected in the dampened job growth in New York City's
restaurants and bars. In May, employment in this industry increade 2.5
percent over the year, while in January the rate of job growth had been
4.5 percent.
Manufacturing was the only supersector in the New York division to
experience a loss in jobs from May a year ago, declining 6.5 percent.
Employment losses were concentrated in New York City (8,400) and Bergen-
Hudson-Passaic (4,700).
In the Nassau-Suffolk Metropolitan Division, employment growth was led
by leisure and hospitality at 2.5 percent, followed by education and
health services at 1.8 percent. Employment in two other supersectors
(government and natural resources, mining, and construction) increased by
1.5 percent. On the other hand, financial activities had the sharpest
rate of job loss, down 3.4 percent, followed by manufacturing, down 2.0
percent from May a year ago.
In the Newark-Union Metropolitan Division, four supersectors had
employment cutbacks of 1,000 or more. Financial activities, down 4.1
percent, recorded the sharpest rate of job loss, while employment in
manufacturing declined by 1.6 percent. Government and trade,
transportation, and utilities both experienced employment retreats of 0.7
percent. On the other hand, employment in education and health services
expanded by 2.5 percent, followed closely by other services at 2.3
percent.
In the Edison-New Brunswick Metropolitan Division, four supersectors
recorded job losses of 1,000 or more. As was the case in Nassau-Suffolk
and Newark, the steepest employment decline occurred in financial
activities, down 3.7 percent over the year, and the second largest
percentage decline was in manufacturing, down 3.0 percent. Employment in
natural resources, mining, and construction and trade, transportation,
and utilities declined by 2.9 percent, and 0.8 percent, respectively.
These losses were, in part, offset by increases in other services (up 2.1
percent), government (up 1.1 percent), and education and health services
(0.9 percent).
Employment in the 12 largest areas
Nine of the nation's 12 largest metropolitan statistical areas
experienced over-the-year job growth equal to or greater than the
national increase of 0.1 percent. The top two high-growth areas recorded
gains greater than 2.0 percent-Houston-Sugar Land-Baytown, Tex., (2.3
percent) and Dallas-Fort Worth-Arlington, Tex. (2.2 percent). Seven
areas had employment growth ranging from 0.9 to 0.1 percent. In Houston,
Dallas, and four other areas adding jobs, the over-the-year rates of
growth were at least 0.5-percentage point lower in May than they had been
in January.
Industry employment in the New York area
In the New York area, employment advanced in all but two industry
supersectors from May 2007 to May 2008, with three adding more than
10,000 jobs. The job count in the education and health services
supersector increased by 21,000 over the year, in line with the increases
recorded since January. Government followed with a gain of 12,100, while
leisure and hospitality added 10,300 jobs, its smallest 12-month gain
since April 2006. Five other supersectors had increases between 7,000
and 2,000. In contrast to these widespread gains, employment losses were
confined to financial activities and manufacturing, which shed 6,900 and
18,700 jobs, respectively, over the year. The loss in financial
activities was the largest since April 2003, with cutbacks particularly
sharp in credit intermediation (or banking), down 6,700 jobs over the
year.
Information, up 6,500, had the fourth largest numeric increase in jobs
in the New York area in May 2008, but the largest over-the-year
percentage gain, 2.2 percent. Other services and leisure and hospitality
had the next highest rates of job growth, 1.7 and 1.6 percent,
respectively. Two additional supersectors-education and health services
and government-had employment growth of 1.4 and 0.9 percent,
respectively.
At the national level, the natural resources and mining supersector,
published separately from construction, recorded the sharpest growth in
employment, up 4.9 percent from May a year ago. Education
and health had the next highest rate of job growth, 3.1 percent,
followed by leisure and hospitality, 1.8 percent. Two other
supersectors, government and other services, had percentage increases of
1.0 and 0.7 percent, respectively.
Five supersectors in the United States lost jobs from May 2007 to May
2008. In construction, employment decreased 5.5 percent, the 14th
consecutive month of over-the-year job losses. The job count in
manufacturing shrank 2.5 percent and in information, jobs were down 1.2
percent. (As previously noted, the information supersector in the New
York area enjoyed particularly strong growth in May, counter to the
decline at the national level.) Nationally, employment also contracted
in financial activities, down 1.1 percent, and in trade, transportation,
and utilities, down 0.6 percent.
Metropolitan divisions
The New York area contains four metropolitan divisions, essentially
separately identifiable employment centers within a metropolitan area.
Only two divisions added jobs from May 2007 to May 2008. Not
unexpectedly, the New York-White Plains-Wayne Metropolitan Division
experienced the larger employment gain, 40,900, though this was the
smallest increase since June 2004. The Nassau-Suffolk Metropolitan
Division added 5,100 jobs. Employment also grew at a faster pace in New
York-White Plains-Wayne than in Nassau-Suffolk, 0.8 percent versus 0.4
percent; however both divisions exceeded the 0.1-percent increase in jobs
for the nation. (See chart 1.)
In the other two metropolitan divisions, Newark-Union lost 2,700 jobs
after two months of virtually no change. In Edison-New Brunswick,
employment fell by 3,500-the largest 12-month decline since July 2002.
Both areas lost jobs at a 0.3-percent pace over the year.
The New York-White Plains-Wayne Metropolitan Division consists of New
York City and two three-county areas: Putnam-Rockland-Westchester in New
York and Bergen-Hudson-Passaic in New Jersey. Of these three components,
New York City accounted for most of the division's, not to mention the
metropolitan area's, over-the-year increase in employment with the
addition of 36,700 jobs in May. Putnam-Rockland-Westchester gained 3,700
jobs, while Bergen-Hudson-Passaic recorded relatively little change in
employment.
In May 2008, trade, transportation, and utilities had the largest over-
the-year increase in employment, 9,800, in New York City. The next
largest advance, 9,100, occurred in education and health services. In
the New York-White Plains-Wayne Metropolitan Division, however, education
and health services (12,300) led all other supersectors in job gains.
Table A. Nonfarm employment, New York-Northern New Jersey-Long Island, not seasonally adjusted
(Numbers in thousands)
_________________________________________________________________________________________________
| | | | | Change from
Area | 2007 | 2008 | 2008 | 2008 | May 2007
| May | March | April | May p | to May p 2008
___________________________________________|________|________|________|_________|_______________
New York-Northern New Jersey-Long Island 8,607.9 8,540.7 8,586.4 8,647.7 39.8
Edison-New Brunswick 1,049.2 1,025.0 1,034.8 1,045.7 -3.5
Nassau-Suffolk 1,227.6 1,255.9 1,266.0 1,282.7 5.1
New York-White Plains-Wayne 5,238.8 5,234.2 5,253.2 5,279.7 40.9
Bergen-Hudson-Passaic 910.4 902.0 905.9 910.9 0.5
New York City 3,746.4 3,758.0 3,767.9 3,783.1 36.7
Putnam-Rockland-Westchester 582.0 574.2 579.4 585.7 3.7
Newark-Union 1,042.3 1,025.6 1,032.4 1,039.6 -2.7
_________________________________________________________________________________________________
p = preliminary.
NOTE: The Edison Metropolitan Division consists of Middlesex, Monmouth, Ocean, and Somerset
Counties in New Jersey. The Nassau-Suffolk Metropolitan Division consists of Nassau and Suffolk
Counties in New York. The New York-Wayne-White Plains Metropolitan Division consists of New York
City and Westchester, Rockland,and Putnam Counties in New York; and Bergen, Hudson, and Passaic
Counties in New Jersey. The Newark-Union Metropolitan Division consists of Essex, Hunterdon,
Morris, Sussex, and Union Counties in New Jersey; and Pike County in Pennsylvania.
Industry supersectors. In May 2008, the information supersector had
the strongest rates of over-the-year employment growth in both the New
York division, 3.4 percent, and in New York City, 4.2 percent. (See
table 1.) For New York City, this supersector's growth rates for April
(4.3 percent) and May were the two largest percent changes since July and
August of 2001. Three other supersectors in the division recorded
employment growth of 1.7 percent: leisure and hospitality; natural
resources, mining, and construction; and other services. Job growth in
these three supersectors has either slowed or changed little since
January. The slower job growth in the division's leisure and hospitality
supersector was reflected in the dampened job growth in New York City's
restaurants and bars. In May, employment in this industry increade 2.5
percent over the year, while in January the rate of job growth had been
4.5 percent.
Manufacturing was the only supersector in the New York division to
experience a loss in jobs from May a year ago, declining 6.5 percent.
Employment losses were concentrated in New York City (8,400) and Bergen-
Hudson-Passaic (4,700).
In the Nassau-Suffolk Metropolitan Division, employment growth was led
by leisure and hospitality at 2.5 percent, followed by education and
health services at 1.8 percent. Employment in two other supersectors
(government and natural resources, mining, and construction) increased by
1.5 percent. On the other hand, financial activities had the sharpest
rate of job loss, down 3.4 percent, followed by manufacturing, down 2.0
percent from May a year ago.
In the Newark-Union Metropolitan Division, four supersectors had
employment cutbacks of 1,000 or more. Financial activities, down 4.1
percent, recorded the sharpest rate of job loss, while employment in
manufacturing declined by 1.6 percent. Government and trade,
transportation, and utilities both experienced employment retreats of 0.7
percent. On the other hand, employment in education and health services
expanded by 2.5 percent, followed closely by other services at 2.3
percent.
In the Edison-New Brunswick Metropolitan Division, four supersectors
recorded job losses of 1,000 or more. As was the case in Nassau-Suffolk
and Newark, the steepest employment decline occurred in financial
activities, down 3.7 percent over the year, and the second largest
percentage decline was in manufacturing, down 3.0 percent. Employment in
natural resources, mining, and construction and trade, transportation,
and utilities declined by 2.9 percent, and 0.8 percent, respectively.
These losses were, in part, offset by increases in other services (up 2.1
percent), government (up 1.1 percent), and education and health services
(0.9 percent).
Employment in the 12 largest areas
Nine of the nation's 12 largest metropolitan statistical areas
experienced over-the-year job growth equal to or greater than the
national increase of 0.1 percent. The top two high-growth areas recorded
gains greater than 2.0 percent-Houston-Sugar Land-Baytown, Tex., (2.3
percent) and Dallas-Fort Worth-Arlington, Tex. (2.2 percent). Seven
areas had employment growth ranging from 0.9 to 0.1 percent. In Houston,
Dallas, and four other areas adding jobs, the over-the-year rates of
growth were at least 0.5-percentage point lower in May than they had been
in January.
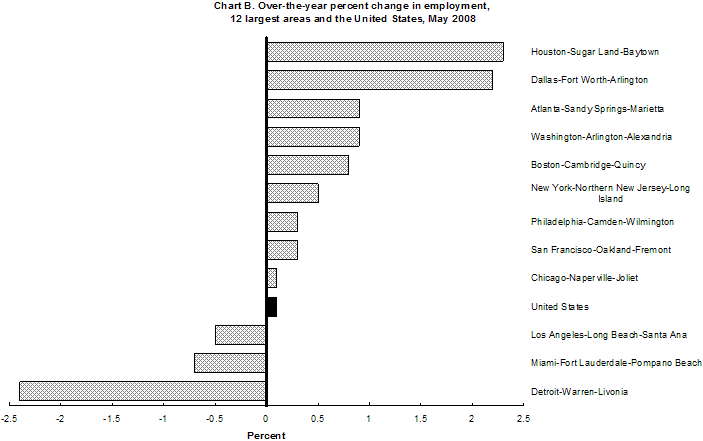
Three areas continued to lose employment over the year. Detroit-
Warren-Livonia, Mich., had the sharpest decline (down 2.4 percent).
Miami-Fort Lauderdale-Pompano Beach, Fla., and Los Angeles-Long Beach-
Santa Ana, Calif., recorded smaller contractions of 0.7 and 0.5 percent,
respectively. (See chart B and table 2.)
Of the 12 metropolitan areas, Dallas had the largest increase in jobs
from May a year ago, 66,100, with Houston following at 58,300. New York
added 39,800 jobs. No other area had an employment increase over 30,000.
By contrast, three areas continued to shed jobs with Miami losing 16,500,
Los Angeles 27,800 and Detroit shedding 47,400 jobs.
NYLS -7337 Labor - New York
06/26/08
_________________________________
1The New York-Northern New Jersey-Long Island, NY-NJ-PA Metropolitan
Statistical Area (MSA) consists of New York City, Nassau, Putnam,
Rockland, Suffolk, and Westchester Counties in New York; Bergen, Essex,
Hudson, Hunterdon, Middlesex, Monmouth, Morris, Ocean, Passaic, Somerset,
Sussex, and Union Counties in New Jersey; and Pike County, Pennsylvania.
For convenience, the New York-Northern New Jersey-Long Island MSA is
referred to as the New York area throughout this release.
Technical Note
This release presents nonfarm payroll employment estimates from the
Current Employment Statistics (CES) program for the New York-Northern New
Jersey-Long Island Metropolitan Statistical Area and the 12 largest
metropolitan areas. The rankings were based on population estimates by
the U.S. Census Bureau in 2007. The CES program is a Federal-State
cooperative endeavor.
Employment
Definitions. Employment data refer to persons on establishment
payrolls who receive pay for any part of the pay period that includes the
12th of the month. Persons are counted at their place of work rather
than at their place of residence; those appearing on more than one
payroll are counted on each payroll. Industries are classified on the
basis of their principal activity in accordance with the 2007 version of
the North American Industry Classification System.
Method of estimation. The employment data are estimated using a "link
relative" technique in which a ratio (link relative) of current-month
employment to that of the previous month is computed from a sample of
establishments reporting for both months. The estimates of employment
for the current month are obtained by multiplying the estimates for the
previous month by these ratios. Small-domain models are used as the
official estimators for the approximately 39 percent of CES published
series which have insufficient sample for direct sample-based estimates.
Annual revisions. Employment estimates are adjusted annually to a
complete count of jobs, called benchmarks, derived principally from tax
reports that are submitted by employers who are covered under state
unemployment insurance (UI) laws. The benchmark information is used to
adjust the monthly estimates between the new benchmark and the preceding
one and also to establish the level of employment for the new benchmark
month. Thus, the benchmarking process establishes the level of
employment, and the sample is used to measure the month-to-month changes
in the level for the subsequent months.
Reliability of the estimates
The estimates presented in this release are based on sample survey,
administrative data, and modeling and, thus, are subject to sampling and
other types of errors. Sampling error is a measure of sampling
variability-that is, variation that occurs by chance because a sample
rather than the entire population is surveyed. Survey data also are
subject to nonsampling errors, such as those which can be introduced into
the data collection and processing operations. Estimates not directly
derived from sample surveys are subject to additional errors resulting
from the specific estimation processes used. The sums of individual items
may not always equal the totals shown in the same tables because of
rounding.
Employment estimates. Measures of sampling error are available for
state CES data at the total nonfarm and supersector level and for
metropolitan area CES data. Information on recent benchmark revisions
for states is available on the BLS Web site at http://www.bls.gov/sae/.
Area definitions. The substate area data published in this release
reflect the standards and definitions established by the U.S. Office of
Management and Budget on November 20, 2007. A detailed list of the
geographic definitions is available at
http://www.whitehouse.gov/omb/bulletins/fy2008/b08-01.pdf.
Additional information
More complete information on the technical procedures used to develop
these estimates and additional data appear in Employment and Earnings
Online.
Information in this release will be made available to sensory impaired
individuals upon request. Voice phone: (202) 691-5200; TDD message
referral phone: 1-800-877-8339.
Table 1. Employees on nonfarm payrolls by industry supersector, New York-Northern New Jersey-
Long Island and United States, not seasonally adjusted
(Numbers in thousands)
Change from
May 2007 to
2007 2008 2008 2008 May p 2008
Area and industry supersector May March April May p Number Percent
United States
Total nonfarm 138,289.0 137,033.0 137,745.0 138,393.0 104.0 0.1
Natural resources and mining 720.0 738.0 743.0 755.0 35.0 4.9
Construction 7,725.0 6,998.0 7,122.0 7,297.0 -428.0 -5.5
Manufacturing 13,903.0 13,576.0 13,547.0 13,559.0 -344.0 -2.5
Trade, transportation, and utilities 26,559.0 26,265.0 26,285.0 26,403.0 -156.0 -0.6
Information 3,044.0 3,008.0 3,003.0 3,008.0 -36.0 -1.2
Financial activities 8,318.0 8,194.0 8,207.0 8,229.0 -89.0 -1.1
Professional and business services 17,937.0 17,796.0 18,002.0 17,978.0 41.0 0.2
Education and health services 18,331.0 18,850.0 18,931.0 18,897.0 566.0 3.1
Leisure and hospitality 13,655.0 13,307.0 13,575.0 13,903.0 248.0 1.8
Other services 5,520.0 5,509.0 5,532.0 5,558.0 38.0 0.7
Government 22,577.0 22,792.0 22,798.0 22,806.0 229.0 1.0
New York-Northern New Jersey-Long Island Metropolitan Statistical Area
Total nonfarm 8,607.9 8,540.7 8,586.4 8,647.7 39.8 0.5
Natural resources, mining, and
construction 366.3 344.9 357.5 368.6 2.3 0.6
Manufacturing 453.8 437.1 435.0 435.1 -18.7 -4.1
Trade, transportation, and utilities 1,611.2 1,601.0 1,602.7 1,614.5 3.3 0.2
Information 289.1 292.3 293.9 295.6 6.5 2.2
Financial activities 794.4 790.0 788.2 787.5 -6.9 -0.9
Professional and business services 1,300.2 1,286.3 1,298.5 1,303.7 3.5 0.3
Education and health services 1,452.1 1,469.2 1,471.2 1,473.1 21.0 1.4
Leisure and hospitality 662.4 632.2 649.4 672.7 10.3 1.6
Other services 371.4 373.0 374.0 377.8 6.4 1.7
Government 1,307.0 1,314.7 1,316.0 1,319.1 12.1 0.9
Edison-New Brunswick Metropolitan Division
Total nonfarm 1,049.2 1,025.0 1,034.8 1,045.7 -3.5 -0.3
Natural resources, mining, and
construction 48.9 43.8 46.2 47.5 -1.4 -2.9
Manufacturing 74.5 72.3 72.2 72.3 -2.2 -3.0
Trade, transportation, and utilities 229.7 223.9 225.1 227.9 -1.8 -0.8
Information 30.3 29.8 29.6 29.7 -0.6 -2.0
Financial activities 63.0 60.4 60.5 60.7 -2.3 -3.7
Professional and business services 179.8 176.0 179.4 180.7 0.9 0.5
Education and health services 139.2 139.7 139.8 140.4 1.2 0.9
Leisure and hospitality 84.6 76.0 80.0 84.7 0.1 0.1
Other services 47.1 48.1 47.8 48.1 1.0 2.1
Government 152.1 155.0 154.2 153.7 1.6 1.1
Nassau-Suffolk Metropolitan Division
Total nonfarm 1,277.6 1,255.9 1,266.0 1,282.7 5.1 0.4
Natural resources, mining, and
construction 72.9 69.7 70.7 74.0 1.1 1.5
Manufacturing 84.1 82.4 81.7 82.4 -1.7 -2.0
Trade, transportation, and utilities 272.9 268.7 269.4 272.1 -0.8 -0.3
Information 28.5 28.1 28.2 28.2 -0.3 -1.1
Financial activities 80.2 77.0 77.2 77.5 -2.7 -3.4
Professional and business services 165.8 158.9 162.9 165.3 -0.5 -0.3
Education and health services 212.4 216.6 216.8 216.3 3.9 1.8
Leisure and hospitality 100.9 94.0 97.4 103.4 2.5 2.5
Other services 53.3 53.0 53.2 53.7 0.4 0.8
Government 206.6 207.5 208.5 209.8 3.2 1.5
New York-White Plains-Wayne Metropolitan Division
Total nonfarm 5,238.8 5,234.2 5,253.2 5,279.7 40.9 0.8
Natural resources, mining, and
construction 199.0 190.6 197.3 202.3 3.3 1.7
Manufacturing 207.1 195.1 194.0 193.7 -13.4 -6.5
Trade, transportation, and utilities 893.4 895.6 896.2 900.9 7.5 0.8
Information 206.1 210.0 211.7 213.2 7.1 3.4
Financial activities 575.0 579.5 577.6 576.2 1.2 0.2
Professional and business services 793.5 793.9 796.4 797.2 3.7 0.5
Education and health services 954.9 964.7 966.1 967.2 12.3 1.3
Leisure and hospitality 407.0 396.3 404.1 413.9 6.9 1.7
Other services 223.5 223.6 224.8 227.4 3.9 1.7
Government 779.3 784.9 785.0 787.7 8.4 1.1
New York City
Total nonfarm 3,746.4 3,758.0 3,767.9 3,783.1 36.7 1.0
Natural resources, mining, and
construction 127.7 123.3 127.1 130.1 2.4 1.9
Manufacturing 102.5 94.7 94.5 94.1 -8.4 -8.2
Trade, transportation, and utilities 567.6 574.2 575.1 577.4 9.8 1.7
Information 165.4 169.0 170.8 172.4 7.0 4.2
Financial activities 463.3 469.2 467.1 465.8 2.5 0.5
Professional and business services 587.3 590.1 589.6 589.7 2.4 0.4
Education and health services 712.2 719.6 720.6 721.3 9.1 1.3
Leisure and hospitality 302.2 296.4 301.5 307.5 5.3 1.8
Other services 159.7 159.2 159.2 160.9 1.2 0.8
Government 558.5 562.3 562.4 563.9 5.4 1.0
Newark-Union Metropolitan Division
Total nonfarm 1,042.3 1,025.6 1,032.4 1,039.6 -2.7 -0.3
Natural resources, mining, and
construction 45.5 40.8 43.3 44.8 -0.7 -1.5
Manufacturing 88.1 87.3 87.1 86.7 -1.4 -1.6
Trade, transportation, and utilities 215.2 212.8 212.0 213.6 -1.6 -0.7
Information 24.2 24.4 24.4 24.5 0.3 1.2
Financial activities 76.2 73.1 72.9 73.1 -3.1 -4.1
Professional and business services 161.1 157.5 159.8 160.5 -0.6 -0.4
Education and health services 145.6 148.2 148.5 149.2 3.6 2.5
Leisure and hospitality 69.9 65.9 67.9 70.7 0.8 1.1
Other services 47.5 48.3 48.2 48.6 1.1 2.3
Government 169.0 167.3 168.3 167.9 -1.1 -0.7
_______________________________________________________________________________________________
p =preliminary.
NOTE: Data are counts of jobs by place of work. Estimates are currently projected from March
2007 benchmark levels. Estimates subsequent to the current benchmark month are provisional and
will be revised when new information becomes available.
Table 2. Employees on nonfarm payrolls by industry supersector, 12 largest metropolitan
statistical areas, not seasonally adjusted
(Numbers in thousands)
Change from
May 2007 to
2007 2008 2008 2008 May p 2008
Area and industry supersector May March April May p Number Percent
Atlanta-Sandy Springs-Marietta, GA
Total nonfarm 2,455.8 2,471.0 2,472.9 2,478.7 22.9 0.9
Natural resources and mining 2.5 2.4 2.5 2.5 0.0 0.0
Construction 139.9 137.6 138.2 139.7 -0.2 -0.1
Manufacturing 176.2 174.6 173.6 172.8 -3.4 -1.9
Trade, transportation, and utilities 561.3 562.7 563.0 565.0 3.7 0.7
Information 87.8 88.2 88.5 88.7 0.9 1.0
Financial activities 163.2 160.7 160.5 161.1 -2.1 -1.3
Professional and business services 405.3 412.1 410.0 408.7 3.4 0.8
Education and health services 251.5 258.2 259.6 260.7 9.2 3.7
Leisure and hospitality 239.8 236.7 240.4 243.8 4.0 1.7
Other services 98.8 97.9 98.4 99.3 0.5 0.5
Government 329.5 339.9 338.2 336.4 6.9 2.1
Boston-Cambridge-Quincy, MA-NH
Total nonfarm 2,493.4 2,471.0 2,497.7 2,513.1 19.7 0.8
Natural resources and mining 1.1 1.0 1.1 1.2 0.1 9.1
Construction 100.7 89.2 94.8 98.8 -1.9 -1.9
Manufacturing 222.2 219.9 219.9 219.8 -2.4 -1.1
Trade, transportation, and utilities 417.6 411.6 412.7 416.5 -1.1 -0.3
Information 74.4 75.1 75.0 74.8 0.4 0.5
Financial activities 189.1 187.5 187.5 187.7 -1.4 -0.7
Professional and business services 409.5 405.6 413.6 416.9 7.4 1.8
Education and health services 464.5 477.7 482.0 475.7 11.2 2.4
Leisure and hospitality 219.2 208.0 215.2 223.5 4.3 2.0
Other services 88.8 87.2 87.3 88.2 -0.6 -0.7
Government 306.3 308.2 308.6 310.0 3.7 1.2
Chicago-Naperville-Joliet, IL-IN-WI
Total nonfarm 4,580.2 4,505.8 4,545.2 4,585.1 4.9 0.1
Natural resources and mining 2.5 2.2 2.3 2.4 -0.1 -4.0
Construction 220.8 195.3 205.8 213.4 -7.4 -3.4
Manufacturing 483.7 479.6 478.9 478.7 -5.0 -1.0
Trade, transportation, and utilities 926.6 925.5 926.8 935.2 8.6 0.9
Information 90.8 91.3 91.2 91.2 0.4 0.4
Financial activities 330.6 325.4 325.0 324.8 -5.8 -1.8
Professional and business services 746.0 724.8 740.9 749.1 3.1 0.4
Education and health services 591.8 599.3 601.1 601.7 9.9 1.7
Leisure and hospitality 415.6 390.1 402.0 413.8 -1.8 -0.4
Other services 198.1 197.1 196.9 197.2 -0.9 -0.5
Government 573.1 575.2 574.3 577.6 4.5 0.8
Dallas-Fort Worth-Arlington, TX
Total nonfarm 2,942.8 2,975.8 2,996.3 3,008.9 66.1 2.2
Natural resources, mining, and
construction 186.3 192.8 193.8 196.1 9.8 5.3
Manufacturing 297.7 294.7 294.8 296.1 -1.6 -0.5
Trade, transportation, and utilities 619.4 625.8 626.6 629.0 9.6 1.5
Information 88.7 91.0 89.9 89.4 0.7 0.8
Financial activities 233.0 234.5 236.4 237.1 4.1 1.8
Professional and business services 437.7 437.3 445.1 446.5 8.8 2.0
Education and health services 315.9 328.9 329.6 330.5 14.6 4.6
Leisure and hospitality 283.6 280.5 288.1 291.2 7.6 2.7
Other services 106.9 108.3 109.0 109.4 2.5 2.3
Government 373.6 382.0 383.0 383.6 10.0 2.7
Detroit-Warren-Livonia, MI
Total nonfarm 1,995.1 1,909.1 1,919.3 1,947.7 -47.4 -2.4
Natural resources, mining, and
construction 72.9 58.4 61.0 65.7 -7.2 -9.9
Manufacturing 262.9 238.7 232.9 239.2 -23.7 -9.0
Trade, transportation, and utilities 367.1 358.7 359.7 362.8 -4.3 -1.2
Information 34.4 33.3 33.0 33.0 -1.4 -4.1
Financial activities 112.5 109.6 109.7 110.0 -2.5 -2.2
Professional and business services 352.0 337.0 342.3 348.6 -3.4 -1.0
Education and health services 279.0 283.6 284.1 285.0 6.0 2.2
Leisure and hospitality 189.5 174.1 179.7 186.5 -3.0 -1.6
Other services 89.2 85.3 85.9 86.4 -2.8 -3.1
Government 235.6 230.4 231.0 230.5 -5.1 -2.2
Houston-Sugar Land-Baytown, TX
Total nonfarm 2,547.4 2,595.0 2,597.3 2,605.7 58.3 2.3
Natural resources and mining 84.0 87.9 88.4 89.2 5.2 6.2
Construction 196.4 202.2 201.9 202.0 5.6 2.9
Manufacturing 232.1 235.1 236.0 235.7 3.6 1.6
Trade, transportation, and utilities 513.9 522.2 524.5 525.2 11.3 2.2
Information 37.0 36.8 36.9 36.9 -0.1 -0.3
Financial activities 144.2 145.7 145.8 146.0 1.8 1.2
Professional and business services 377.8 388.7 386.9 388.3 10.5 2.8
Education and health services 281.2 290.9 289.8 291.5 10.3 3.7
Leisure and hospitality 230.8 230.8 232.4 235.6 4.8 2.1
Other services 93.2 95.1 95.8 96.0 2.8 3.0
Government 356.8 359.6 358.9 359.3 2.5 0.7
Los Angeles-Long Beach-Santa Ana, CA
Total nonfarm 5,641.5 5,608.1 5,607.2 5,613.7 -27.8 -0.5
Natural resources and mining 5.0 5.1 5.0 5.1 0.1 2.0
Construction 262.2 246.1 246.1 246.6 -15.6 -5.9
Manufacturing 630.2 622.7 620.8 619.8 -10.4 -1.7
Trade, transportation, and utilities 1,086.8 1,080.9 1,079.1 1,082.9 -3.9 -0.4
Information 241.9 234.6 230.9 233.4 -8.5 -3.5
Financial activities 377.3 356.0 355.6 354.3 -23.0 -6.1
Professional and business services 874.5 877.3 876.6 874.3 -0.2 0.0
Education and health services 631.3 646.7 649.5 647.0 15.7 2.5
Leisure and hospitality 572.9 568.4 573.3 576.5 3.6 0.6
Other services 195.1 196.9 197.1 198.2 3.1 1.6
Government 764.3 773.4 773.2 775.6 11.3 1.5
Miami-Fort Lauderdale-Pompano Beach, FL
Total nonfarm 2,447.4 2,440.6 2,432.0 2,430.9 -16.5 -0.7
Natural resources and mining 0.7 0.7 0.7 0.7 0.0 0.0
Construction 158.5 144.0 142.3 143.4 -15.1 -9.5
Manufacturing 99.0 94.7 93.8 93.5 -5.5 -5.6
Trade, transportation, and utilities 547.0 546.4 544.7 541.8 -5.2 -1.0
Information 52.4 51.7 51.1 51.2 -1.2 -2.3
Financial activities 180.4 176.0 175.5 175.5 -4.9 -2.7
Professional and business services 400.2 396.7 393.3 393.0 -7.2 -1.8
Education and health services 318.1 326.5 328.8 330.0 11.9 3.7
Leisure and hospitality 260.1 266.8 264.2 263.9 3.8 1.5
Other services 101.2 103.1 102.5 102.7 1.5 1.5
Government 329.8 334.0 335.1 335.2 5.4 1.6
New York-Northern New Jersey-Long Island, NY-NJ-PA
Total nonfarm 8,607.9 8,540.7 8,586.4 8,647.7 39.8 0.5
Natural resources, mining, and
construction 366.3 344.9 357.5 368.6 2.3 0.6
Manufacturing 453.8 437.1 435.0 435.1 -18.7 -4.1
Trade, transportation, and utilities 1,611.2 1,601.0 1,602.7 1,614.5 3.3 0.2
Information 289.1 292.3 293.9 295.6 6.5 2.2
Financial activities 794.4 790.0 788.2 787.5 -6.9 -0.9
Professional and business services 1,300.2 1,286.3 1,298.5 1,303.7 3.5 0.3
Education and health services 1,452.1 1,469.2 1,471.2 1,473.1 21.0 1.4
Leisure and hospitality 662.4 632.2 649.4 672.7 10.3 1.6
Other services 371.4 373.0 374.0 377.8 6.4 1.7
Government 1,307.0 1,314.7 1,316.0 1,319.1 12.1 0.9
Philadelphia-Camden-Wilmington, PA-NJ-DE-MD
Total nonfarm 2,826.9 2,803.5 2,823.9 2,835.2 8.3 0.3
Natural resources, mining, and
construction 129.1 121.5 123.8 126.6 -2.5 -1.9
Manufacturing 221.2 217.1 216.5 215.9 -5.3 -2.4
Trade, transportation, and utilities 529.7 525.5 526.4 530.2 0.5 0.1
Information 57.2 57.3 57.4 57.4 0.2 0.3
Financial activities 219.8 217.0 216.4 216.9 -2.9 -1.3
Professional and business services 432.5 426.9 433.3 434.6 2.1 0.5
Education and health services 525.8 536.1 539.4 536.6 10.8 2.1
Leisure and hospitality 228.4 216.9 223.8 230.9 2.5 1.1
Other services 124.0 124.0 124.4 124.8 0.8 0.6
Government 359.2 361.2 362.5 361.3 2.1 0.6
San Francisco-Oakland-Fremont, CA
Total nonfarm 2,034.8 2,035.6 2,036.3 2,040.6 5.8 0.3
Natural resources and mining 1.4 1.6 1.6 1.6 0.2 14.3
Construction 116.1 112.7 112.9 113.7 -2.4 -2.1
Manufacturing 137.5 137.0 136.4 136.4 -1.1 -0.8
Trade, transportation, and utilities 357.5 354.9 353.3 353.8 -3.7 -1.0
Information 68.6 68.3 68.0 68.0 -0.6 -0.9
Financial activities 152.9 147.9 147.5 147.4 -5.5 -3.6
Professional and business services 352.9 359.8 360.9 359.6 6.7 1.9
Education and health services 231.7 234.5 233.9 234.1 2.4 1.0
Leisure and hospitality 213.6 211.9 213.6 216.8 3.2 1.5
Other services 75.0 75.5 75.6 75.9 0.9 1.2
Government 327.6 331.5 332.6 333.3 5.7 1.7
Washington-Arlington-Alexandria, DC-VA-MD-WV
Total nonfarm 2,998.9 2,994.9 3,007.7 3,025.4 26.5 0.9
Natural resources, mining, and
construction 187.1 177.3 179.9 181.9 -5.2 -2.8
Manufacturing 62.3 61.4 61.0 60.9 -1.4 -2.2
Trade, transportation, and utilities 403.0 399.6 401.0 404.1 1.1 0.3
Information 93.8 92.0 91.4 91.6 -2.2 -2.3
Financial activities 160.1 156.2 155.7 156.1 -4.0 -2.5
Professional and business services 677.8 681.8 685.8 689.2 11.4 1.7
Education and health services 328.0 339.3 339.8 336.4 8.4 2.6
Leisure and hospitality 256.6 247.3 251.4 257.8 1.2 0.5
Other services 180.7 183.4 184.7 185.7 5.0 2.8
Government 649.5 656.6 657.0 661.7 12.2 1.9
_______________________________________________________________________________________________
p =preliminary.
NOTE: Data are counts of jobs by place of work. Estimates are currently projected from March
2007 benchmark levels. Estimates subsequent to the current benchmark month are provisional and
will be revised when new information becomes available.
Last Modified Date: June 30, 2008