NCDC / Climate Monitoring / Climate of 2006 / 2006 Tornadoes / Help NCDC / Climate Monitoring / Climate of 2006 / 2006 Tornadoes / Help

|
2006 Significant Tornado Outbreaks
National Climatic Data Center,
Last updated - 18 April 2006
|

|

 Overview Overview
Spring in the southern Plains and Tennessee and Ohio Valleys was punctuated by several severe weather outbreaks producing approximately 500 tornadoes and leading to nearly 50 deaths during March and April 2006. Tornadoes can occur at any time of the year in the U.S., but there is typically a spring and summer peak (March-August) when severe weather is most likely.
In 2006, the season began relatively early with significant outbreaks of tornadoes on March 12th, March 30th, April 2nd, April 7th, April 13th and April 16th, with the most notable on March 12th, April 2nd and April 7th. Although this page will not summarize all severe weather outbreaks, the most significant are described. Below is a synopsis of the conditions that produced these outbreaks, as well as a preliminary description of the major impacts and tornado climatology. Some information on the individual outbreaks will be provided as well as an overall description of the tornado season to date.
|
|
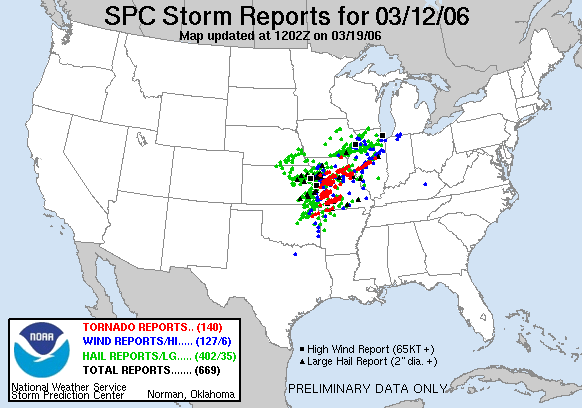
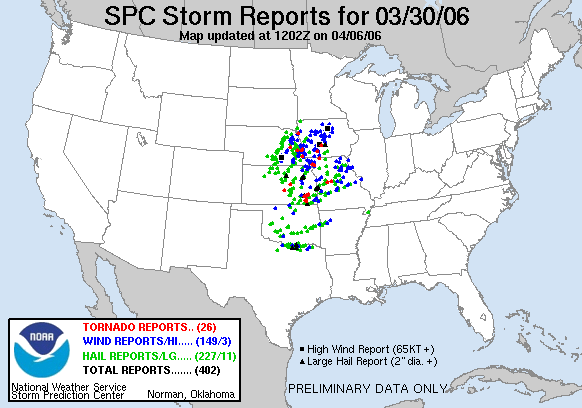
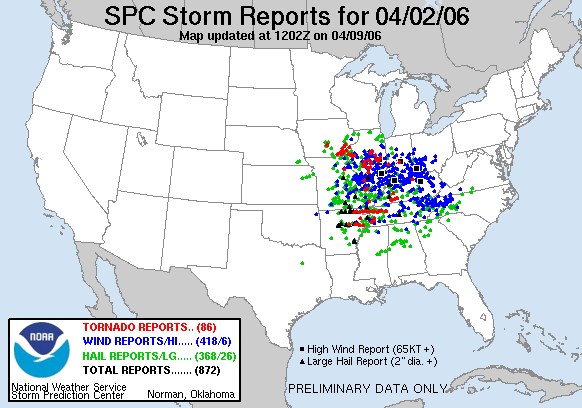
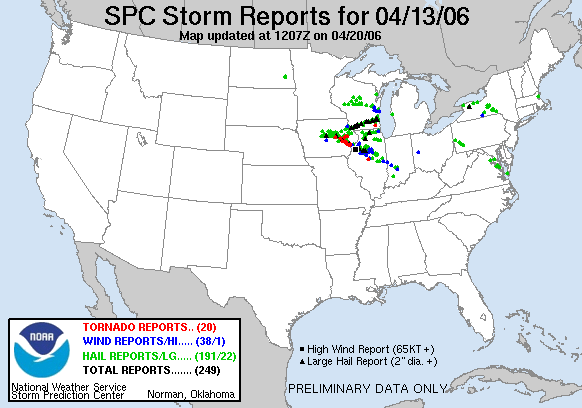
Table of notable storm outbreaks and graphics illustrating tornado locations
|
Meteorology
|
|
As with most severe weather outbreaks, the most notable tornado events of the season were initiated by a juxtaposition of cool 'Arctic' air from northern North America and warm moist air from the southern Plains and Gulf of Mexico. A cold front delineates the boundary between the two air masses (with the colder air behind the cold front, wedging under the warm air and creating lift) and supercell thunderstorms are generated from the instability and rotational wind shear somewhat ahead of the cold front. As can be seen in the images above, the majority of the April 7th tornadoes occurred in the Missouri/Tennessee area, in the warm air ahead of the cold front.
|
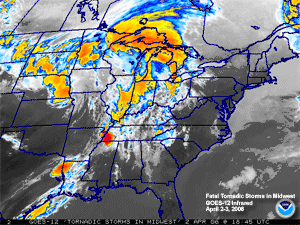
Satellite image from April 2nd/3rd
Click for larger animation
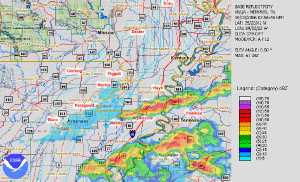
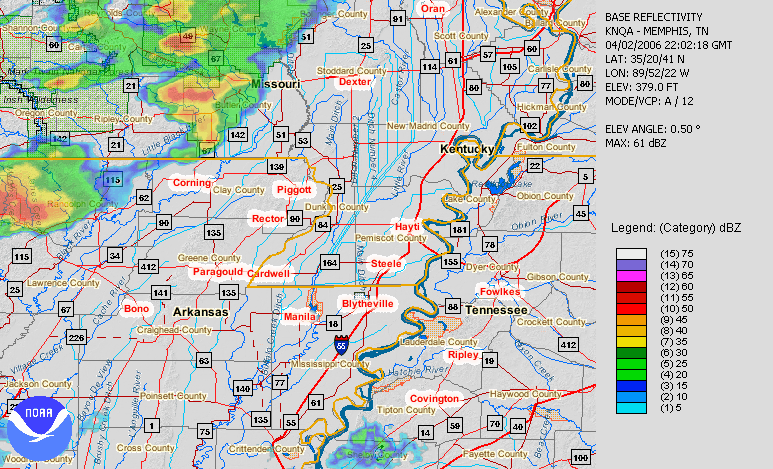
Radar image for April 2nd/3rd
Click for animation
|
The two images to the left show the clouds and rain associated with the April 2nd/3rd outbreak. The top image is an infrared satellite animation from the NOAA GOES-12 satellite showing progression of the deadly storms across the Midwest. The brightest red in the image indicates the most intense storm clouds and corresponds to the area of greatest tornado activity in eastern Missouri, western Tennessee and up through Illinois.
The bottom image shows estimated precipitation as indicated by doppler radar based in Memphis, TN. The storms cells embedded in the system can be seen moving over Missouri and Tennessee in the animation (click image for animation). As the largest cell crossed Pemiscot County, Missouri (visible in the bottom image), tornadoes were produced destroying over 20 homes in the county and damaging over 100 more (Southeast Missourian).
|
|
Although it is virtually impossible to project precisely where and when a tornado will occur, there are common radar signatures that are indicative of possible tornado activity. A 'hook' feature in a radar image (as indicated in the 3-dimensional image to the right) is suggestive of rotation and a likely tornado on the ground. Indeed the storm cell pictured to the right produced a deadly tornado in the vicinity of Gallatin, TN on April 7th. The animated image (click to animate) shows the 3-dimensional structure of the radar signature approximately 10 minutes before the fatal touchdown.
|
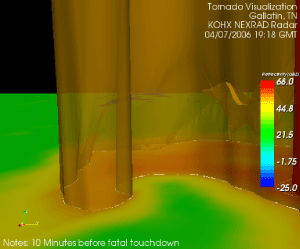
Click for animation: Warning - 80 Meg
Download Quicktime to view (free)
|
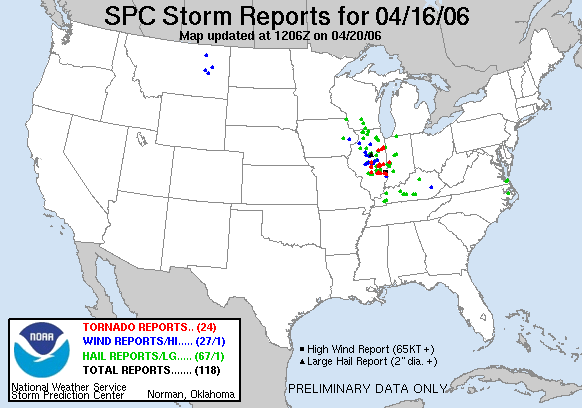
|
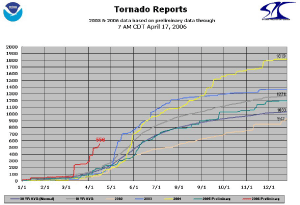
As of April 18th, preliminary estimates from NOAA's Storm Prediction Center, (see image to right) suggest that over 500 tornadoes resulted from the severe weather episodes. The 30-year average number of tornadoes by this date is 150-200, though this number is difficult to determine because of changes in observation practices and recent increases in the detail and availability of reports. A table showing the number of preliminary tornadoes, deaths and killer tornadoes in 2006 compared to the previous 3 years is also available. This indicates that April was at least twice as active as recent years, while March was three-to-four times as active.
|
Click for image
|
|
The two images above, from NOAA's Storm Prediction Center, show the concentration of April (left) and May (right) tornadoes over the 1950-2002 period. The number of tornadoes typically increases in May, and the geographic focus expands from the southern Plains to the southern and central Plains states. While the average number of tornadoes during these months is higher in the Plains, it is evident that tornadoes can happen almost anywhere in the country, but especially east of the Rockies.
|
|
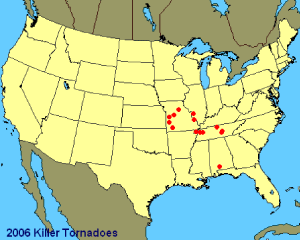
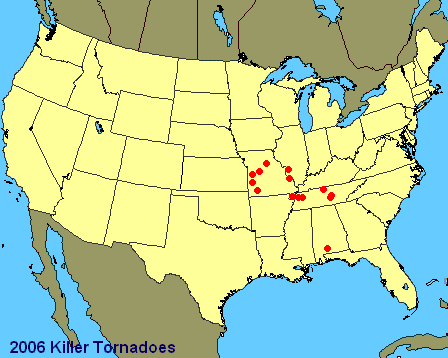
Nearly 50 people were killed across the central US in the March and April storms, many of them in Tennessee from the 2 most severe outbreaks (April 2nd and 7th). Most people were killed from falling debris associated with damage to houses and buildings from straight line winds and tornadoes. During the last 3 years, only 45 people have been killed on average per year, making 2006 an unusually deadly season so far.
|
Larger image
|
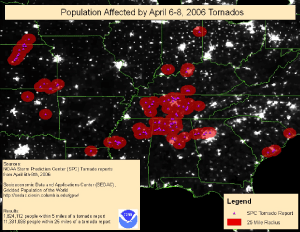
Larger image
|
Nearly 2 million people were within 5 miles of a tornado report during the April 7th outbreak, with the largest density of affected population in the Nashville, TN and Atlanta, GA areas. Over 11 million people were within 25 miles of a tornado report and were therefore affected by severe weather and likely tornado watches and warnings. A preliminary list of tornado reports from the two main outbreaks (April 2nd and April 7th) are available.
|
Useful Links
Questions?
|
For all climate questions other than questions concerning this report, please contact the National Climatic Data Center's Climate Services Division:
|
Climate Services Division
NOAA/National Climatic Data Center
151 Patton Avenue
Asheville, NC 28801-5001
fax: 828-271-4876
phone: 828-271-4800
email: questions@ncdc.noaa.gov
|
For further information on the historical climate perspective presented in this report, contact:
|
Jay Lawrimore
NOAA/National Climatic Data Center
151 Patton Avenue
Asheville, NC 28801-5001
fax: 828-271-4750
email: Jay.Lawrimore@noaa.gov
|
NCDC / Climate Monitoring / Climate of 2006 / 2006 tornadoes / Search / Help
|


