

National Climatic Data Center
Asheville, North Carolina
Updated 9 July 2008
Note: Data in this report are compiled from preliminary statistics
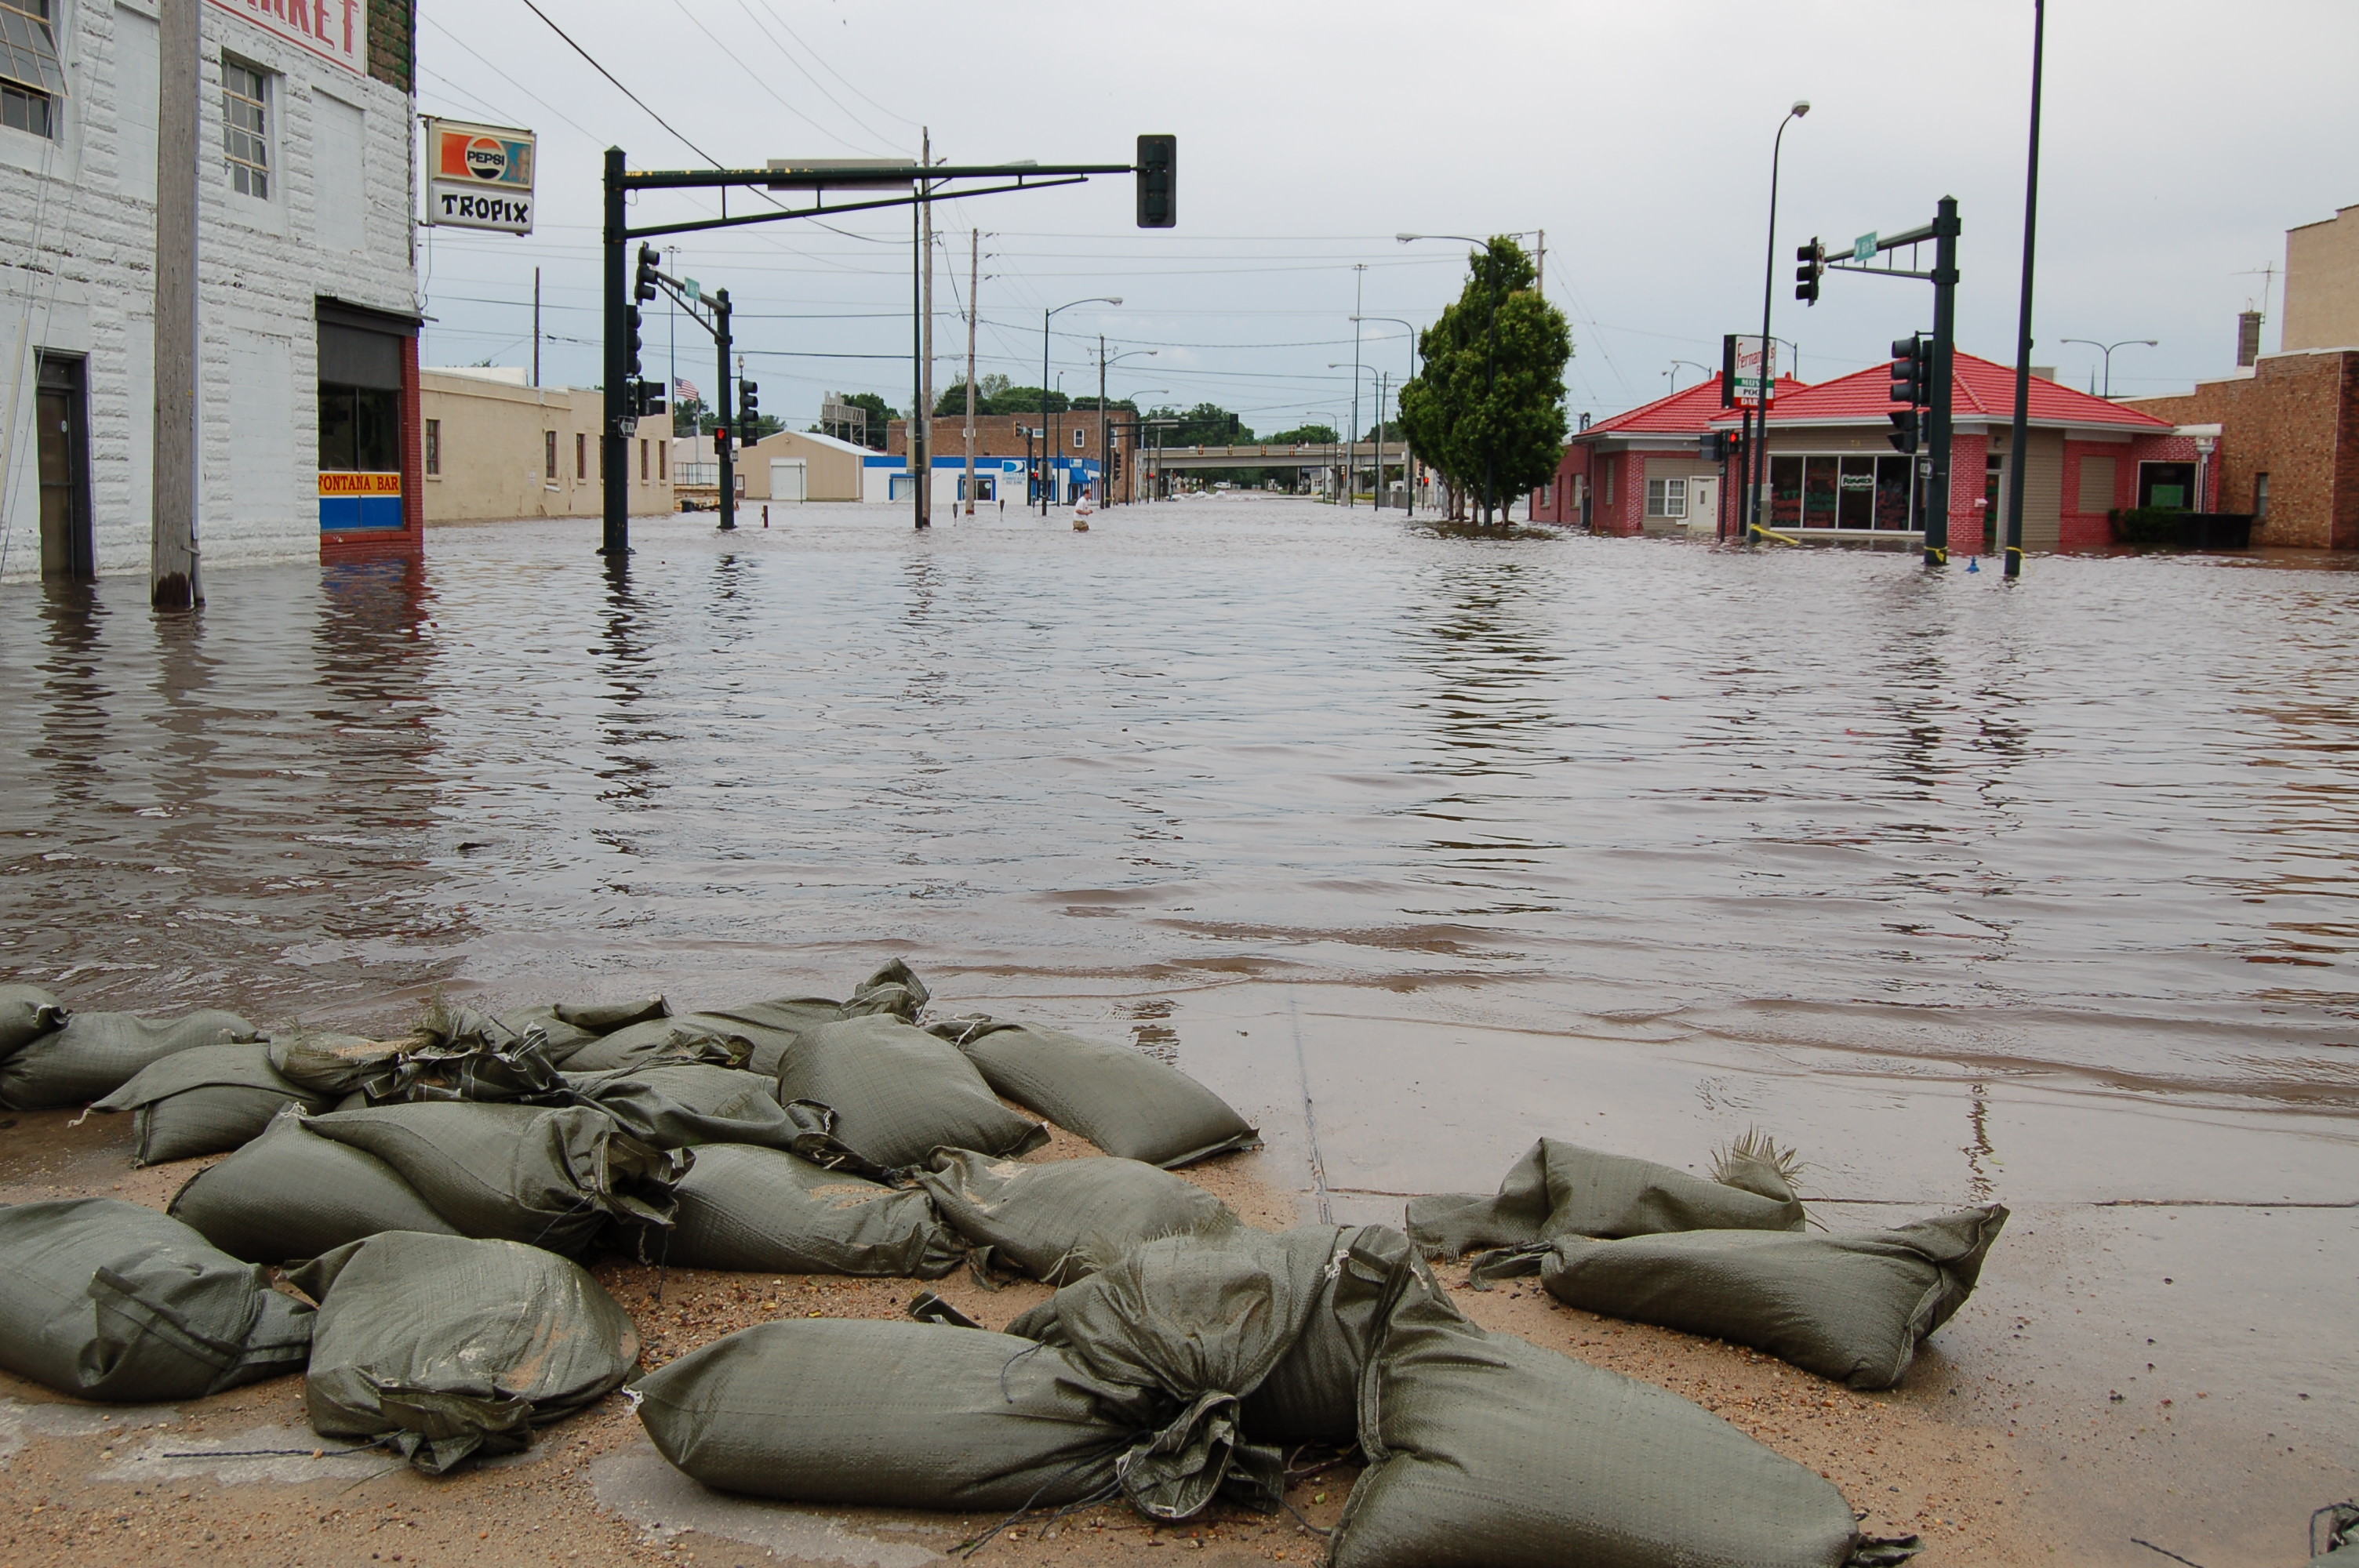
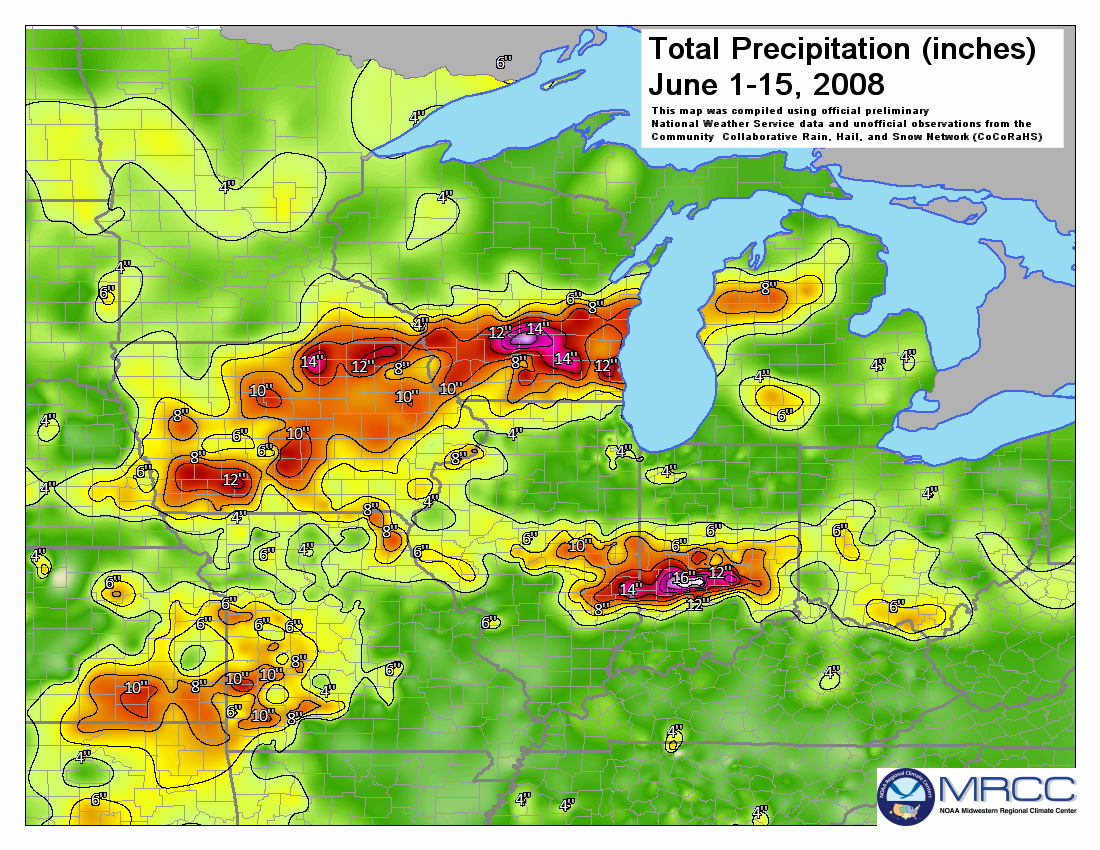
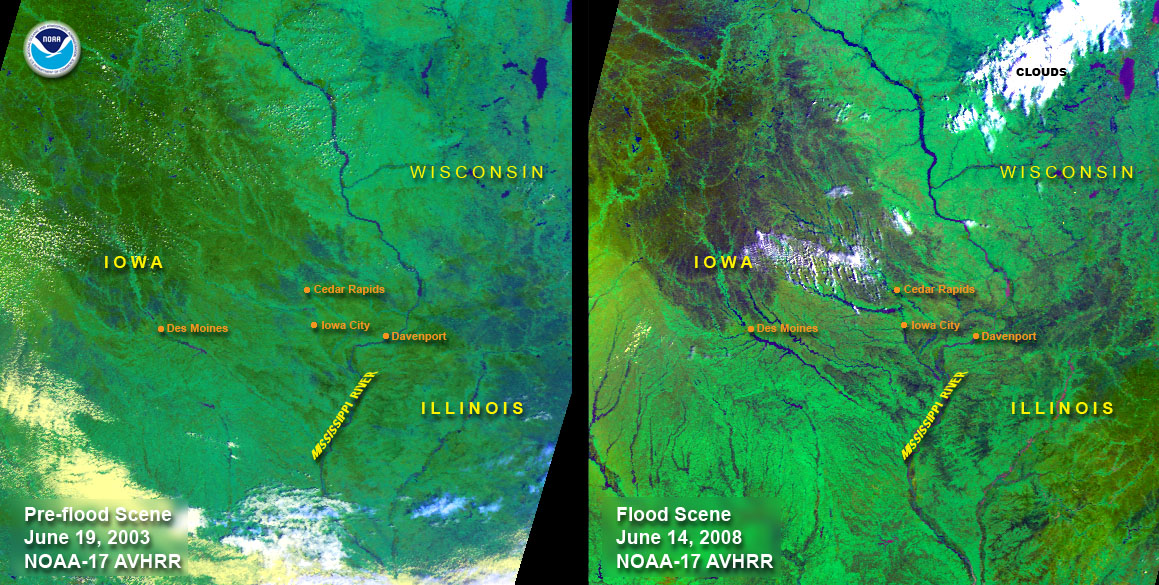
During the course of the first half of June, 2008, much of the Midwestern U.S. received copious amounts of rainfall as one storm system after another traversed the region. Parts of Indiana, Illinois, Iowa and Wisconsin were recipients of over a foot of rainfall with widespread flooding reported along the Mississippi River and its tributaries. Dams and levees were breached across parts of Wisconsin, Iowa, Indiana and along the Mississippi River. Historical record high streamflows occurred in some of the major regional rivers including the Des Moines, Cedar and Wisconsin Rivers. Reported river crests exceeded 500-year levels in some locations. Major levees in Des Moines and Cedar Rapids were breached forcing evacuations and causing extensive damage. Navigation along the Mississippi River was affected by the closure of several of the locks and dams. By the end of June, many of the communities along the Mississippi River from Rock Island, IL to Cape Girardeau, MO were still experiencing major flooding.
Prior to this flood event, much of the Upper Mississippi and Ohio River Basins had experienced wet conditions during the 2007-2008 winter and into the spring. Notably, over the past six months, eastern Iowa (climate divisions 3 and 6) and southern Wisconsin (climate divisions 7, 8 and 9) have been characterized by Standardized Precipitation Index (SPI) values greater than +2, extremely wet conditions which normally occur less than 2.5% of the time. Precipitation received across the Upper Mississippi Basin from December 2007 through May 2008 was the 2nd wettest in the 1895 to present record, illustrating how saturated the region was prior to this event. The vast majority of the rainfall received in June across the region was subsequently channeled directly into the lakes, rivers and streams, which is an important factor in the severity of the flooding. The 13 June USGS river gauge monitor indicated historic high streamflows across much of Iowa, southern Wisconsin and northern Illinois. Many of the gauges in this region remained much above normal throughout the remainder of June.
For the month of June, Wisconsin's climate divisions 6, 7, 8 and 9, Indiana's division 4 and Michigan's division 4 were all wettest on record. Precipitation received across the state of Iowa led to a ranking of 2nd wettest during June 2008. For the most recent 3-month period (April through June), Iowa ranked wettest and the East North Central region was 2nd wettest since records began in 1895. The year-to-date (January through June) rankings illustrate the persistent wetness across much of the Midwest. Iowa, Missouri and Ohio were all record wettest. Illinois, Indiana and the East North Central region were 2nd wettest.
The large-scale weather pattern during the first two weeks of June primarily consisted of a high pressure system over the southern Plains and Ohio Valley and abnormally low pressure situated over the northern Plains. The boundary between these two pressure systems was the focal point for the development of the heavy rainfall and severe storms. The 300mb chart for the evening of June 5, 2008 shows the jet stream position across the High Plains and is an indicator for locations which favor severe weather. The persistence of this pattern over the first half of June exacerbated the magnitude of the rainfall accumulations and subsequent flooding.
During the month of June, over 1100 daily precipitation records were broken throughout the Midwest. The majority of these records occurred in Iowa, Illinois, Wisconsin and Missouri. For the month, 78 stations reported their wettest day in any June on record and 15 of these stations set a new all-time record for the wettest 24-hour period for any month on record.
At some locations, much of the rainfall received during the first half of June fell over a short period of time. These types of events often cause flash flooding conditions with little if any warning. Such events can be evaluated to see how frequently a location might expect to experience an event of similar proportion. This statistic is called an exceedance probability. On June 7th, parts of southern Indiana received excessive amounts of rainfall over a relatively short period of time. Stations reported values ranging from 6 to 10 inches (150 to 250 mm) for the day across parts of the state. Terre Haute, IN had a 24-hour rainfall event between June 6 and 7 with an exceedance probability one might expect to see once every 100 years. Although the greatest official 24-hour total occurred 3 miles east of Center Point, IN with 9.5 inches (241 mm), an unofficial report in Edinburgh, IN indicated that 10.71 inches (272 mm) fell on June 7th, which one might expect to see less frequently than once every 1000 years. The official state record for Indiana is 10.5 inches (267 mm) and was set in Princeton, IN on August 6, 1905.
June rainfall totals exceeded 12 inches (305 mm) across large portions of the region, with Martinsville, IN reporting a total of 20.11 inches (511 mm) of rain for the month. This more than doubled the old record of 9.47 inches (241 mm) in 1998. This is also the highest amount for any month in Martinsville, eclipsing the previous record of 13.71 inches (348 mm) in July 1992.
In Dorchester, IA, the maximum 24-hour rainfall accumulation (approximately 7 inches or 180 mm) was similar to what you might expect to see once every 200 years. For the maximum 2-day and 4-day rainfall totals during June, values exceeded the 1000 year threshold. Flash flooding in this area on the 7th and 8th washed away many trailers and propane tanks along the Waterloo Creek. For the month of June, the preliminary precipitation total was 15.13 inches (384 mm), setting a new record for the most rainfall on record (1948 to present) during the month of June. The previous record was 11.45 inches (291 mm) and occurred during June 2000. This monthly total is also the 2nd wettest month on record for Dorchester. In August 2007, the station received 17.11 inches (435 mm) of rainfall which fell at intervals throughout the month, causing significant flooding.
For the month of June, 15 new all-time 24-hour precipitation records were broken across this region. On June 7th, Bowling Green, IN received 9.5 inches (241 mm) of rainfall, breaking the previous all-time 24-hour record by 2.7 inches (690 mm).
| 5 June 2008 | Lat | Lon | COOP ID | Record | Previous Record |
Previous Date |
Period of Record |
|---|---|---|---|---|---|---|---|
| POLK, NE | 41.08 | -97.79 | 256837 | 7.5 in | 6.74 in | 11 Jul 1972 | 60 |
| 7 June 2008 | Lat | Lon | COOP ID | Record | Previous Record |
Previous Date |
Period of Record |
| HUTSONVILLE PWR PLT, IL | 39.13 | -87.66 | 114317 | 7.2 in | 4.9 in | 27 Jul 1970 | 63 |
| EFFINGHAM, IL | 39.12 | -88.62 | 112687 | 5.7 in | 5.66 in | 13 Aug 1973 | 116 |
| BOWLING GREEN 1 W, IN | 39.39 | -87.04 | 120877 | 9.5 in | 6.8 in | 21 Jul 1973 | 63 |
| SPENCER, IN | 39.28 | -86.77 | 128290 | 7.15 in | 6.12 in | 29 Jun 1998 | 63 |
| TERRE HAUTE CAA AP, IN | 39.45 | -87.30 | 128725 | 5.38 in | 3.6 in | 31 Aug 1950 | 61 |
| 8 June 2008 | Lat | Lon | COOP ID | Record | Previous Record |
Previous Date |
Period of Record |
| ST ANSGAR, IA | 43.38 | -92.92 | 137326 | 5.64 in | 2.84 in | 30 May 2008 | 61 |
| GREENSBURG, IN | 39.35 | -85.49 | 123547 | 5.0 in | 4.65 in | 5 Mar 1897 | 113 |
| ONTARIO, WI | 43.72 | -90.60 | 476280 | 6.1 in | 6.0 in | 1 Jul 1978 | 34 |
| HILLSBORO, WI | 43.65 | -90.33 | 473654 | 4.8 in | 4.5 in | 19 Aug 2007 | 61 |
| WEST ALLIS, WI | 43.02 | -88.00 | 479046 | 4.55 in | 3.69 in | 10 Jul 2006 | 58 |
| 9 June 2008 | Lat | Lon | COOP ID | Record | Previous Record |
Previous Date |
Period of Record |
| AMES, OK | 36.25 | -98.19 | 340215 | 4.5 in | 3.73 in | 20 Jul 1899 | 113 |
| COTTAGE GROVE, WI | 43.08 | -89.19 | 471840 | 4.47 in | 4.38 in | 15 Sep 1914 | 99 |
| 25 June 2008 | Lat | Lon | COOP ID | Record | Previous Record |
Previous Date |
Period of Record |
| LINNEUS, MO | 39.88 | -93.18 | 234978 | 8.61 in | 8.1 in | 15 Jul 1958 | 101 |
| 27 June 2008 | Lat | Lon | COOP ID | Record | Previous Record |
Previous Date |
Period of Record |
| THRALL, KS | 37.94 | -96.31 | 148114 | 6.94 in | 6.8 in | 8 Jun 1979 | 58 |
Substantial recent flooding in the Midwest was caused by heavy precipitation that fell not only in June, but also throughout the first half of 2008. NOAA's Midwestern Regional Climate Center found that 286 National Weather Service Cooperative Observer Network stations reported precipitation totals for the first half of 2008 that ranked within their top five records of the January-June period since the late 1800s in some cases. More than 100 individual stations tied or exceeded their January through June precipitation records in the Midwest region this year, which is an extraordinary 11% of stations with observations available, explained MRCC Regional Climatologist Mike Palecki. Only a third as many Midwest stations achieved their current record in 1993, another year of great floods (although in 1993 the heaviest rainfall occurred in July). For the month of June, 170 stations reported precipitation totals which ranked within their top five records.
| June 2008 | Record | Previous Record |
Year |
|---|---|---|---|
| Martinsville, IN | 20.11 in | 9.47 in | 1998 |
| Baraboo, WI | 17.17 in | 10.65 in | 1949 |
| Mt. Vernon, MO | 16.03 in | 12.56 in | 2007 |
| Hutsonville, IL | 15.30 in | 9.09 in | 1999 |
| Decorah, IA | 14.10 in | 11.80 in | 1993 |
| Washington, OH | 11.14 in | 9.40 in | 1928 |
| Lake City, MI | 10.66 in | 7.10 in | 1967 |
For additional precipitation records, please visit our U.S. Records webpage.
Press release from NOAA's Midwestern Regional Climate Center at the Illinois State Water Survey:
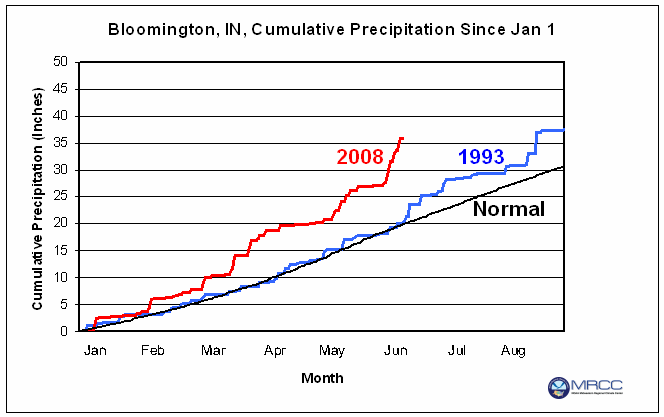
The recent heavy rain in the Midwest and flooding in Illinois, Indiana, Iowa, Wisconsin, Minnesota, and Missouri are drawing comparisons with the weather and events associated with the Great Flood of 1993 on the Mississippi River, according to Steve Hilberg, director of the National Oceanic and Atmospheric Administration (NOAA) Midwestern Regional Climate Center (MRCC) at the Illinois State Water Survey. Climatologists there have compared 2008 weather events with what occurred in 1993 to place the current situation in perspective. Precipitation levels since January 1 in the nine-state Midwest region are higher and cover a much larger area than for the same period in 1993. In 1993, the major rains occurred in June and July and the most significant flooding was later than what has occurred so far this year. "In many locations in the Midwest, precipitation has accumulated faster than during the same period in 1993," says Mike Palecki, regional climatologist with the Climate Center. In 1993, there were major levee breaks on the Missouri and Mississippi Rivers. The current flooding damages have been mainly on the tributaries of the Mississippi.
Waterloo, IA, in the core region of the 1993 floods, has experienced a faster accumulation of precipitation in 2008 than in 1993, explaining the earlier timing of flooding evident in Iowa this year. Even if normal rain rates return, the Waterloo accumulated precipitation total would remain above that of 1993 until late July. Accumulated precipitation departures in Bloomington, IN, are much greater in 2008 than in 1993. Palecki indicates that at both Waterloo and Bloomington, precipitation through June 11 has exceeded that total amount normally expected to fall through August
Another difference between the situation in 1993 and that in 2008 relates to the amount of precipitation in the previous winter and fall. Precipitation amounts during the fall of 1992 (September-November) were 125 to 150 percent of normal from Missouri through Illinois and northern Indiana north through southern Minnesota, much of Wisconsin, and Michigan. Snowfall the winter before the 1993 Great Flood was near to above normal across most of the Midwest, with heavy snow in the upper Mississippi River basin in February 1993. In the fall of 2007, the central Midwest received only 50 to 75 percent of normal rainfall. As a result, soils this spring were better able to handle the heavy rain that occurred. This past winter the heaviest snowfall was concentrated in an area from northwestern Missouri across the southeastern half of Iowa, southern Wisconsin, northern Illinois and Indiana, southern Michigan, and Ohio. Most of Minnesota received well below normal snowfall. A comparison of the impacts from 1993 and this year shows both similarities and differences. Like this year, wet weather in the spring of 1993 led to wet soils and planting delays of corn and soybeans across the Corn Belt. While widespread flood damage has occurred already this year in Minnesota, Iowa, Missouri, Wisconsin, Illinois, and Indiana, crop damage in 1993 did not begin until mid-June. The most serious damages did not occur until later in July and August of that year as heavy rains continued across the region. "We will continue to monitor this situation as it unfolds," concludes Hilberg. The current status of precipitation, temperature, and other climate conditions can be monitored on the MRCC's "Midwest Climate Watch" web page.
NCDC Analysis:
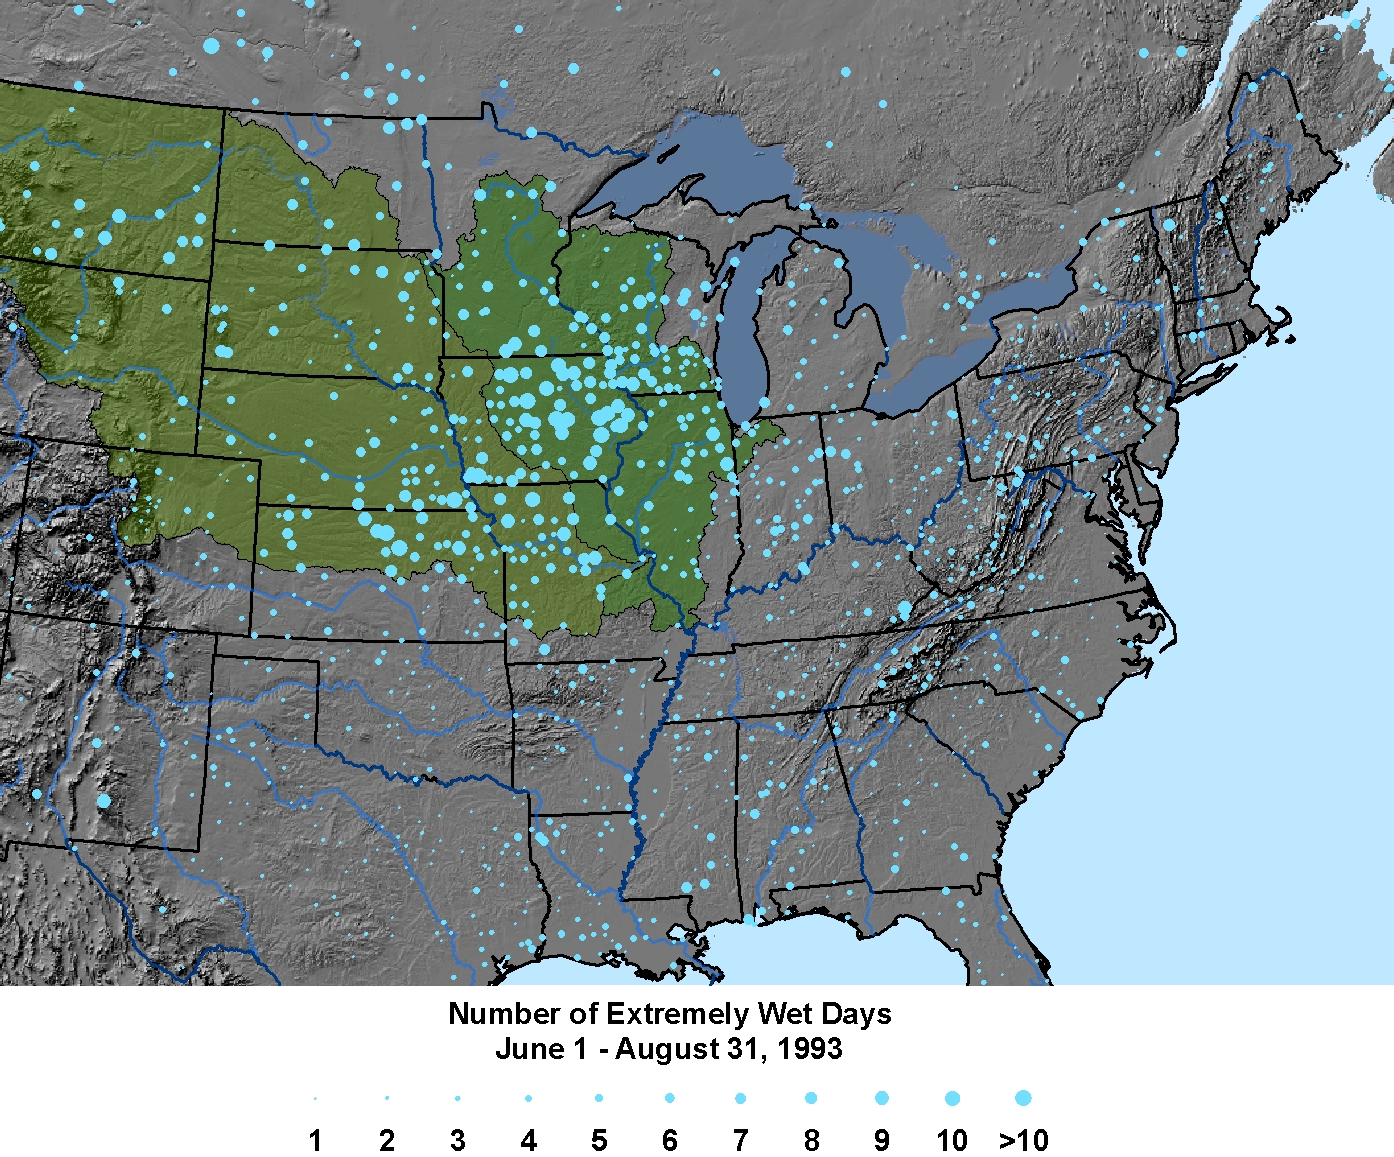
In general, the rainfall accumulations over the flood zone since April 1 are exceptionally large by historical standards. For instance, numerous locations in the immediate area experienced as many as 10 extremely wet days i.e., days with more rainfall than 90% of all historical events for that location and time of year. Furthermore, approximately one third of NOAA's observing stations in the region (40-45°N, 85-100°W) experienced a record number of extremely wet days since April 1, more than in any other year in at least the past half century. In comparison, the second wettest year for this region and time period was 1999, during which about 15% of the weather stations set comparable records.
The current event is similar to the flood of 1993 in that both are characterized by numerous extremely wet days in the Upper Mississippi river basin, particularly in eastern Iowa. However, the 1993 event was somewhat larger in its spatial extent, significantly affecting the Missouri Basin as well as the Upper Mississippi. Furthermore, 1993 experienced a larger number of wet days simply because the duration of the event was longer (though the temporal extent of the current event is obviously not yet known).
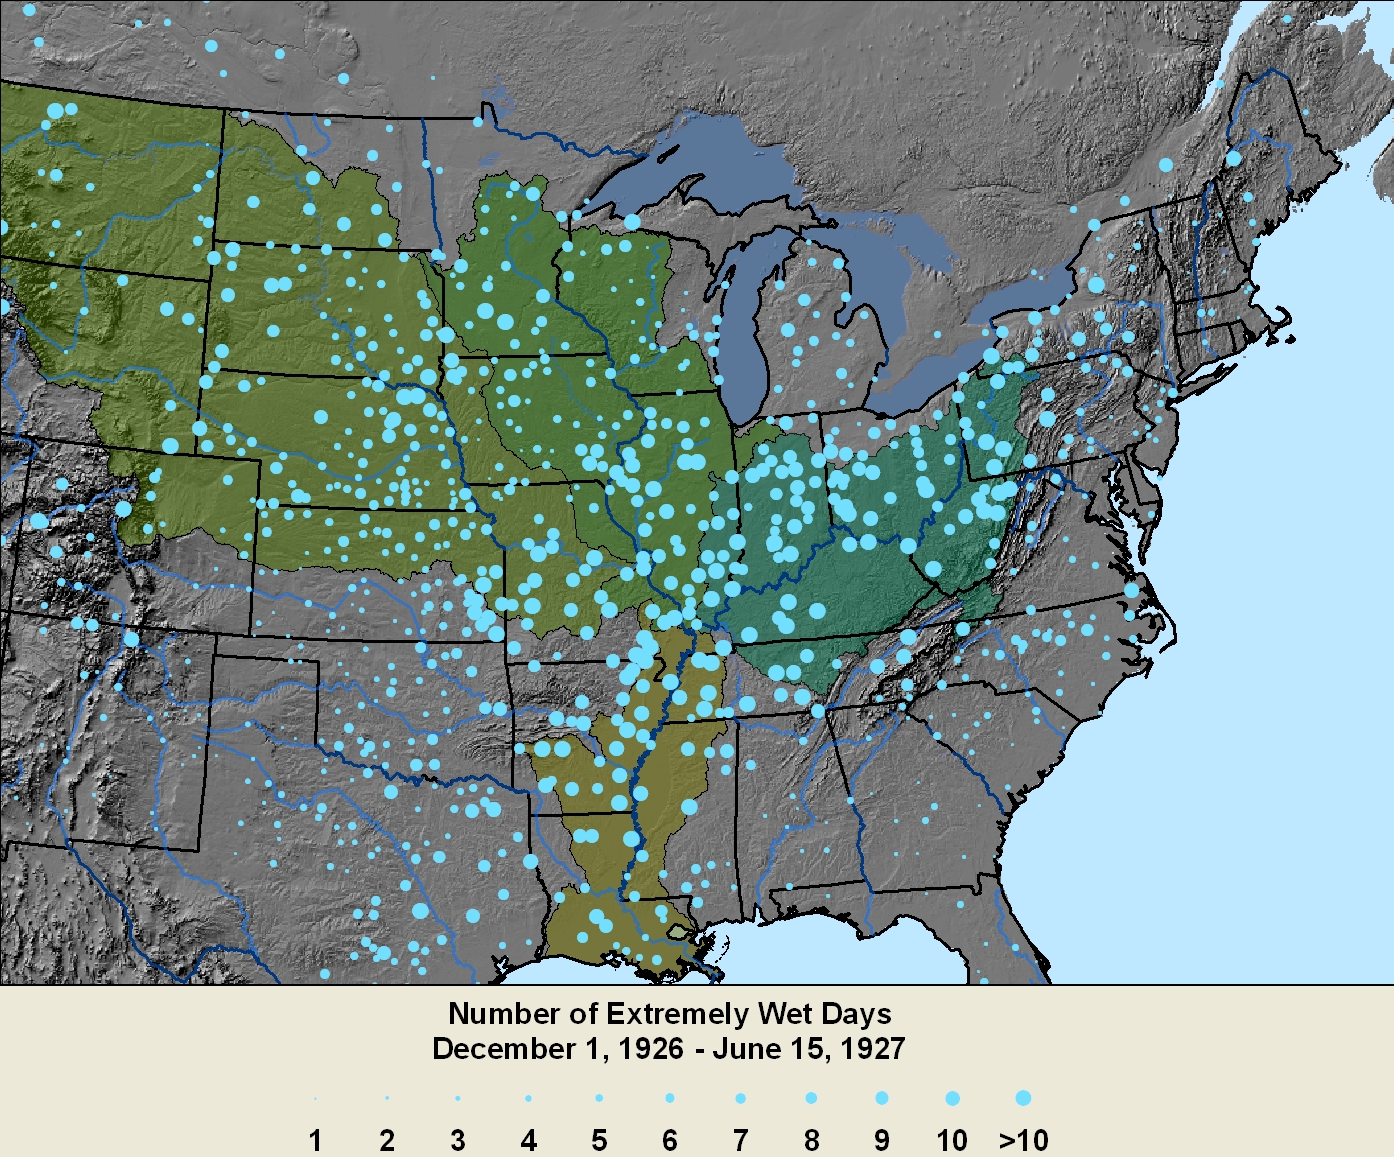
The current event differs significantly from the flood of 1927. In particular, the areas of enhanced rainfall in 1927 were located in the Ohio River Valley and the Lower Mississippi Valley. Consequently, the flooding occurred primarily in the Lower Mississippi Basin, particularly in Arkansas and areas to the south. (Note that the 1927 analysis depicts a six-month period because winter precipitation played a major role in preconditioning the event.)
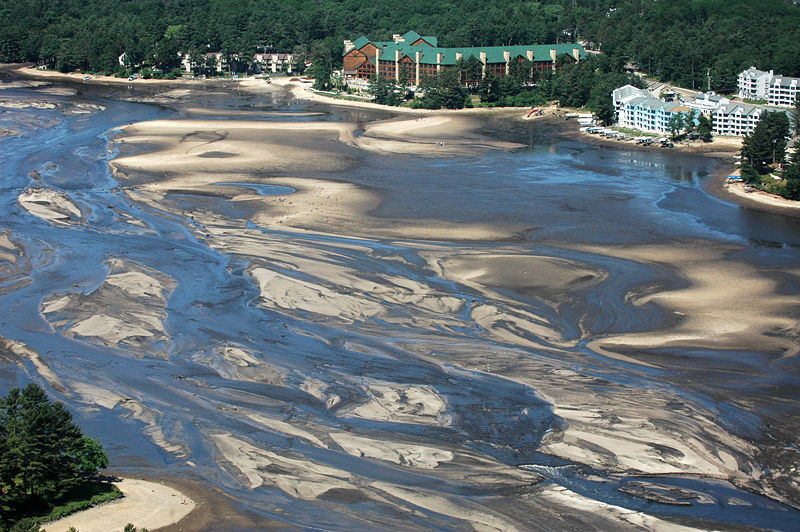
Lake Delton, located in the Wisconsin Dells in south central Wisconsin, was severely impacted by the heavy and persistent rainfall in early June. The 267-acre man-made lake emptied into the nearby Wisconsin River on the 9th when the land between the lake and the river eroded, creating a new channel. This erosion swept away three homes, destroyed two others and washed away part of a highway. Wisconsin governor Jim Doyle announced on the 10th that the state would repair the lake since it is a crucial component to the billion-dollar Wisconsin Dells tourism region.
As of June 25, 83 of Iowa's 99 counties were declared disaster areas by Governor Chet Culver. Iowa State University economists estimate that the total economic impact of the flooding may approach or exceed the $1.45 billion in losses to crops, livestock, and personal property/income reported in the 1993 floods. The USDA reported that 9% of corn acres and 8% of soybean acres in Iowa were flooded in June. The city of Cedar Rapids was severely impacted by the flooding of the Cedar River in mid-June. In anticipation of rising flood waters, the city shut down all of the bridges and evacuated downtown. As anticipated, the levee broke on the 12th, sweeping away a railroad bridge and submerging much of the downtown area. The severe flooding in east central Iowa prompted officials to suspend all retail and postal services at the Waterloo Main Post Office.
Towns along the Mississippi River from Illinois to Missouri were building barriers in an attempt to hold back rising floodwaters by mid-June. As many as 27 levees were in jeopardy of overflowing as the river was projected to rise. Levees near the Illinois towns of Meyer and Gulfport broke by the 18th, forcing hundreds of evacuations and threatening thousands of acres of farmland. As of June 24, Governor Rod R. Blagojevich of Illinois had declared 24 counties state disaster areas due to flooding and has requested increased federal disaster assistance for flood-stricken areas.
Central and southwest Indiana were also hit hard from June 4-7. On June 9, President Bush declared 29 counties in southwest and central Indiana a major disaster area, opening up the region to receive federal aid and assistance from FEMA. The U.S. Coast Guard was called in to assist with the evacuations along many of the low-lying areas. Several hospitals in southern Indiana were evacuated and are likely to remain closed for some time due to extensive flood damage. Damage costs resulting from the flooding are expected to be the highest of any disaster in the history of the state.
The Mississippi River crested 10 feet above flood stage in Hannibal, MO on June 10 and continued to be at or near flood stage for the remainder of the month. A levee along the Mississippi River in Lincoln County, MO breached at the end of the month forcing the evacuation of around 100 homes. Much of the flooding in Missouri was along the Mississippi River and resulted from heavy rainfall received across much of Iowa and Wisconsin.
Storm Exchange, Inc., a weather risk management company, projects that the flooding in key corn and soybean growing regions of the U.S. will negatively affect up to 12 percent of the total GDP output. The company estimates that nearly one-third of the total U.S. corn crop and 30% of the total U.S. soybean crop were impacted by flood conditions in key Midwest growing regions. At the end of June, the company projected that corn yields may be down 10-12% below the trend. Some farmers in the region may not even be able to plant their crops this season due to the saturated soil. As of mid-June, 20% of Iowa's crop was wiped out. In Indiana, 9% was estimated to be flooded at the peak of the flooding event and 7% remained under water two weeks later. The American Farm Bureau Federation estimates that crop losses will likely exceed $8 billion with Iowa accounting for approximately half of the damage. These estimates are related only to crop production at the end of June and are likely to be much higher when considering losses including livestock, infrastructure, building and equipment.
Another impact of widespread flooding is the burgeoning mosquito population. There are up to 20 times the average number of mosquitoes in parts of Iowa and 5 times the average in the Chicago area. Fortunately, these mosquitoes are likely not the kind which usually carry West Nile virus, but merely floodwater mosquitoes and are likely to stick around until the stagnant waters dry up.
Barges expect continued losses due to the closure and failure of some of the locks and dams along the Mississippi River and railroads experienced disruption as some rail lines were washed out. The Association of American Railroads reported that railroad freight for the week ending June 21 was down 5.7% year-over-year. Numerous main rail lines were closed due to the floodwaters but were mostly reopened by the end of June. The Iowa Renewable Fuels Association indicated that some 300 million gallons of the state's 2.2 billion gallons of biofuel refineries were still offline by the end of June due to flooding.
As of June 24, the American Red Cross was working in eight states, providing food, comfort, information and other assistance to those in need. The organization has provided more than 713,000 meals and snacks and distributed more than 40,000 clean-up kits to residents affected by flooding and severe weather in the central U.S. The Red Cross anticipates spending in excess of $15 million for this and other recent disasters. FEMA has supplied over 3.6 million liters of water, nearly 200,000 meals and almost 500,000 sandbags during the course of the flood in June.
As of June 19, storms and flooding across six states have killed 24 people, injured 148 and caused more than $1.5 billion in estimated damage in Iowa alone. By the end of June, major flooding was still a concern on the Mississippi River from Quincy, IL to Grafton, IL and from Chester, IL to Cape Girardeau, MO.
For all climate questions other than questions concerning this report, please contact the National Climatic Data Center's Climate Services Division:
Climate Services DivisionFor further information on the historical climate perspective presented in this report, contact:
Karin Gleason


