

|
CONTACT: Media Interviews (415) 625-2270 (415) 625-2285 Internet address: www.bls.gov/ro9/news.htm |
BLS 08-80 |
SAN FRANCISCO AREA JOB COUNT IN JULY 2008 DOWN 12,000 OVER THE YEAR
Total nonfarm employment for the San Francisco-Oakland-Fremont Metropolitan Statistical Area1 stood at 2,022,800 in July 2008, down 12,000, or 0.6 percent, over the year, the Bureau of Labor Statistics of the U.S. Department of Labor reported today. The rate of job loss in the San Francisco metropolitan area was greater than the 0.1-percent national decrease from July 2007 to July 2008. Richard J. Holden, the Bureau's regional commissioner in San Francisco, noted that this was the second consecutive over-the-year decline in the local area, following 44 consecutive months of over-the-year increases. (See chart A and table 1; Technical Note at end of release contains metropolitan area definitions. All data in this release are not seasonally adjusted; accordingly, over the year analysis is used throughout.)
Chart A. Chart A. Total nonfarm employment, over-the-year net change in the San Francisco-Oakland-Fremont metropolitan area and its components, July 2001-July 2008

1 The San Francisco-Oakland-Fremont, California Metropolitan Statistical Area includes Alameda, Contra Costa, Marin, San Francisco, and San Mateo Counties.
The San Francisco metropolitan area is comprised of two metropolitan divisions--separately identifiable employment centers within the larger metropolitan area. The two divisions each accounted for approximately half of the area's workforce in July 2008. However, the Oakland-Fremont-Hayward Metropolitan Division lost 19,600 jobs from July a year ago, while the San Francisco-San Mateo-Redwood City Metropolitan Division gained 7,600 jobs.
Industry Employment
The financial activities and the trade, transportation, and utilities supersectors experienced the largest employment losses in the metropolitan area, each down 5,800 jobs over the year. The Oakland division accounted for most of the jobs lost in both industries, down 5,100 and 4,500, respectively. Overall, the local financial activities supersector declined 3.8 percent and trade, transportation, and utilities fell 1.6 percent. Nationally, employment in the two supersectors decreased more slowly, declining 1.4 and 0.9 percent, respectively. (See table 1 and chart B.)
Chart B. Over-the-year percent change in employment by industry supersector, United States and the San Francisco metropolitan area, July 2008
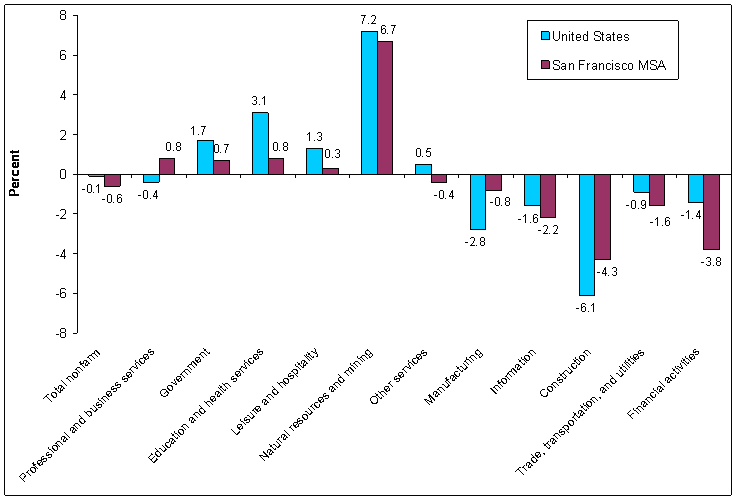
In the San Francisco area, construction employment fell by 5,200 since July a year ago, a 4.3-percent decrease. Still, local construction jobs declined at a slower pace than they did nationally (6.1 percent).
Three industries in the San Francisco area experienced over-the-year employment gains. The professional and business services supersector added 2,900 jobs from July 2007, growing at a 0.8-percent pace; nationally, this supersector declined by 0.4 percent. All of the area's growth in professional and business services occurred in the San Francisco division which added 4,200 jobs to its payrolls; in contrast, the Oakland division lost 1,300 jobs.
The government supersector added 2,200 jobs locally, expanding 0.7 percent; this was slower than the 1.7-percent rate of growth nationwide. Education and health services gained 1,900 jobs areawide, up 0.8 percent over the year. Nationally, this supersector grew at a much faster pace of 3.1 percent.
Employment in the 12 Largest Areas
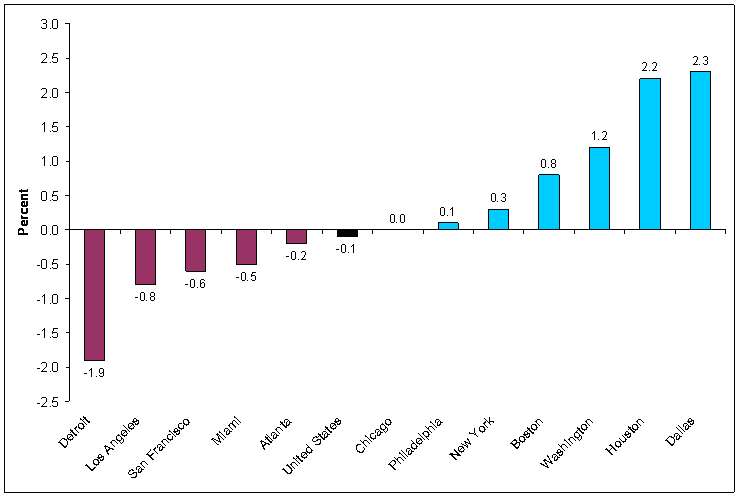
The San Francisco-Oakland-Fremont area was one of the nation's 12 largest metropolitan statistical areas in July 2008. Of the 12 areas, 6 added jobs from July a year ago, running counter to the national trend. Dallas-Fort Worth-Arlington registered the fastest rate of employment growth, up 2.3 percent from July 2007, closely followed by Houston-Sugar Land-Baytown, up 2.2 percent. Four other areas experienced job growth during the 12-month period: Washington-Arlington-Alexandria (1.2 percent), Boston-Cambridge-Quincy (0.8 percent), New York-Northern New Jersey-Long Island (0.3 percent), and Philadelphia-Camden-Wilmington (0.1 percent). Employment in another area, Chicago-Naperville-Joliet, was unchanged over the year. (See chart C.)
The percentage loss in jobs exceeded that for the nation (-0.1 percent) in the remaining five metropolitan areas: Atlanta-Sandy Springs-Marietta (-0.2 percent), Miami-Fort Lauderdale-Pompano Beach (-0.5 percent), San Francisco-Oakland-Fremont (-0.6 percent), Los Angeles-Long Beach-Santa Ana (-0.8 percent), and Detroit-Warren-Livonia (-1.9 percent).
Dallas, the area with the fastest annual growth rate in July 2008, also added the largest number of jobs over the year, 68,000, followed by Houston with the addition of 57,100 jobs. Washington, D.C. was a more distant third, adding 35,400 to its count. The largest numeric declines in employment occurred in Los Angeles (-45,000) and Detroit (-36,700).
Chart C. Over-the-year percent change in employment, United States and 12 largest metropolitan areas, July 2008
This release presents nonfarm payroll employment estimates from the Current Employment Statistics (CES) program. The CES survey is a Federal-State cooperative endeavor in which State workforce agencies prepare the data using concepts, definitions, and technical procedures prescribed by the Bureau of Labor Statistics.
Definitions. Employment data refer to persons on establishment payrolls who receive pay for any part of the pay period which includes the 12th of the month. Persons are counted at their places of work rather than at their place of residence; those appearing on more than one payroll are counted on each payroll. Industries are classified on the basis of their principal activity in accordance with the 2002 version of the North American Industry Classification System (NAICS).
Method of estimation. The employment data are estimated using a weighted "link relative" technique in which a ratio (link relative) of current-month employment to that of the previous month is computed from a sample of establishments reporting for both months. The estimates of employment for the current month are obtained by multiplying the estimates for the previous month by these ratios. Small-domain models are used as the official estimators for approximately 10 percent of CES published series which have insufficient sample for direct sample-based estimates.
Annual revisions. Employment estimates are adjusted annually to a complete count of jobs, called benchmarks, derived principally from tax reports which are submitted by employers who are covered under state unemployment insurance (UI) laws. The benchmark information is used to adjust the monthly estimates between the new benchmark and the preceding one and also to establish the level of employment for the new benchmark month. Thus, the benchmarking process establishes the level of employment, and the sample is used to measure the month-to-month changes in the level for the subsequent months.
Reliability of the Estimates
The estimates presented in this release are based on sample survey data and administrative data and thus are subject to sampling and other types of errors. Sampling error is a measure of sampling variability-variation that occurs by chance because a sample rather than the entire population is surveyed. Survey data are also subject to nonsampling errors, such as those which can be introduced into the data collection and processing operations. Estimates not directly derived from sample surveys are subject to additional errors resulting from the special estimation processes used. The sums of individual items may not always equal the totals shown in the same tables because of rounding.
Employment estimates. Measures of sampling error for state CES data at the supersector level are available on the BLS Web site at www.bls.gov/sae/790stderr.htm. Information on recent benchmark revisions for states is available at www.bls.gov/sae.
Area definitions. The substate area data published in this release reflect the standards and definitions established by the U.S. Office of Management and Budget, dated December 5, 2005. A detailed list of the geographic definitions is published annually in the May issue of Employment and Earnings.
The San Francisco-Oakland-Fremont, Calif., Metropolitan Statistical Area (MSA) includes Alameda, Contra Costa, Marin, San Francisco, and San Mateo Counties in California.
The Oakland-Fremont-Hayward, Calif., Metropolitan Division (MD) includes Alameda and Contra Costa Counties in California.
The San Francisco-San Mateo-Redwood City, Calif., Metropolitan Division (MD) includes Marin, San Francisco, and San Mateo Counties in California.
Additional information
More complete information on the technical procedures used to develop these estimates and additional data appear in Employment and Earnings, which is available by subscription from the Superintendent of Documents, U.S. Government Printing Office, Washington, DC 20402 (telephone 202-512-1800).
Industry employment data for states and metropolitan areas from the Current Employment Statistics program are also available from the Internet at www.bls.gov/sae.
For personal assistance or further information on the Current Employment Statistics program, as well as other Bureau programs, contact the Western BLS information office at 415-625-2270 from 9:00 a.m. to 11:30 a.m. and 1:30 p.m. to 4:00 p.m. PDT. Current and historical information on the Current Employment Statistics program and other surveys are also available on our regional Web site at www.bls.gov/ro9/home.htm.
Information in this release will be made available to sensory impaired individuals upon request. Voice phone: 202-691-5200; TDD message referral phone: 1-800-877-8339.
| Area and Industry | July | May | June | July | Change from July | |
|---|---|---|---|---|---|---|
| 2007 | 2008 | 2008 | 2008(p) | 2007 to July 2008 | ||
| Number | Percent | |||||
United States |
||||||
Total nonfarm |
137,410 | 138,405 | 138,694 | 137,236 | -174 | -0.1 |
Natural resources and mining |
740 | 761 | 778 | 793 | 53 | 7.2 |
Construction |
7,941 | 7,306 | 7,425 | 7,459 | -482 | -6.1 |
Manufacturing |
13,926 | 13,567 | 13,629 | 13,532 | -394 | -2.8 |
Trade, trasportation, and utilities |
26,610 | 26,396 | 26,478 | 26,367 | -243 | -0.9 |
Information |
3,041 | 3,011 | 3,022 | 2,993 | -48 | -1.6 |
Financial activities |
8,401 | 8,227 | 8,273 | 8,285 | -116 | -1.4 |
Professional and business services |
18,086 | 17,983 | 18,100 | 18,017 | -69 | -0.4 |
Education and health services |
18,012 | 18,868 | 18,686 | 18,564 | 552 | 3.1 |
Leisure and hospitality |
14,142 | 13,906 | 14,248 | 14,328 | 186 | 1.3 |
Other services |
5,565 | 5,553 | 5,595 | 5,591 | 26 | 0.5 |
Government |
20,946 | 22,827 | 22,460 | 21,307 | 361 | 1.7 |
San Francisco-Oakland-Fremont MSA |
||||||
Total nonfarm |
2,034.80 | 2,038.70 | 2,039.50 | 2,022.80 | -12 | -0.6 |
Natural resources and mining |
1.5 | 1.6 | 1.6 | 1.6 | 0.1 | 6.7 |
Construction |
121.3 | 113.8 | 114.8 | 116.1 | -5.2 | -4.3 |
Manufacturing |
137.4 | 136.5 | 136.4 | 136.3 | -1.1 | -0.8 |
Trade, transportation, and utilities |
359 | 353.5 | 353.6 | 353.2 | -5.8 | -1.6 |
Information |
69.1 | 67.9 | 67.9 | 67.6 | -1.5 | -2.2 |
Financial activities |
152.3 | 147 | 147.2 | 146.5 | -5.8 | -3.8 |
Professional and business services |
358.3 | 359.8 | 361.4 | 361.2 | 2.9 | 0.8 |
Education and health services |
228 | 233.8 | 231.4 | 229.9 | 1.9 | 0.8 |
Leisure and hospitality |
217.3 | 216.4 | 218.3 | 217.9 | 0.6 | 0.3 |
Other services |
75.6 | 75.8 | 76 | 75.3 | -0.3 | -0.4 |
Government |
315 | 332.6 | 330.9 | 317.2 | 2.2 | 0.7 |
Oakland-Fremont-Hayward, Metropolitan Division |
||||||
Total nonfarm |
1,045.50 | 1,038.40 | 1,037.20 | 1,025.90 | -19.6 | -1.9 |
Natural resources and mining |
1.2 | 1.3 | 1.3 | 1.3 | 0.1 | 8.3 |
Construction |
74.9 | 67.3 | 67.7 | 68.4 | -6.5 | -8.7 |
Manufacturing |
93.4 | 92.4 | 92.1 | 92 | -1.4 | -1.5 |
Trade, transportation, and utilities |
197 | 192.7 | 192.4 | 192.5 | -4.5 | -2.3 |
Information |
29.4 | 28.6 | 28.7 | 28.5 | -0.9 | -3.1 |
Financial activities |
62.4 | 57.9 | 57.9 | 57.3 | -5.1 | -8.2 |
Professional and business services |
156.1 | 154.5 | 155.1 | 154.8 | -1.3 | -0.8 |
Education and health services |
123.7 | 126.6 | 125.5 | 124.5 | 0.8 | 0.6 |
Leisure and hospitality |
88.9 | 87.8 | 88.7 | 88 | -0.9 | -1 |
Other services |
36.9 | 36.2 | 36.4 | 35.9 | -1 | -2.7 |
Government |
181.6 | 193.1 | 191.4 | 182.7 | 1.1 | 0.6 |
San Francisco-San Mateo-Redwood City, Metropolitan Division |
||||||
Total nonfarm |
989.3 | 1,000.30 | 1,002.30 | 996.9 | 7.6 | 0.8 |
Natural resources and mining |
0.3 | 0.3 | 0.3 | 0.3 | 0 | 0 |
Construction |
46.4 | 46.5 | 47.1 | 47.7 | 1.3 | 2.8 |
Manufacturing |
44 | 44.1 | 44.3 | 44.3 | 0.3 | 0.7 |
Trade, transportation, and utilities |
162 | 160.8 | 161.2 | 160.7 | -1.3 | -0.8 |
Information |
39.7 | 39.3 | 39.2 | 39.1 | -0.6 | -1.5 |
Financial activities |
89.9 | 89.1 | 89.3 | 89.2 | -0.7 | -0.8 |
Professional and business services |
202.2 | 205.3 | 206.3 | 206.4 | 4.2 | 2.1 |
Education and health services |
104.3 | 107.2 | 105.9 | 105.4 | 1.1 | 1.1 |
Leisure and hospitality |
128.4 | 128.6 | 129.6 | 129.9 | 1.5 | 1.2 |
Other services |
38.7 | 39.6 | 39.6 | 39.4 | 0.7 | 1.8 |
Government |
133.4 | 139.5 | 139.5 | 134.5 | 1.1 | 0.8 |
| Area and Industry | July | May | June | July | Change from July | |
|---|---|---|---|---|---|---|
| 2007 | 2008 | 2008 | 2008(p) | 2007 to July 2008 | ||
| Number | Percent | |||||
United States |
||||||
Total nonfarm |
137,410 | 138,405 | 138,694 | 137,236 | -174 | -0.1 |
Natural resources and mining |
740 | 761 | 778 | 793 | 53 | 7.2 |
Construction |
7,941 | 7,306 | 7,425 | 7,459 | -482 | -6.1 |
Manufacturing |
13,926 | 13,567 | 13,629 | 13,532 | -394 | -2.8 |
Trade, transportation, and utilities |
26,610 | 26,396 | 26,478 | 26,367 | -243 | -0.9 |
Information |
3,041 | 3,011 | 3,022 | 2,993 | -48 | -1.6 |
Financial activities |
8,401 | 8,227 | 8,273 | 8,285 | -116 | -1.4 |
Professional and business services |
18,086 | 17,983 | 18,100 | 18,017 | -69 | -0.4 |
Education and health services |
18,012 | 18,868 | 18,686 | 18,564 | 552 | 3.1 |
Leisure and hospitality |
14,142 | 13,906 | 14,248 | 14,328 | 186 | 1.3 |
Other services |
5,565 | 5,553 | 5,595 | 5,591 | 26 | 0.5 |
Government |
20,946 | 22,827 | 22,460 | 21,307 | 361 | 1.7 |
San Francisco-Oakland-Fremont, CA |
||||||
Total nonfarm |
2,034.80 | 2,038.70 | 2,039.50 | 2,022.80 | -12 | -0.6 |
Natural resources and mining |
1.5 | 1.6 | 1.6 | 1.6 | 0.1 | 6.7 |
Construction |
121.3 | 113.8 | 114.8 | 116.1 | -5.2 | -4.3 |
Manufacturing |
137.4 | 136.5 | 136.4 | 136.3 | -1.1 | -0.8 |
Trade, transportation, and utilities |
359 | 353.5 | 353.6 | 353.2 | -5.8 | -1.6 |
Information |
69.1 | 67.9 | 67.9 | 67.6 | -1.5 | -2.2 |
Financial activities |
152.3 | 147 | 147.2 | 146.5 | -5.8 | -3.8 |
Professional and business services |
358.3 | 359.8 | 361.4 | 361.2 | 2.9 | 0.8 |
Education and health services |
228 | 233.8 | 231.4 | 229.9 | 1.9 | 0.8 |
Leisure and hospitality |
217.3 | 216.4 | 218.3 | 217.9 | 0.6 | 0.3 |
Other services |
75.6 | 75.8 | 76 | 75.3 | -0.3 | -0.4 |
Government |
315 | 332.6 | 330.9 | 317.2 | 2.2 | 0.7 |
Los Angeles-Long Beach-Santa Ana, CA |
||||||
Total nonfarm |
5,606.90 | 5,611.10 | 5,611.60 | 5,561.90 | -45 | -0.8 |
Natural resources and mining |
5 | 5 | 5 | 5 | 0 | 0 |
Construction |
267.1 | 246.7 | 248.7 | 248.6 | -18.5 | -6.9 |
Manufacturing |
627.2 | 619.7 | 619.4 | 616.9 | -10.3 | -1.6 |
Trade, transportation, and utilities |
1,096.50 | 1,080.60 | 1,082.30 | 1,085.40 | -11.1 | -1 |
Information |
239.6 | 234.6 | 234.9 | 231.9 | -7.7 | -3.2 |
Financial activities |
374 | 354.5 | 354.7 | 352.7 | -21.3 | -5.7 |
Professional and business services |
877.8 | 872.6 | 874.9 | 872.2 | -5.6 | -0.6 |
Education and health services |
614.3 | 646.5 | 637.3 | 628.4 | 14.1 | 2.3 |
Leisure and hospitality |
580.5 | 577.4 | 581.1 | 583.2 | 2.7 | 0.5 |
Other services |
194.8 | 197.7 | 198.5 | 196.7 | 1.9 | 1 |
Government |
730.1 | 775.8 | 774.8 | 740.9 | 10.8 | 1.5 |
New York-Northern New Jersey-Long Island, NY-NJ-PA |
||||||
Total nonfarm |
8,608.30 | 8,646.10 | 8,706.30 | 8,637.50 | 29.2 | 0.3 |
Natural resources, mining, and construction |
374.8 | 368.2 | 374.1 | 376.2 | 1.4 | 0.4 |
Manufacturing |
450.4 | 435.1 | 435.9 | 430.8 | -19.6 | -4.4 |
Trade, transportation, and utilities |
1,604.30 | 1,614.00 | 1,628.30 | 1,605.70 | 1.4 | 0.1 |
Information |
289.5 | 294.5 | 296 | 296.6 | 7.1 | 2.5 |
Financial activities |
808.7 | 788.1 | 793.4 | 794.7 | -14 | -1.7 |
Professional and business services |
1,319.90 | 1,305.00 | 1,323.20 | 1,323.10 | 3.2 | 0.2 |
Education and health services |
1,413.90 | 1,472.10 | 1,459.80 | 1,437.60 | 23.7 | 1.7 |
Leisure and hospitality |
687.9 | 672.9 | 694.9 | 700.8 | 12.9 | 1.9 |
Other services |
373.6 | 377.3 | 381.2 | 377.9 | 4.3 | 1.2 |
Government |
1,285.30 | 1,318.90 | 1,319.50 | 1,294.10 | 8.8 | 0.7 |
Chicago-Naperville-Joliet, IL-IN-WI |
||||||
Total nonfarm |
4,591.30 | 4,585.30 | 4,612.70 | 4,593.00 | 1.7 | 0 |
Natural resources and mining |
2.5 | 2.5 | 2.5 | 2.5 | 0 | 0 |
Construction |
226.8 | 213.5 | 217.7 | 218.4 | -8.4 | -3.7 |
Manufacturing |
483.3 | 478.8 | 480.3 | 477.9 | -5.4 | -1.1 |
Trade, transportation, and utilities |
928.5 | 935.2 | 939.5 | 934.9 | 6.4 | 0.7 |
Information |
91.6 | 91.1 | 91.5 | 91.3 | -0.3 | -0.3 |
Financial activities |
332.5 | 325 | 327.1 | 327 | -5.5 | -1.7 |
Professional and business services |
752.2 | 749.1 | 758.5 | 757 | 4.8 | 0.6 |
Education and health services |
585.5 | 601.6 | 597.4 | 593.3 | 7.8 | 1.3 |
Leisure and hospitality |
424.9 | 413.8 | 424.3 | 425.2 | 0.3 | 0.1 |
Other services |
205.1 | 197 | 200.6 | 204.4 | -0.7 | -0.3 |
Government |
557.9 | 577.7 | 573.3 | 561.1 | 3.2 | 0.6 |
Washington-Arlington-Alexandria, DC-VA-MD-WV |
||||||
Total nonfarm |
2,991.80 | 3,026.00 | 3,044.30 | 3,027.20 | 35.4 | 1.2 |
Natural resources, mining, and construction |
188.9 | 181.7 | 183.9 | 183.8 | -5.1 | -2.7 |
Manufacturing |
62.9 | 61.1 | 61.8 | 61.8 | -1.1 | -1.7 |
Trade, transportation, and utilities |
405.4 | 403.6 | 407.4 | 406 | 0.6 | 0.1 |
Information |
94.2 | 91.7 | 92.3 | 92.5 | -1.7 | -1.8 |
Financial activities |
160.3 | 156.3 | 157.2 | 156.7 | -3.6 | -2.2 |
Professional and business services |
683.9 | 688.4 | 695.1 | 695.5 | 11.6 | 1.7 |
Education and health services |
318.3 | 337.4 | 333.6 | 327.9 | 9.6 | 3 |
Leisure and hospitality |
265.6 | 257.6 | 265.9 | 266.5 | 0.9 | 0.3 |
Other services |
182 | 186.3 | 188.7 | 189.2 | 7.2 | 4 |
Government |
630.3 | 661.9 | 658.4 | 647.3 | 17 | 2.7 |
Dallas-Fort Worth-Arlington, TX |
||||||
Total nonfarm |
2,932.60 | 3,005.50 | 3,015.40 | 3,000.60 | 68 | 2.3 |
Natural resources, mining, and construction |
188.6 | 194.8 | 198.9 | 199.7 | 11.1 | 5.9 |
Manufacturing |
298.2 | 294.6 | 295.1 | 295.1 | -3.1 | -1 |
Trade, transportation, and utilities |
621 | 628.1 | 631.1 | 631.8 | 10.8 | 1.7 |
Information |
89.6 | 89.4 | 90.2 | 88.5 | -1.1 | -1.2 |
Financial activities |
234.6 | 237 | 238.3 | 237.8 | 3.2 | 1.4 |
Professional and business services |
442.5 | 444.7 | 446.5 | 449.7 | 7.2 | 1.6 |
Education and health services |
314.4 | 330.9 | 328.4 | 329.9 | 15.5 | 4.9 |
Leisure and hospitality |
284.8 | 292.1 | 295.8 | 293.5 | 8.7 | 3.1 |
Other services |
108.1 | 109.9 | 111.8 | 110.3 | 2.2 | 2 |
Government |
350.8 | 384 | 379.3 | 364.3 | 13.5 | 3.8 |
Philadelphia-Camden-Wilmingon, PA-NJ-DE-MD |
||||||
Total nonfarm |
2,807.10 | 2,835.90 | 2,839.30 | 2,808.80 | 1.7 | 0.1 |
Natural resources, mining, and construction |
132.7 | 126.6 | 128.7 | 129.9 | -2.8 | -2.1 |
Manufacturing |
221.4 | 215.9 | 217.4 | 215.7 | -5.7 | -2.6 |
Trade, transportation, and utilities |
531 | 530 | 531.5 | 529 | -2 | -0.4 |
Information |
57.5 | 57.5 | 57.6 | 57.5 | 0 | 0 |
Financial activities |
222.5 | 216.8 | 217.6 | 218.4 | -4.1 | -1.8 |
Professional and business services |
433.6 | 434.8 | 437.5 | 437 | 3.4 | 0.8 |
Education and health services |
518 | 536.8 | 527.6 | 526.6 | 8.6 | 1.7 |
Leisure and hospitality |
232.4 | 231.1 | 236.7 | 234.7 | 2.3 | 1 |
Other services |
125.5 | 125.2 | 126.2 | 125.8 | 0.3 | 0.2 |
Government |
332.5 | 361.2 | 358.5 | 334.2 | 1.7 | 0.5 |
Miami-Fort Lauderdale-Pompano Beach, FL |
||||||
Total nonfarm |
2,375.00 | 2,431.10 | 2,395.90 | 2,363.80 | -11.2 | -0.5 |
Natural resources and mining |
0.7 | 0.7 | 0.7 | 0.7 | 0 | 0 |
Construction |
156.5 | 143.2 | 143 | 140.1 | -16.4 | -10.5 |
Manufacturing |
95.9 | 93.7 | 93.3 | 91.9 | -4 | -4.2 |
Trade, transportation, and utilities |
540.1 | 542.4 | 542.6 | 537.6 | -2.5 | -0.5 |
Information |
52 | 51.3 | 51.3 | 51.1 | -0.9 | -1.7 |
Financial activities |
180 | 174.9 | 175.4 | 174.4 | -5.6 | -3.1 |
Professional and business services |
393.9 | 393.8 | 392.6 | 391.2 | -2.7 | -0.7 |
Education and health services |
312.9 | 329.9 | 328.7 | 323.8 | 10.9 | 3.5 |
Leisure and hospitality |
246.9 | 262.8 | 260 | 250.3 | 3.4 | 1.4 |
Other services |
99.6 | 102.7 | 102.8 | 101.3 | 1.7 | 1.7 |
Government |
296.5 | 335.7 | 305.5 | 301.4 | 4.9 | 1.7 |
Boston-Cambridge-Quincy, MA-NH |
||||||
Total nonfarm |
2,482.30 | 2,513.50 | 2,529.20 | 2,501.20 | 18.9 | 0.8 |
Natural resources and mining |
1.1 | 1.2 | 1.2 | 1.2 | 0.1 | 9.1 |
Construction |
105.6 | 98.8 | 102.2 | 103.3 | -2.3 | -2.2 |
Manufacturing |
222.3 | 219.7 | 221.1 | 219.7 | -2.6 | -1.2 |
Trade, transportation, and utilities |
417.7 | 416.7 | 421.9 | 417.1 | -0.6 | -0.1 |
Information |
75.3 | 74.8 | 75.3 | 75.1 | -0.2 | -0.3 |
Financial activities |
191.6 | 187.6 | 189.9 | 190.3 | -1.3 | -0.7 |
Professional and business services |
414.6 | 417.4 | 422.9 | 422.5 | 7.9 | 1.9 |
Education and health services |
455.1 | 475.5 | 465.1 | 466 | 10.9 | 2.4 |
Leisure and hospitality |
229.3 | 223.5 | 234.2 | 233.6 | 4.3 | 1.9 |
Other services |
91.1 | 88.4 | 90 | 90.9 | -0.2 | -0.2 |
Government |
278.6 | 309.9 | 305.4 | 281.5 | 2.9 | 1 |
Houston-Sugar Land-Baytown, TX |
||||||
Total nonfarm |
2,550.00 | 2,606.10 | 2,619.10 | 2,607.10 | 57.1 | 2.2 |
Natural resources and mining |
85.5 | 89.2 | 90.4 | 91 | 5.5 | 6.4 |
Construction |
197.3 | 201.9 | 203.5 | 202.8 | 5.5 | 2.8 |
Manufacturing |
234.9 | 235.7 | 237.4 | 236.7 | 1.8 | 0.8 |
Trade, transportation, and utilities |
521.2 | 525.4 | 530.1 | 530.2 | 9 | 1.7 |
Information |
36.9 | 36.9 | 37.1 | 36.9 | 0 | 0 |
Financial activities |
145.9 | 146.1 | 147.7 | 148.6 | 2.7 | 1.9 |
Professional and business services |
385.9 | 388.3 | 392.5 | 394.3 | 8.4 | 2.2 |
Education and health services |
280.7 | 291.2 | 291.2 | 290.9 | 10.2 | 3.6 |
Leisure and hospitality |
233.5 | 235.4 | 239.6 | 238.6 | 5.1 | 2.2 |
Other services |
94.4 | 96.2 | 97.7 | 96.7 | 2.3 | 2.4 |
Government |
333.8 | 359.8 | 351.9 | 340.4 | 6.6 | 2 |
Atlanta-Sandy Springs-Marietta, GA |
||||||
Total nonfarm |
2,445.70 | 2,479.10 | 2,467.90 | 2,440.40 | -5.3 | -0.2 |
Natural resources and mining |
2.5 | 2.5 | 2.4 | 2.4 | -0.1 | -4 |
Construction |
139.9 | 139.5 | 137.9 | 135.8 | -4.1 | -2.9 |
Manufacturing |
175.5 | 173.1 | 172.1 | 169.4 | -6.1 | -3.5 |
Trade, transportation, and utilities |
562.4 | 565 | 565 | 560.7 | -1.7 | -0.3 |
Information |
87.4 | 88.7 | 88.9 | 88.5 | 1.1 | 1.3 |
Financial activities |
163.4 | 161 | 160.4 | 159.7 | -3.7 | -2.3 |
Professional and business services |
410.5 | 409.1 | 409.9 | 408.8 | -1.7 | -0.4 |
Education and health services |
249.9 | 260.9 | 258.5 | 257.2 | 7.3 | 2.9 |
Leisure and hospitality |
239.6 | 243.6 | 244.8 | 241.5 | 1.9 | 0.8 |
Other services |
99.5 | 99.3 | 100.1 | 99.8 | 0.3 | 0.3 |
Government |
315.1 | 336.4 | 327.9 | 316.6 | 1.5 | 0.5 |
Detroit-Warren-Livonia, MI |
||||||
Total nonfarm |
1,931.10 | 1,946.40 | 1,954.30 | 1,894.40 | -36.7 | -1.9 |
Natural resources, mining, and construction |
77.3 | 65.1 | 66.8 | 68 | -9.3 | -12 |
Manufacturing |
238.8 | 238.5 | 243.2 | 225.1 | -13.7 | -5.7 |
Trade, transportation, and utilities |
363.9 | 363 | 363.9 | 359 | -4.9 | -1.3 |
Information |
34.3 | 33.1 | 33.1 | 32.9 | -1.4 | -4.1 |
Financial activities |
113.2 | 109.9 | 110.2 | 109.5 | -3.7 | -3.3 |
Professional and business services |
347.4 | 347.1 | 348.8 | 341.4 | -6 | -1.7 |
Education and health services |
274.4 | 285 | 283.9 | 281.5 | 7.1 | 2.6 |
Leisure and hospitality |
188.5 | 186.8 | 189.7 | 186.6 | -1.9 | -1 |
Other services |
89 | 86.6 | 87.2 | 86.5 | -2.5 | -2.8 |
Government |
204.3 | 231.3 | 227.5 | 203.9 | -0.4 | -0.2 |
Last Modified Date: September 18, 2008