
The NOAA Ozone Depleting Gas Index:
Guiding Recovery of the Ozone Layer
NOAA Earth System Research Laboratory, R/GMD, 325 Broadway, Boulder, CO 80305-3328
Stephen.A.Montzka@noaa.gov
David.J.Hofmann@noaa.gov
The stratospheric ozone layer, through absorption of solar ultraviolet radiation, protects all biological systems on Earth. In response to concerns over the depletion of the global ozone layer, the Clean Air Act, as amended in 1990, mandates NASA and NOAA to monitor stratospheric ozone and ozone-depleting substances.
|
****************************************************************************
SEC. 603. MONITORING AND REPORTING REQUIREMENTS (d) Monitoring and Reporting to Congress |
This information is critical for assessing if the international Montreal Protocol on Substances that Deplete the Ozone Layer is having its intended effect of mitigating increases in harmful ultraviolet radiation. In order to provide the information necessary to satisfy this congressional mandate, both NASA and NOAA have instituted and maintained global monitoring programs to keep track of ozone-depleting gases as well as ozone itself. While data collected for the past 30 years has been used extensively in international assessments of ozone layer depletion science, the language of scientists often eludes the average citizen who has a considerable interest in the health of the Earth’s protective ultraviolet radiation shield. Are the ozone-destroying chemicals declining in the atmosphere? When do we expect the ozone hole above Antarctica to disappear? Will the recovery be different for the ozone layer above mid-latitudes? In order to make the answers to these questions easier to understand, NOAA has developed an index, the Ozone Depleting Gas Index (ODGI). This index is derived from atmospheric measurements of chemicals that contain chlorine and bromine at multiple remote surface sites across the globe (see the map in Figure 1). It is defined as 100 at the peak in ozone depleting halogen abundance as determined by NOAA observations, and zero for the level corresponding to when recovery of the ozone layer might be expected, based on past data and future projections from international assessments.
Two different indices are calculated, one that is relevant for the ozone hole over Antarctica (the ODGI-A), and one that is relevant for the ozone layer at mid-latitudes (the ODGI-ML). While both indices are derived from NOAA measurements of halocarbon abundances at Earth’s surface, separate indices for these different stratospheric regions are necessary to account for the unique nature of the Antarctic stratosphere compared to the stratosphere at mid-latitudes in both hemispheres. Though an index for the Arctic stratosphere is not described, it is likely that its value would lie between the mid-latitude and Antarctic ODGI in any given year.
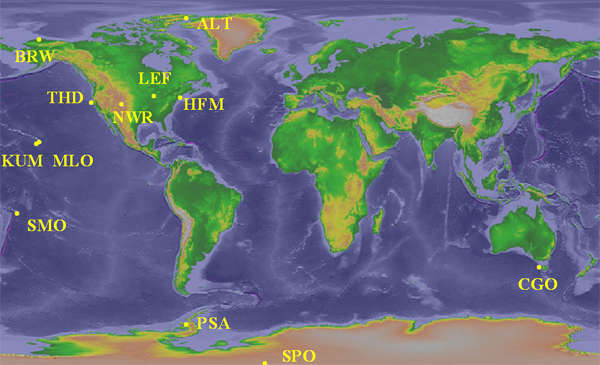 Figure 1.
The subset of locations across the Earth’s surface where regular measurements of the atmospheric abundance of ozone-depleting gases are conducted by NOAA/ESRL and used to derive hemispheric and global surface means. The chemicals are listed in the Tables.
Figure 1.
The subset of locations across the Earth’s surface where regular measurements of the atmospheric abundance of ozone-depleting gases are conducted by NOAA/ESRL and used to derive hemispheric and global surface means. The chemicals are listed in the Tables.
Observations of Ozone Depleting Gases
The ODGI is estimated directly from observations at Earth’s surface of the most abundant long-lived, chlorine and bromine containing gases regulated by the Montreal Protocol (15 individual chemicals). These ongoing surface-based observations provide a measure of the total number of chlorine and bromine atoms in the atmosphere that are likely to reach the stratosphere and contribute to ozone depletion in the near future. Because air reaching the Antarctic stratosphere has been isolated from the troposphere for a long period (~6 years on average), nearly all of the halocarbons reaching the Antarctic stratosphere during springtime have degraded to inorganic forms that are potential ozone-depleting agents. When the enhanced efficiency of bromine to destroy ozone compared to chlorine is also considered, this total halogen amount is called the Equivalent Chlorine (ECl) burden of the atmosphere (Montzka et al., 1996).
The calculation of the ODGI for mid-latitudes of both hemispheres is different than for Antarctica primarily because air in the mid-latitude stratosphere has a younger mean ‘stratospheric age’ (~3 years) compared to air above Antarctica. As a result, halocarbons in the mid-latitude stratosphere have had less time to become degraded by high-energy solar radiation. By accounting for compound-dependent degradation rates in the stratosphere, a younger mean stratospheric air age, and the enhanced efficiency for bromine to destroy ozone compared to chlorine, a quantity known as the Equivalent Effective Chlorine (EECl) can be derived to represent how the burden of ozone-depleting halogenated gases is changing in the mid-latitude stratosphere (Daniel et al., 1995; Montzka et al., 1996).
Figure 2 shows ECl (for Antarctica) and EECl (for midlatitudes) vs time calculated primarily from NOAA’s surface-based measurements and compares them with future projections provided by the 2007 WMO/UNEP Scientific Assessment of Ozone Depletion baseline scenario (Daniel et al., 2007). Different lag times have been applied to observed and projected tropospheric changes (indicated as solid lines and points) to approximate stratospheric changes in different regions (dashed lines). While a lag time of 6 years is used here to account for the time it takes for gases at Earth’s surface to reach the Antarctic stratosphere, a mean lag of about 3 years is more appropriate when considering air transport to the stratosphere at mid-latitudes.
 Figure 2.
The Equivalent Chlorine (ECl-upper curve) and Equivalent Effective Chlorine (EECl-lower curve) levels in the lower atmosphere, including both chlorine and bromine compounds, as a function of time showing NOAA measurements (points) and projections for the future provided by 2007 WMO/UNEP scenarios (full curves), which assume that regulations of the Montreal Protocol will be followed in the future (Daniel et al., 2007). Approximate stratospheric changes, based upon these lagged tropospheric observations and scenario projections, are shown for mid latitudes and Antarctica (dashed curves). The down-pointing arrows represent the estimated dates that ECl and EECl in the stratosphere return to levels present in1980, which is before large ozone depletion was observed in both these regions.
Figure 2.
The Equivalent Chlorine (ECl-upper curve) and Equivalent Effective Chlorine (EECl-lower curve) levels in the lower atmosphere, including both chlorine and bromine compounds, as a function of time showing NOAA measurements (points) and projections for the future provided by 2007 WMO/UNEP scenarios (full curves), which assume that regulations of the Montreal Protocol will be followed in the future (Daniel et al., 2007). Approximate stratospheric changes, based upon these lagged tropospheric observations and scenario projections, are shown for mid latitudes and Antarctica (dashed curves). The down-pointing arrows represent the estimated dates that ECl and EECl in the stratosphere return to levels present in1980, which is before large ozone depletion was observed in both these regions.
Click on image to view full size figure.
The Ozone Depleting Gas Index (ODGI)
The ODGI is an index defined by scaling the ECl or EECl amount measured in the lower atmosphere. It is defined here as being 100 at the time that NOAA’s surface-based observations indicated a maximum in ECl or EECl (1994). For Antarctica, the zero point of the scale is defined as the approximate ECl level in the Antarctic stratosphere when the Antarctic ozone hole first became easily detectable, about 2170 ppt (parts per trillion) ECl in about 1980, which is the ECl level when full recovery of the ozone hole is expected, all other factors being constant (Figure 2). On this scale, the value of ODGI-A in 2007 was about 86 i.e., we have progressed about 14% (i.e., 100-86) of the way along the path toward a stratospheric halogen level that should allow an ozone-hole-free Antarctic stratosphere. The latter has been projected to occur sometime in the 2080 range (Newman et al., 2006), as indicated by the recent WMO/UNEP Scientific Assessments of Ozone Depletion scenarios (Daniel et al., 2007) and as indicated in Figure 2.
Similar to ODGI-A, the ODGI-ML is defined as 100 at the peak in EECl, and zero at the EECl level corresponding to when recovery might be expected in the mid-latitude stratosphere. Based upon halocarbon abundances inferred for the mid-latitude stratosphere in 1980, we expect this recovery level to be approximately 1825 ppt EECl, or somewhat less than required for full recovery in Antarctica. On this scale, the current value of the ODGI-ML is about 73, i.e., we have progressed about 27% of the way along the path toward a stratospheric halogen level that would allow a normal ozone layer in mid-latitudes, all other factors being constant. The latter has been projected to occur in mid-latitudes sometime around the 2050 range as indicated in Figure 2. The progression of the ODGI since measurements began in 1992 is shown in Figure 3.

Figure 3. The Ozone Depleting Gas Indices (ODGI) vs time calculated for both Antarctica and mid-latitudes. While the ODGIs represent changes in the troposphere, actual stratospheric changes lag those shown here by 3 years in mid-latitudes and by 6 years above Antarctica, on average.
Click on image to view full size figure.
 Figure 4.
The contribution to Equivalent Chlorine (ECl) by all long-lived chlorine- and bromine-containing gases.
Figure 4.
The contribution to Equivalent Chlorine (ECl) by all long-lived chlorine- and bromine-containing gases.
Click on image to view full size figure.
In order to identify which gases have been primarily responsible for the decline in ECl to date, Table 1 and Figure 4 delineate the contributions of individual gases to ECl. Table 2 and Figure 5 give similar data for EECl. Of the ozone depleting gases restricted by the Montreal Protocol, the NOAA results show that nearly all were decreasing in the atmosphere by 2006. The notable exceptions include some halons (bromine-containing compounds used mainly in fire extinguishers) and HCFCs, which are used as replacements for CFCs in many applications. It is clear from Figures 4 and 5 that most of the decline in ECl and EECl has been due to the relatively rapid phase out and atmospheric decline of shorter-lived chemicals such as methyl chloroform (CH3CCl3) and methyl bromide (Montzka et al., 2003). The decline related to CFC-11 and CFC-12, the two major ECl and EECl components, has been less dramatic. Though emissions of these two CFCs have declined substantially over the past 15 years, their atmospheric decay has been slow because their lifetimes are very long (50-100 years). Methyl bromide and methyl chloride (CH3Br, CH3Cl) are unique among ozone-depleting gases because they have substantial natural sources. Despite the large natural source of CH3Br, its mixing ratio has declined each year since 1998, when reported total human industrial production was reduced owing to the Montreal Protocol restrictions. Some halons continue to increase slowly in the atmosphere because of large banks or reserves that are slowly being emitted to the atmosphere. Though HCFC’s continue to increase and production is not scheduled for a complete phase-out until 2040, they currently contribute relatively little (~5% or less) to the atmospheric burden of ECl and EECl.
 Figure 5.
The contribution to Equivalent Effective Chlorine (EECl) by all long-lived chlorine- and bromine-containing gases.
Figure 5.
The contribution to Equivalent Effective Chlorine (EECl) by all long-lived chlorine- and bromine-containing gases.
Click on image to view full size figure.
While the Montreal Protocol on Substances that Deplete the Ozone Layer must be considered a huge success and a model for future efforts to stem climate change, ozone layer recovery is expected only with sustained declines in atmospheric chlorine and bromine in future years and continued adherence to the production and consumption restrictions outlined in the Protocol. Recovery of the ozone layer is expected as the ODGI approaches zero, though the timing of complete ozone layer recovery is difficult to determine exactly because other chemical and physical factors such as climate change also influence stratospheric ozone abundances and the efficiency for chlorine and bromine to destroy stratospheric ozone.
The ODGI-A and ODGI-ML represent important components of NOAA’s effort to guide the recovery of the ozone hole over Antarctica and the mid-latitude ozone layer. These indices provide a means by which adherence to international protocols can be assessed and they allow the public and policy makers to discern if policy measures are having their desired effect. Because ozone depletion is still near its peak, continued monitoring of ozone and ozone depleting gases is critical for ensuring that the recovery proceeds as expected through the 21st century.
| WMO | ECl | ODGI | ||||||||||
|---|---|---|---|---|---|---|---|---|---|---|---|---|
| Year | CFC-12 | CFC-11 | CH3Cl | CH3Br | CCl4 | CH3CCl3 | halons | CFC-113 | HCFCs | Minor | SUM (ppt) | Antarctic |
| 1992 | 1007 | 813 | 550 | 542 | 424 | 405 | 302 | 241 | 106 | 87 | 4476 | 97.6 |
| 1993 | 1022 | 816 | 550 | 542 | 421 | 387 | 323 | 246 | 111 | 91 | 4508 | 99.0 |
| 1994 | 1035 | 816 | 550 | 542 | 419 | 355 | 348 | 251 | 121 | 95 | 4532 | 100.0 |
| 1995 | 1045 | 814 | 549 | 537 | 416 | 318 | 357 | 252 | 130 | 98 | 4515 | 99.3 |
| 1996 | 1051 | 811 | 543 | 548 | 413 | 277 | 370 | 252 | 140 | 99 | 4504 | 98.8 |
| 1997 | 1057 | 807 | 546 | 544 | 409 | 236 | 380 | 250 | 150 | 100 | 4480 | 97.8 |
| 1998 | 1061 | 801 | 561 | 561 | 408 | 198 | 391 | 248 | 159 | 100 | 4488 | 98.1 |
| 1999 | 1064 | 793 | 562 | 544 | 405 | 165 | 403 | 247 | 169 | 99 | 4451 | 96.6 |
| 2000 | 1068 | 788 | 550 | 524 | 401 | 137 | 411 | 246 | 178 | 98 | 4401 | 94.5 |
| 2001 | 1070 | 782 | 541 | 498 | 397 | 114 | 414 | 244 | 188 | 96 | 4345 | 92.1 |
| 2002 | 1071 | 777 | 541 | 489 | 392 | 95 | 419 | 243 | 197 | 94 | 4318 | 90.9 |
| 2003 | 1071 | 770 | 542 | 487 | 389 | 80 | 423 | 240 | 205 | 93 | 4299 | 90.1 |
| 2004 | 1071 | 764 | 540 | 475 | 385 | 66 | 430 | 238 | 211 | 91 | 4270 | 88.9 |
| 2005 | 1069 | 757 | 541 | 468 | 380 | 55 | 432 | 236 | 219 | 89 | 4246 | 87.8 |
| 2006 | 1065 | 748 | 542 | 456 | 374 | 46 | 433 | 235 | 227 | 87 | 4215 | 86.6 |
| 2007 | 1061 | 741 | 545 | 457 | 369 | 38 | 433 | 232 | 238 | 85 | 4201 | 85.9 |
| WMO | ECl | ODGI | ||||||||||
|---|---|---|---|---|---|---|---|---|---|---|---|---|
| Year | CFC-12 | CFC-11 | CH3Cl | CH3Br | CCl4 | CH3CCl3 | halons | CFC-113 | HCFCs | Minor | SUM (ppt) | Mid-Latitude |
| 1992 | 483 | 650 | 352 | 485 | 359 | 350 | 227 | 144 | 30 | 55 | 3137 | 98.5 |
| 1993 | 490 | 653 | 352 | 485 | 357 | 334 | 243 | 147 | 32 | 58 | 3151 | 99.6 |
| 1994 | 497 | 653 | 352 | 485 | 355 | 307 | 260 | 151 | 35 | 61 | 3156 | 100.0 |
| 1995 | 502 | 651 | 351 | 481 | 353 | 274 | 268 | 151 | 38 | 63 | 3134 | 98.3 |
| 1996 | 505 | 649 | 348 | 491 | 350 | 240 | 279 | 151 | 42 | 64 | 3118 | 97.2 |
| 1997 | 507 | 646 | 350 | 487 | 347 | 204 | 288 | 150 | 46 | 64 | 3091 | 95.1 |
| 1998 | 509 | 641 | 359 | 502 | 346 | 171 | 297 | 149 | 50 | 64 | 3088 | 94.9 |
| 1999 | 511 | 634 | 359 | 487 | 343 | 143 | 306 | 148 | 54 | 63 | 3049 | 91.9 |
| 2000 | 513 | 630 | 352 | 470 | 340 | 119 | 312 | 147 | 58 | 62 | 3003 | 88.5 |
| 2001 | 514 | 626 | 346 | 446 | 336 | 99 | 316 | 147 | 61 | 61 | 2951 | 84.5 |
| 2002 | 514 | 621 | 346 | 438 | 332 | 82 | 320 | 146 | 64 | 59 | 2923 | 82.4 |
| 2003 | 514 | 616 | 347 | 436 | 330 | 69 | 323 | 144 | 67 | 58 | 2904 | 81.0 |
| 2004 | 514 | 611 | 346 | 426 | 326 | 57 | 327 | 143 | 69 | 56 | 2875 | 78.8 |
| 2005 | 513 | 605 | 346 | 419 | 322 | 48 | 328 | 142 | 72 | 55 | 2850 | 76.9 |
| 2006 | 511 | 599 | 347 | 409 | 317 | 40 | 328 | 141 | 75 | 53 | 2820 | 74.6 |
| 2007 | 509 | 593 | 349 | 409 | 313 | 33 | 327 | 139 | 78 | 51 | 2803 | 73.4 |
Notes: “Halons” represents the aggregate of H-1211 and H-1301; “HCFCs” represents the aggregate of HCFC-22, HCFC-141b, and HCFC-142b; “WMO minor” represents CFC-114, CFC-115, halon 2402 and halon 1201 (Daniel et al., 2007).
Acknowledgements
We gratefully acknowledge all those involved in sampling and analysis of air samples both within NOAA and within the cooperative air sampling network. We particularly thank Geoff Dutton for the highly precise data for CFC-11, CFC-12, and CCl4 and Brad Hall for his attention to detail in preparation and maintenance of accurate standard scales for these trace gases. This research was supported by the NOAA Climate Program Office.
References
Daniel, J.S., S. Solomon, and D.L. Albritton, On the evaluation of halocarbon radiative forcing and global warming potentials, J. Geophys. Res., 100, 1271-1285, 1995.
Daniel, J.S., G.J.M. Velders, A.R. Douglass, P.M.D. Forster, D.A. Hauglustaine, I.S.A. Isaksen, L.J.M. Kuijpers, A. McCulloch, T.J. Wallington, Halocarbon Scenarios, Ozone Depletion Potentials, and Global Warming Potentials, Chapter 8 in Scientific Assessment of Ozone Depletion: 2006, Global Ozone Research and Monitoring Project—Report No. 50, World Meteorological Organization, Geneva, 2007.
Montzka, S.A., J.H. Butler, R.C. Myers, T.M. Thompson, T.H. Swanson, A.D. Clarke, L.T. Lock, J.W. Elkins, Decline in the tropospheric abundance of halogen from halocarbons: Implications for stratospheric ozone depletion, Science, 272, 1318-1322, 1996
Montzka, S.A, J.H. Butler, B.D. Hall, J.W. Elkins, D.J. Mondeel, A decline in tropospheric organic bromine, Geophy. Res. Lett., 30(15), 1826, doi:10.1029/2003GL017745, 2003.
Newman, P.A., E.R. Nash, S.R. Kawa, S.A. Montzka, and S.M. Schauffler, When will the Antarctic ozone hole recover? Geophys. Res. Lett., 33, L12814, doi:10.1029/2005GL025232, 2006.