![[NCEP Logo]](https://webarchive.library.unt.edu/eot2008/20080916174158im_/http://www.nhc.noaa.gov/graphics/ncep.gif)
Text-only version
(printer friendly)
TROPICAL CYCLONE REPORTS
Tropical Storm Allison
Tropical Depression Two
Tropical Storm Barry
Tropical Storm Chantal
Tropical Storm Dean
Hurricane Erin
Hurricane Felix
Hurricane Gabrielle
Tropical Depression Nine
Hurricane Humberto
Hurricane Iris
Tropical Storm Jerry
Hurricane Karen
Tropical Storm Lorenzo
Hurricane Michelle
Hurricane Noel
Hurricane Olga
|
Tropical Cyclone Report
Tropical Storm Barry
2 - 7 August 2001
Jack Beven
National Hurricane Center
20 November 2001
Revised: 22 April 2002
Barry was a strong tropical storm that caused minor damage in
the western Florida Panhandle.
a. Synoptic history
Barry formed from a tropical wave that moved westward from the
coast of Africa on 24 July. The wave moved westward across the
tropical Atlantic with little development until the
28th, when convection started increasing just east of
the Lesser Antilles. The system moved into the eastern Caribbean
Sea on 29 July accompanied by poorly organized thunderstorms and
gusty winds. Convection continued increasing on 30-31 July as the
wave moved west-northwestward through the Caribbean. It moved into
the southeastern Gulf of Mexico on 1 August, accompanied by
widespread heavy rains over southern Florida and western Cuba.
A broad 1014 mb low formed along the wave near Dry Tortugas,
Florida late on 1 August. The low moved northwestward and
intensified. An Air Force Reserve Hurricane Hunter aircraft reached
the center at 1829 UTC 2 August and found that the system had
become Tropical Storm Barry. A large area of tropical storm winds
existed north and east of the center, primarily due to interaction
with a strong surface ridge. Post-analysis suggests that the low
had become a tropical depression about 6 h earlier approximately
175 n mi west-northwest of Key West, Florida (Figure 1 and
Table 1).
Barry may not have been fully tropical when it formed, because
an upper level low was over the surface center. However,
southwesterly upper level flow moved the upper low moved
northeastward while Barry moved west-northwestward due to the ridge
over the United States. This shear, combined with falling external
surface pressures as the ridge weakened, caused it to weaken to a
depression early on 4 August. Barry then remained in a generally
unfavorable environment until early on the 5th. The
weakening ridge caused the steering currents to collapse, and Barry
slowed to a west-southwestward drift on the 3rd. This
was followed by a general northeastward drift on the
4th.
Flow around a mid/upper level low dropping southward into the
western Gulf states caused Barry to turn northward and accelerate
on 5 August. Concentrated convection formed near the center early
that day and this led to another significant burst of
intensification. The central pressure fell from 1004 mb to 990 mb
in 7 h as the organization of the system improved dramatically in
satellite and radar imagery. Although the strengthening was
short-lived, it made Barry a 60 kt cyclone. This intensity was
maintained through landfall near Santa Rosa Beach, FL at 0500 UTC 6
August. Figure 2 is a reflectivity image from the Eglin Air Force
Base (AFB) radar an hour before landfall showing that Barry was
forming an eye and had strong convection in the northern
eyewall.
The cyclone turned northwestward and weakened rapidly after
landfall. It became a tropical depression over southern Alabama
later on the 6th and further weakened to a low pressure
area near Memphis, TN the next day. The remnant low dissipated over
southeastern Missouri on the 8th.
b. Meteorological statistics
Table 1 shows the best track positions and intensities for
Barry, with the track plotted in Figure 1.
Figure 3 and Figure 4 depict
the curves of minimum central sea-level pressure and maximum
sustained one-minute average "surface" (10 m above ground level)
winds, respectively, as functions of time. These figures also
contain the data on which the curves are based: aircraft
reconnaissance and dropsonde data from the Air Force Reserve
Hurricane Hunters, satellite-based Dvorak technique intensity
estimates from the Tropical Analysis and Forecast Branch (TAFB),
the Satellite Analysis Branch (SAB) of the National Environmental
Satellite Data and Information Service (NESDIS), and the Air Force
Weather Agency, and estimates from synoptic data.
The Air Force Reserve Hurricane Hunters made 35 center "fixes"
during Barry. The maximum flight level winds reported by the
aircraft were 71 kt just after the center made landfall.
Additionally, an eyewall dropsonde measured 61 kt surface winds at
1847 UTC on the 5th. The maximum surface winds reported
by an official land station were 42 kt with gusts to 69 kt at
station C-72 of the Eglin AFB mesonet. Additional selected surface
observations from official stations are included in
Table 2.
Shortly after landfall, an unofficial observation from Seagrove
Beach, FL reported a 3-minute average wind of 82 kt with gusts to
93 kt. This and the 71 kt flight-level wind suggested the
possibility that Barry had reached hurricane strength just as it
was making landfall. No official observations supported the
Seagrove Beach data, so several efforts were made to verify its
validity:
First, personnel from the NWS Forecast Office in Mobile, AL
investigated the Seagrove Beach report. They indicate that the wind
damage in the area was far less than what would be expected for the
reported winds. This casts some doubt as to the accuracy of the
data.
Second, additional analysis was conducted by the Hurricane
Research Division using the HWIND system on the aircraft and
surface data. The analysis yielded a maximum sustained wind at
landfall of 62 kt.
Third, the WSR-88D radar at Eglin Air Force Base indicated
hurricane-force winds about 1500 ft above the surface as Barry
approached the coast. Unfortunately, the radar failed about an hour
before landfall, and it is unknown how these winds evolved as the
center reached the coast. The National Hurricane Center (NHC)
conducted post-analysis of the radar wind data using some
experimental algorithms. This was inconclusive as to whether the
hurricane-force winds aloft reached the surface.
Fourth, the NHC sent a request to the public asking for
additional observations from the landfall area. Over 30
supplemental reports were received, with the most significant and
useful included in Table 3.
Several of the wind reports were in the
60-65 kt range with higher gusts, which supports Barry being right
on the threshold of a hurricane. However, the quality of this data
is uncertain due to the mostly unknown accuracy and exposure of the
instruments.
The lowest aircraft-measured pressure was 990 mb at 1154 UTC 5
August and again at landfall. The lowest pressure from an official
station was 994.2 mb from the Eglin AFB mesonet (Table 2). The
supplemental data included a 988.5 mb pressure in Freeport, FL
(Table 3), which was likely in the eastern side of the eye. While
this and a 989.1 mb observation in Destin were slightly lower than
the landfall pressure reported by aircraft, the accuracy of these
supplemental measurements is unknown. Therefore, the best track
landfall pressure will be the 990 mb reported by the aircraft.
Most of the much-appreciated supplemental wind and pressure data
are consistent with the wind and pressure values the NHC determined
from reconnaissance data. However, due to the uncertainties in the
data quality, the data are not quite enough to justify calling
Barry a hurricane at landfall.
The core of Barry missed most ships and buoys. The most
significant marine observation was from buoy 42039, which reported
39 kt sustained winds with gusts to 54 kt and a 1001.5 mb pressure
at 2000 UTC 5 August. An unidentified ship reported 30 kt winds
with gusts to 50 kt over the southeastern Gulf from 0200-1000 UTC 2
August. This, combined with data from the Coastal Marine Automated
Network Station at the Dry Tortugas, provided evidence that the
tropical wave was developing into a tropical cyclone.
Storm surges and tides associated with Barry were 2-3 ft near
the landfall area in Bay and Walton counties. Tides of 2-3 ft above
normal also occurred along portions of the southeast Louisiana
coast in association with the strong winds early in Barry's
life.
Storm total rainfalls were generally 5-9 inches over the Florida
Panhandle near and east of where the center made landfall with 1-4
inches elsewhere in the affected area from southwestern Georgia to
northern Mississippi. The maximum amount from an official station
was 8.91 inches at Tallahassee, FL. Supplemental observations
included 11.00 inches at WJHG-TV in Panama City, FL and 9.57 inches
at Port St. Joe, Fl. These rains caused localized flooding. The
pre-Barry tropical wave produced 3 to 8 inches of rain over
portions of southern Florida with local amounts as high as 13
inches in Martin County. These rains helped relieve long-term
drought conditions in south Florida.
One tornado has been confirmed in association with Barry - an F0 near
Carrabelle, FL. The pre-Barry wave produced F0 tornadoes near Ft. Pierce
and Boynton Beach, FL. All three tornadoes caused minor damage.
c. Casualty and Damage Statistics
Two deaths are directly associated with Barry: one due to a lightning
strike in an outer band near Jacksonville, FL and one drowning in a rip
current at Sanibel Island, FL.
One indirect death occurred in a traffic accident
during rains associated with Barry. Additionally, as the pre-Barry
wave moved over Cuba and the Straits of Florida, associated winds
and seas capsized a boat with Cuban refugees on board. Press
reports indicate that 6 of the 28 passengers drowned.
The American Insurance Services Group estimates insured property
damage from Barry to be $15 million. Applying a 2:1 ratio of total
damage to insured damage, the total damage from Barry is estimated
to be $30 million.
d. Forecast and warning critique
Table 4 shows the average errors during
the tropical storm stage
of Barry for the official NHC track forecast and a selection of
objective guidance models. The NHC errors were 31 (8 forecasts), 49
(5 forecasts), 105 (4 forecasts), 156 (5 forecasts), and 244 n mi
(3 forecasts) for 12, 24, 36, 48, and 72 h respectively. The
average errors were better than the 10-yr (1991-2000) average at
12, 24, and 36 h and worse than both the 10-yr average and
Climatology-Persistence (CLIPER) at 48 and 72 hr. Several of the
objective guidance models had better average errors than the
official forecasts. The most notable was the Aviation model (AVNO),
which was the overall best performer on Barry.
Analysis of the individual official track forecasts indicates
there was a significant westward bias. This resulted from the
belief that the strong deep layer ridge over the central United
States would hold and move Barry westward, possibly with a landfall
in Louisiana. Several later forecasts better anticipated the
strength of the Gulf coast trough and correctly forecast landfall
in the Florida Panhandle.
The official intensity forecast errors were 7, 11, 9, 13, and 7
kt at 12, 24, 36, 48, and 72 h respectively. These errors are near
the 10-yr average at 12 and 24 h and below the 10-yr average at the
other times.
Table 5 shows the watches and warnings issued for Barry.
Hurricane warnings were issued for portions of the northern Gulf
coast in anticipation that Barry's rapid strengthening on the
5th would continue. These were somewhat short-fused with
a lead time of about 16 hours. The early erroneous track forecasts
led to watches and warnings along portions of the Louisiana and
Mississippi coasts that did not verify.
Barry was forecast to become an inland flooding threat after
landfall. However, a faster than expected motion and weakening led
to inland rainfall totals being less than anticipated.
Acknowledgments
Much of the data in this report were provided by the local
National Weather Service forecast offices in Slidell, LA, Mobile,
AL, and Tallahasee, FL. Buoy and C-MAN station data were provided
by the National Data Buoy Center. Many of the supplemental
observations were forwarded to the NHC by Jason Kelley of TV
station WJHG in Panama City, FL. Rich Henning of the Hurricane
Hunters and Eglin Air Force Base contributed other supplemental
observations as well as the Eglin radar data. Bill Frederick
contributed the forecast verification data, and Colin McAdie
analyzed the radar data.
Table 1:
Date/Time
(UTC) | Position | Pressure
(mb) | Wind Speed
(kt) | Stage |
| Lat. (°N) | Lon. (°W) |
| 02 / 1200 | 25.7 | 84.8 | 1011 | 30 | tropical depression |
| 02 / 1800 | 26.2 | 84.9 | 1010 | 45 | tropical storm |
| 03 / 0000 | 26.4 | 85.6 | 1007 | 40 | " |
| 03 / 0600 | 26.6 | 86.3 | 1008 | 35 | " |
| 03 / 1200 | 26.9 | 87.0 | 1007 | 35 | " |
| 03 / 1800 | 26.8 | 87.2 | 1007 | 35 | " |
| 04 / 0000 | 26.7 | 87.5 | 1005 | 30 | tropical depression |
| 04 / 0600 | 26.6 | 87.8 | 1005 | 30 | " |
| 04 / 1200 | 26.9 | 87.7 | 1006 | 30 | " |
| 04 / 1800 | 27.1 | 87.5 | 1005 | 35 | tropical storm |
| 05 / 0000 | 27.3 | 87.3 | 1003 | 35 | " |
| 05 / 0600 | 27.5 | 86.7 | 1004 | 40 | " |
| 05 / 1200 | 28.1 | 86.4 | 990 | 50 | " |
| 05 / 1800 | 28.6 | 86.4 | 991 | 60 | " |
| 06 / 0000 | 29.5 | 86.3 | 992 | 60 | " |
| 06 / 0600 | 30.6 | 86.4 | 991 | 60 | " |
| 06 / 1200 | 31.8 | 86.9 | 1007 | 25 | tropical depression |
| 06 / 1800 | 32.7 | 87.7 | 1009 | 20 | " |
| 07 / 0000 | 33.3 | 88.5 | 1012 | 15 | " |
| 07 / 0600 | 34.0 | 89.1 | 1015 | 15 | remnant low |
| 07 / 1200 | 34.7 | 89.7 | 1017 | 10 | " |
| 07 / 1800 | 35.6 | 89.8 | 1018 | 10 | " |
| 08 / 0000 | 36.6 | 89.9 | 1016 | 10 | " |
| 08 / 0600 | 37.5 | 90.0 | 1017 | 10 | " |
| 08 / 1200 | | | | | dissipated |
| 05 / 1200 | 28.1 | 86.4 | 990 | 50 | minimum pressure |
| 06 / 0500 | 30.4 | 86.3 | 990 | 60 | Landfall at Santa Rosa Beach, Florida |
Table 2: Tropical Storm Barry selected surface observations, 2 - 7 August 2001.
| | Minimum
Sea-level
Pressure | Maximum Surface Wind Speed
(kt) | |
| Location | Date/
Time
(UTC) | Press.
(mb) | Date/
Timea
(UTC) | Sust.
Windb
(kts) | Peak
Gust (kts) | Storm
Surgec
(ft) | Storm
Tided
(ft) | Rain
(storm total)
(in) |
| Alabama |
| Dothan | 06/0736 | 1013.6 | 06/0940 | 21 | 26 | | | 1.22 |
| Evergreen | 06/1032 | 1006.1 | 05/1739 | 20 | 28 | | | 1.23 |
| Fort Rucker | | | | | | | | 3.50 |
| Maxwell AFB | | | | | | | | 3.21 |
| Troy | | | | | | | | 4.05 |
| Florida |
| Apalachicola | 06/0019 | 1011.9 | 06/0739 | 27 | 41 | | | 6.40 |
| Destin# | 06/0449 | 999.3 | 06/0421 | 31 | 42 | | | |
| Crestview | 06/0656 | 996.6 | 06/0603 | 31 | 44 | | | 2.18 |
| Eglin A-5 | | | 06/0450 | 28f | 39 | | | |
| Eglin C-52 | 06/0541 | 994.2 | 06/0525 | 27f | 52 | | | |
| Eglin C-72 | 06/0613 | 995.6 | 06/0535 | 42f | 69 | | | |
| Mary Esther | 06/0555 | 1005.6 | 06/0455 | 24 | 42 | | | 0.71 |
| Panama City Bay Cnty. Aprt. | 06/0141 | 1008.1 | 06/0440 | 26 | 35 | | | 5.19 |
| Panama City Tyndall AFB | 06/0255 | 1009.8 | 05/2350 | 25 | 42 | | | 8.68 |
| Tallahassee | 06/0701 | 1013.5 | 06/0222 | 20 | 26 | | | 8.91 |
| Valparaiso | 06/5555 | 998.6 | 06/0655 | 35e | 55e | | | 3.92 |
| NOAA Buoys and C-MAN Stations |
| Buoy 42003 | 04/1000 | 1009.7 | 05/1400 | 30$ | 39 | | | |
| Buoy 42036 | 05/0800 | 1011.6 | 02/2000 | 29 | 37 | | | |
| Buoy 42039 | 05/2000 | 1001.5 | 05/2000 | 39
| 54 | | | |
| Cape San Blas FL (CSBF1) | 06/0000 | 1009.8 | 30/1400 | 35$ | 44 | | | |
aDate/time is for wind gust when both sustained and gust are listed.
bExcept as noted, sustained wind averaging periods for C-MAN and land-based ASOS reports are
2 min; buoy averaging periods are 8 min.
cStorm surge is water height above normal astronomical tide level.
dStorm tide is water height above National Geodetic Vertical Datum (1929 mean sea level).
eEstimated.
f2 min average
$10 min average
#Incomplete record |
Table 3: Tropical Storm Barry supplemental unofficial surface
observations, 2-7 August 2001.
| | Minimum
Sea-level
Pressure | Maximum Surface Wind Speed
(kt) | |
| Location | Date/
Time
(UTC) | Press.
(mb) | Date/
Timea
(UTC) | Sust.
Windb
(kts) | Peak
Gust (kts) | Storm
Surgec
(ft) | Storm
Tided
(ft) | Rain
(storm total)
(in) |
| Alabama |
| Andalusia | | | | | | 3.12 | | |
| Florala | | | | | | 3.48 | | |
| Red Level | 06/0930 | 1003.0 | 06/0818 | | 34 | 3.00 | | |
| Florida |
| Callaway | | | | | | 7.78 | | |
| Crestview (Davidson HS) | 06/0824 | 998.3 | 06/0724 | | 35 | | | |
| DeFuniak Springs | 06/0630 | 997.9 | | | | 4.60 | | |
| Destin | | 989.1 | | 62h | 69 | | | |
| Destin 5-10 E | | | 06/0440 | 48 | 63 | | | |
| Destin AWS | 06/0435 | 1004.1 | 06/0500 | | 40 | | | |
| Destin Harbore | | | 06/0500 | 65 | 75 | | | |
| Fort Walton Beach (Choctawhatchee HS) | | 1002.7 | 06/0613 | | 35 | | | |
| Freeport | 06/0440 | 988.5 | | | | | | |
| Hiland Park | | 1007.8 | | | | 5.45 | | |
| Lynn Haven | | | | | | 7.80 | | |
| Mary Esther 3 SSW HRT | | | | | | 5.20 | | |
| Miramar Beach | 06/0503 | 991.8 | | 57 | 73 | | | |
| Niceville | | | 06/0440 | | 57 | | | |
| Panama City Bay HS | | | | | | 6.53 | | |
| Panama City The Cove | | | | | | 9.56 | | |
| Panama City WJHG-TV | | | | | | 11.00 | | |
| Phillips Inlet | | | | 64g | | 4.05 | | |
| Port St. Joe | | | | | | 9.57 | | |
| Santa Rosa Beach | | | 06/0426 | | 70 | | | |
| Seagrove Beach | | | 06/0450 | 82f | 93 | | | |
| St. Andrews State Parke | | 991.8 | 06/0310 | 63f | | | | |
| St. George Island | | | | | | 4.48 | | |
| Wasuau 3 E | | | | | | 8.80 | | |
aDate/time is for wind gust when both sustained and gust are listed.
bExcept as noted, sustained wind averaging periods for C-MAN and land-based ASOS reports are
2 min; buoy averaging periods are 8 min.
cStorm surge is water height above normal astronomical tide level.
dStorm tide is water height above National Geodetic Vertical Datum (1929 mean sea level).
eSailboat, likely with non-standard anemometer elevation.
f3 minute average.
g1 minute average.
h4 minute average. |
Table 4: Preliminary track forecast evaluation for Tropical Storm Barry - heterogeneous sample. Errors in nautical miles for
tropical storm and hurricane stages with number of forecasts in
parentheses. Bold numbers represent forecasts which were
better than the official forecast.
| Forecast Technique | Period (hours) |
| 12 | 24 | 36 | 48 | 72 |
| CLIP | 42 (8) | 76 (5) | 109 (4) | 148 (5) | 171 (3) |
| GFDI | 24 (8) | 55 (5) | 140 (4) | 234 (5) | 369 (5) |
| GFDL* | 30 (8) | 44 (5) | 122 (4) | 200 (5) | 273 (3) |
| LBAR | 40 (8) | 84 (5) | 168 (4) | 194 (5) | 293 (3) |
| VBRI* | 45 (8) | 118 (5) | 162 (4) | 161 (5) | 149 (3) |
| VBAR | 29 (6) | 58 (4) | 148 (4) | 184 (4) | 163 (2) |
| AVNI | 26 (7) | 30 (4) | 73 (4) | 74 (4) | 86 (2) |
| AVNO* | 29 (8) | 18 (5) | 37 (4) | 71 (5) | 98 (3) |
| BAMD | 31 (8) | 63 (5) | 134 (4) | 170 (5) | 255 (3) |
| BAMM | 32 (8) | 73 (5) | 146 (4) | 174 (5) | 281 (3) |
| BAMS | 36 (8) | 79 (5) | 166 (4) | 222 (5) | 358 (3) |
| NGPI* | 38 (8) | 62 (5) | 124 (4) | 179 (5) | 320 (3) |
| NGPS | 36 (3) | 63 (1) | 117 (1) | 179 (2) | 356 (1) |
| UKMI | 30 (6) | 35 (3) | 58 (3) | 107 (2) | 98 (1) |
| UKM* | 31 (3) | 39 (1) | 58 (1) | 82 (2) | 99 (1) |
| A98E | 39 (8) | 46 (5) | 63 (4) | 92 (5) | 136 (3) |
| A9UK | 34 (3) | 16 (1) | 112 (1) | 98 (2) | 99 (1) |
| GUNS | 24 (6) | 34 (3) | 95 (3) | 183 (2) | 221 (1) |
| GUNA | 19 (6) | 32 (3) | 70 (3) | 136 (2) | 160 (1) |
| NHC Official | 31 (8) | 49 (5) | 105 (4) | 156 (5) | 244 (3) |
| NHC Official 10-Year Average (1991-2000) | 44 (2049) | 82 (1835) | 118 (1646) | 151 (1475) | 225 (1187) |
| *Output from these models was unavailable at time of forecast issuance. |
Table 5: Watch and warning summary, Tropical Storm Barry, 2 - 7 August 2001.
| Date/Time | Action | Location |
| 03/1500 | Tropical storm watch issued | Southeast Louisiana from Mouth of Pearl River to Morgan
City |
| 04/1500 | Tropical storm warning issued | Mississippi Delta region of Louisiana from Grand Isle to the
Mouth of the Pearl River...including New Orleans and adjacent
lakes |
| 04/1500 | Tropical storm watch issued | Mouth of the Pearl River eastward to Panama City, Florida and
west of Grand Isle to Morgan City, Louisiana |
| 04/2100 | Tropical storm warning extended | Grand Isle, Louisiana to Apalachicola, Florida |
| 05/0300 | Tropical storm watch discontinued | West of Grand Isle to Morgan City, Louisiana |
| 05/1300 | Hurricane warning issued | Pascagoula, Mississippi eastward to the Ochlockonee River,
Florida |
| 05/1300 | Tropical storm warning extended | Eastward from east of the Ochlockonee River to the Mouth of the
Suwanee River, Florida |
| 05/2100 | Tropical storm warning discontinued | Grand Isle, Louisiana to the Mouth of the Pearl River including
New Orleans |
| 06/0300 | Hurricane warning changed to tropical storm warning | West of Pensacola, Florida to just east of Pascagoula,
Mississippi |
| 06/0300 | All warnings discontinued | Pascagoula, Mississippi westward |
| 06/0700 | Hurricane warning downgraded to a tropical storm warning | Apalachicola to Ft. Walton Beach, Florida |
| 06/0700 | All warnings discontinued | East of Apalachicola and west of Ft. Walton Beach, Florida |
| 06/1200 | Tropical storm warning discontinued | Apalachicola to Ft. Walton Beach, Florida |
Figure 1:
Best track for Tropical Storm Barry, 2-7 August 2001.
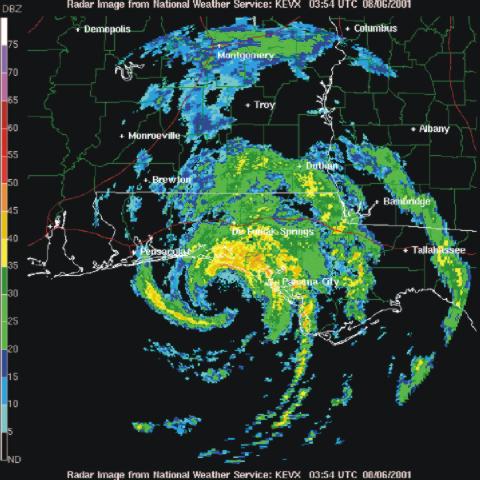
Figure 2:
Eglin Air Force Base WSR-88D radar reflectivity image of Barry at 0354 UTC 6
August 2001.

Figure 3:
Best track minimum central pressure curve for Tropical Storm Barry, 2-7
August 2001.
Figure 4:
Best track maximum sustained surface wind speed curve for
Tropical Storm Barry, 2-7 August 2001, and the observations on which the
best track curve is based. Aircraft observations have been adjusted for
elevation using 90%, 80%, and 80% reduction factors for observations from
700 mb, 850 mb, and 1500 ft, respectively. Dropwindsonde observations include
actual 10 m winds (sfc), as well as surface estimates derived from the mean
wind over the lowest 150 m of the wind sounding (LLM), and from the sounding
boundary layer mean (MBL).
|