|
Storm Prediction Center WCM Page
| [Intro|Tornado Graphs|Data] |
| Warning Coordination Meteorologist's Introduction |
|---|
Welcome to the WCM Page for the SPC. This page shows the latest tornado-count graph as well as links to comma-delimited
data files for tornado, severe thunderstorm wind, and hail reports from 1950 through 2006. Feel free to e-mail me at
spc.wcm@noaa.gov with any questions or comments. Thank you.
Greg Carbin
Warning Coordination Meteorologist
NWS/NCEP Storm Prediction Center
|
| Latest Graph of Tornado Trends |
|---|
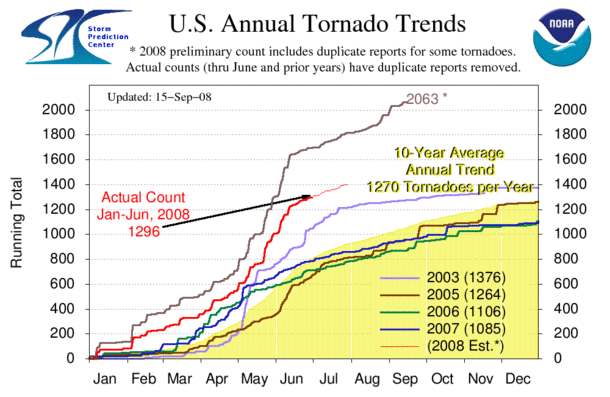 Plot of the annual trend in tornado numbers by year. (Click on graph for full-resolution version.)
The 2008 preliminary tornado count has been climbing dramatically. By most accounts, the year is off to a record start in tornado numbers. It is important to understand that the preliminary count for 2008 is based on Local Storm Reports (LSRs) transmitted by local National Weather Service Forecast Offices around the country. The preliminary tornado count is an overestimate because duplicate reports are often transmitted for a single tornado (This is especially true for long-track significant tornadoes!). With time, these numbers are refined and published in the National Weather Service Storm Data publication.
January 2008, with 88 tornadoes based on Storm Data, was not a record for January. January 1999 retains the record with 212 tornadoes documented in Storm Data. February 2008, with 148 actual tornadoes, appears to have established a new record for that month. The old February record of 83 tornadoes was established in 1971. The 30-year average number of tornadoes for January and February is about 23 each month. Obviously, 2008 started out with well above normal tornado activity!
* Note! Given the changes observed between the preliminary numbers and the numbers appearing in Storm Data, an estimated curve has been added for 2008 to date. This curve is based on an approximate 30% reduction in the preliminary numbers. Estimates of the actual tornado count can be calculated by taking the preliminary count and multiplying by 0.70. This is only a rough estimate and actual figures will be added to the thick red line as those numbers become available.
| | Preliminary 2008 Tornadoes by State through May |
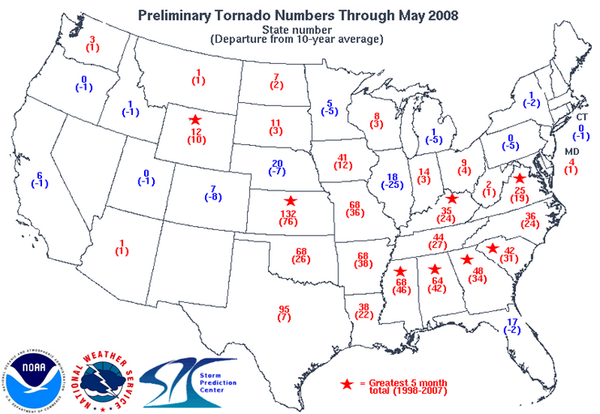
Preliminary tornado numbers by state Jan-May, 2008. Departure from 10-year average is also noted in parentheses. (Click on graph for full-resolution version.)
| | Tornado Tracks/Fatality Locations, Feb. 5-6, 2008 Outbreak |
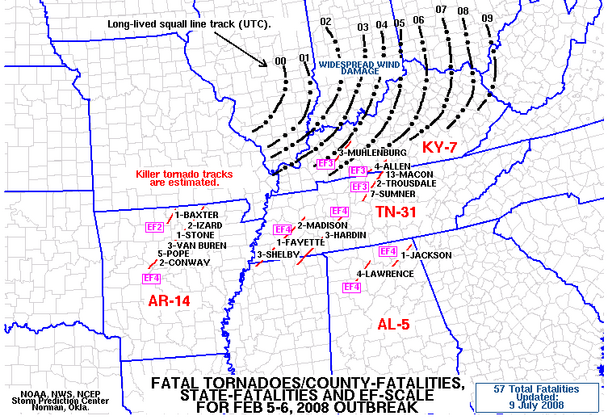
Tornado tracks and fatality locations for the Feb. 5-6, 2008 Tornado Outbreak. (Click on graph for full-resolution version.)
| | Fatal Tornado Outbreaks Since 1950 |
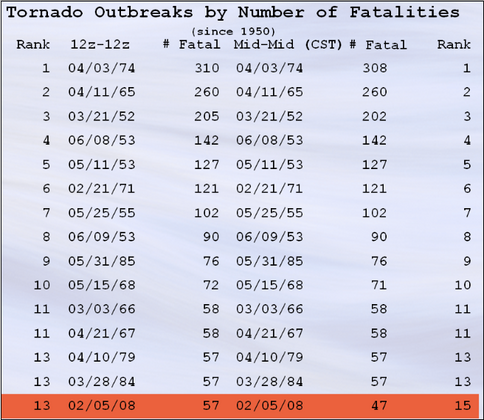
Rankings of tornado outbreaks since 1950 based on number of direct fatalities. Two time-frame criteria are used in this table: one based on UTC time (12z-12z) and the other based on Central Standard Time (Midnight to Midnight CST). (Click on table for full-resolution version.)
| | SPC 2007 Tornado Tracks Map |
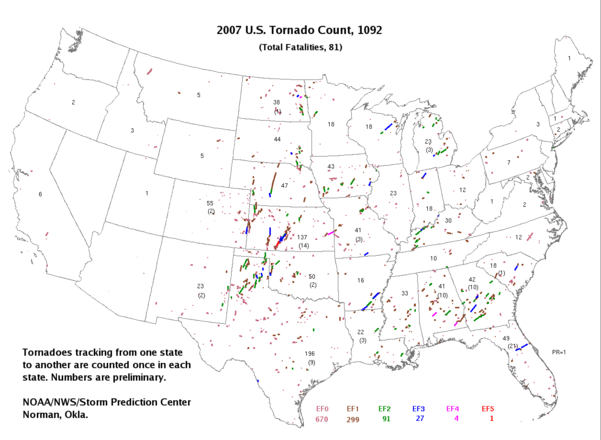
U.S. map depicting tornado tracks colored by EF-Scale for 2007.
(Click on graph for full-resolution version.)
| | SPC 2007 Tornado Chart |
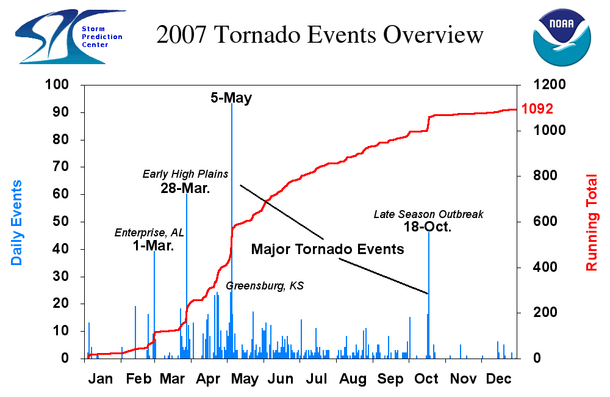
Chart depicting tornado events and total annual trend for 2007.
(Click on graph for full-resolution version.)
| | SPC 2007 Tornado Events by EF-Scale |
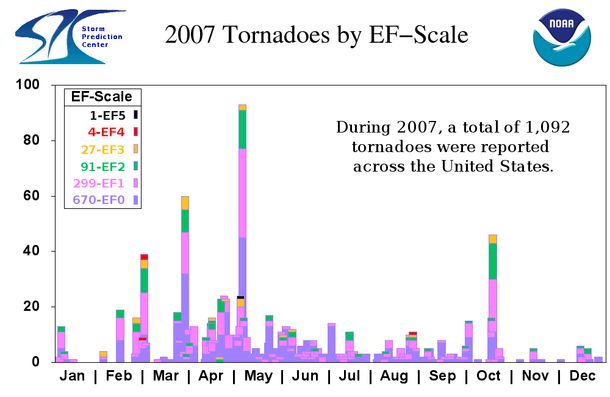
Bar chart depicting tornado events by EF-Scale for 2007.
(Click on graph for full-resolution version.)
|
| Other Statistical Data for this Year |
|---|
Monthly Tornado Statistics.
Find out how many tornadoes have occured so far this year and how
this year compares to past years.
Deadly Tornadoes in 2008.
Information about the killer tornadoes in 2008.
|
| Severe Weather Database Files (1950-2007) |
|---|
The table below provides links to comma separated value (.csv) files for tornado, hail, and damaging wind data as compiled in Storm Data.
Tornado reports exist back to 1950 while hail and damaging wind reports date from 1955. The full datasets are very large, especially hail and wind. To facilitate quicker downloads these data have been parsed by decade (or 1/2 decade in the case of wind/hail data in the 1950s and 2000s).
This document describes the format of the .csv files. describes the format of the .csv files.
|
Top/Forecast Products/Home
|
|