|
Jerkiness Measured with Lost Motion Energy Parameter and Percent Repeated Frames
Jerkiness is defined in ANSI T1.801.02-1996 as "Motion that was originally smooth and continuous is perceived as a series of distinct snapshots."
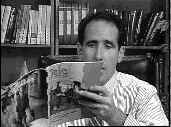
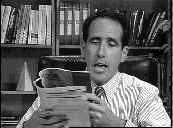
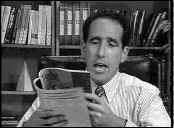
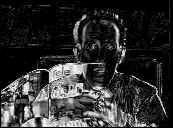
The series of video frames below illustrate the use of the lost motion energy parameter and the percent repeated frames parameter in ANSI T1.801.03-1996 for measuring the jerkiness impairment. A sequence of input video frames are shown together with their computed temporal information (TI) images. For this input video sequence, the man and the magazine he is holding are moving and the motion is given by the white areas in the TI images. The sequence shown contains 10 video frames, of which only the first, second, and tenth are displayed. The output video was obtained from a transmission system that failed to transmit every video frame and instead repeated video frames. This particular transmission system only updated the video once every 10 video frames. The first output image and the last output image are these updates. When the output video is updated with a new frame, the corresponding TI image contains all the accumulated motion of the last ten frames. Thus, the TI images for output frames 1 and 10 have large amounts of motion compared to the input. Output frames 2 through 9 are repeated and are identical to output frame 1. Thus, the TI images for these output frames do not show any motion.
The graph below shows an example plot of TI for a transmission system which performs frame repetition. The input, shown as a solid line, contains time varying amounts of motion. The output, shown as a dashed line, contains repeated frames. The percent repeated frames parameter counts the percentage of TI samples that are repeated (repeated output samples are shown with a · on the horizontal axis in the graph below). The average lost motion energy parameter integrates the fraction of lost motion (i.e., sums the vertical distances from the input samples to the corresponding repeated output samples · , where these distances are normalized by the input before summing).

Input
Sequence |
 |
 |
... |
 |
TI of Input
Sequence |
 |
 |
... |
 |
| |
Frame 1 |
Frame 2 |
... |
|
Output
Sequence |
 |
|
... |
 |
TI of
Output
Sequence |
 |
 |
... |
 |
|