|
Block Distortion (Tiling) Measured with the HV to non-HV Edge Energy Difference Parameter
Block distortion or tiling is defined in ANSI T1.801.02-1996 as "Distortion of the image characterized by the appearance of an underlying block encoding structure."
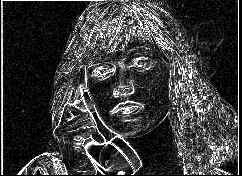
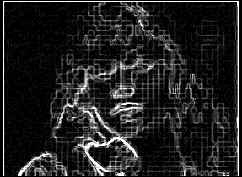
The images below illustrate the use of the HV to non-HV edge energy difference parameter in ANSI T1.801.03-1996 for quantifying the tiling impairment. The output image (top row, right) contains both tiling and blurring when compared with the input image (top row, left). Tiling creates false horizontal and vertical edges while blurring results in lost edge energy. By examining the spatial information (SI) as a function of angle, the tiling effects can be separated from the blurring effects.
 To obtain a pictorial representation of this effect, the horizontal and vertical spatial information values given in section 6.1.1.1 of the ANSI standard (i.e., SIh and SIv) were calculated for each image pixel. The histogram plots in the third row were generated by counting the number of image pixels at each discrete (SIh, SIv) location, and then displaying this count as an intensity. Thus, brighter areas indicate more image pixels with those SIh and SIv coordinates. These (SIh, SIv) coordinates can also be converted into radius (SIr) and angle (θ) coordinates as shown in the figure at the left. The second row of images display the SIr values at each pixel in the input and output image. As shown in the two dimensional (SIh, SIv) histograms, tiling adds horizontal and vertical spatial information (i.e., the output has more spatial information along the horizontal SIh axis and the vertical SIv axis than the input, while blurring results in a loss of diagonal spatial information (i.e., the output has less spatial information along a diagonal direction, such as θ = 45 degrees, than the input).
 |
 |
| Input |
Output |
 |
 |
| SIr of Input |
SIr of Output |
 |
 |
| Histogram of Input |
Histogram of Output |
|