NHC Graphics Product Descriptions
Read the NHC Tropical Cyclone
Text Product Descriptions
Tropical Cyclone Track Forecast Cone and Watches/Warnings
This graphic shows an approximate representation of coastal areas under a hurricane warning (red), hurricane watch (pink),
tropical storm warning (blue) and tropical storm watch (yellow). The orange circle indicates the current position of the
center of the tropical cyclone. The black line and dots show the National Hurricane Center (NHC) forecast track of the center
at the times indicated. The dot indicating the forecast center location will be black if the cyclone is forecast to be
tropical and will be white with a black outline if the cyclone is forecast to be extratropical. If only an L is displayed,
then the system is forecast to be a remnant low. The letter inside the dot indicates the NHC's forecast intensity for that time.
NHC forecast tracks of the center can be in error; track forecast errors in
recent years were used to construct the areas of uncertainty for the first 3
days (solid white area) and for days 4 and 5 (white stippled area). These
areas of uncertainty are formed by enclosing the area swept out by a set of
circles (not shown) along the forecast track (at 12, 24, 36 hours, etc). The
size of each circle is set so that two-thirds of historical official forecast
errors over a 5-year sample fall within the circle. The historical data indicate
the entire 5-day path of the center of the tropical cyclone will remain within the
outer uncertainty area about 60-70% of the time. There is also uncertainty in the
NHC intensity forecasts. The Maximum 1-minute Wind Speed Probability Table described below
provides intensity forecast and uncertainty information.
It is also important to realize that a tropical cyclone is not a point. Their
effects can span many hundreds of miles from the center. The area
experiencing hurricane force (one-minute average wind speeds of at least
74 mph) and tropical storm force (one-minute average wind speeds of
39-73 mph) winds can extend well beyond the white areas shown enclosing
the most likely track area of the center. The distribution of hurricane
and tropical storm force winds in this tropical cyclone can be seen in
the Cumulative Wind History graphic described below.
Graphics for Atlantic tropical cyclones are normally issued every six hours at
5:00 AM EDT, 11:00 AM EDT, 5:00 PM EDT, and 11:00 PM EDT (or 4:00 AM EST, 10:00 AM EST, 4:00 PM EST, and 10:00 PM EST).
Graphics for Eastern Pacific tropical cyclones are normally issued every six hours at
2:00 AM PDT, 8:00 AM PDT, 2:00 PM PDT, and 8:00 PM PDT (or 1:00 AM PST, 7:00 AM PST, 1:00 PM PST, and 7:00 PM PST).
The graphics will also be updated when intermediate public advisories are issued, and special graphics may be issued at
any time due to significant changes in warnings or in the cyclone.
Note: A detailed definition of the NHC track forecast cone is also available.
Tropical Cyclone Surface Wind Speed Probabilities
Three types of tropical cyclone wind speed probability values are created for each forecast/advisory package, but not all
of these values are distributed or placed on the Internet. For each probability value, the event in question is a
sustained (one-minute average) surface (10 m) wind speed of at least a particular threshold value (34, 50, or 64 kt)
at a specific location.
Cumulative – These values tell you the overall probability the event will
occur sometime during the specified cumulative forecast period (0-6 hours, 0-12,
0-18, etc.) at each specific point. These values are provided in both the text and
graphical formats.
In the text product, the numbers are in parentheses.
The graphical products depict
only cumulative values. The text product is transmitted
to users via normal NWS dissemination methods. The graphic is available on the internet from the
National Hurricane Center and the
Central Pacific Hurricane Center.
Individual – These values tell you the probability the event will start
sometime during the specified individual forecast period (0 - 6 hours, 6-12, 12-18,
etc.) at each specific point. These periods are individual, since nothing that
occurs before or after the specified period affects the probability. These values
are provided only in the text NHC product. They are the values outside of the
parentheses (cumulative values are in the parentheses). The term "individual" also
makes a clear distinction from the cumulative period values for users.
Graphics for Atlantic tropical cyclones are normally issued every six hours at
5:00 AM EDT, 11:00 AM EDT, 5:00 PM EDT, and 11:00 PM EDT (or 4:00 AM EST, 10:00 AM EST, 4:00 PM EST, and 10:00 PM EST).
Graphics for Eastern Pacific tropical cyclones are normally issued every six hours at
2:00 AM PDT, 8:00 AM PDT, 2:00 PM PDT, and 8:00 PM PDT (or 1:00 AM PST, 7:00 AM PST, 1:00 PM PST, and 7:00 PM PST).
Special graphics may be issued at any time due to significant changes in warnings or in the cyclone.
Note: A more detailed description of these probability products is also available.
(Experimental) Tropical Cylone Surface Wind Field
This new experimental graphic for 2008 shows the areas potentially being affected by the sustained winds of tropical storm
force (in orange) and hurricane force (in red). The display is based on the wind radii contained in the latest Forecast/Advisory
(indicated at the top of the figure). Users are reminded that the Forecast/Advisory wind radii represent the
maximum possible extent of a given wind speed within particular quadrants around the tropical cyclone. As a result,
not all locations falling within the orange or red shaded areas will be experiencing sustained tropical storm or
hurricane force winds, respectively.
In addition to the wind field, this graphic shows an approximate representation of coastal areas under a hurricane
warning (red), hurricane watch (pink), tropical storm warning (blue) and tropical storm watch (yellow). The white
dot indicates the current position of the center of the tropical cyclone, and the dashed line shows the history of
the center of the tropical cyclone.
Graphics for Atlantic tropical cyclones are normally issued every six hours at 5:00 AM EDT, 11:00 AM EDT, 5:00 PM
EDT, and 11:00 PM EDT (or 4:00 AM EST, 10:00 AM EST, 4:00 PM EST, and 10:00 PM EST). Graphics for Eastern Pacific
tropical cyclones are normally issued every six hours at 2:00 AM PDT, 8:00 AM PDT, 2:00 PM PDT, and 8:00 PM PDT
(or 1:00 AM PST, 7:00 AM PST, 1:00 PM PST, and 7:00 PM PST).
Special graphics may be issued at any time due to significant changes in warnings or in the cyclone.
Note: Please read the Tropical Cyclone Surface Wind Field full product description.
Cumulative Wind History

This graphic shows how the size of the storm has changed, and the areas
potentially affected so far by sustained winds of tropical storm force (in
orange) and hurricane force (in red). The display is based on the wind
radii contained in the set of Forecast/Advisories indicated at the top of
the figure. Users are reminded that the Forecast/Advisory wind radii
represent the maximum possible extent of a given wind speed within
particular quadrants around the tropical cyclone. As a result, not all
locations falling within the orange or red swaths will have experienced
sustained tropical storm or hurricane force winds, respectively.
Graphics for Atlantic tropical cyclones are normally issued every six hours at
5:00 AM EDT, 11:00 AM EDT, 5:00 PM EDT, and 11:00 PM EDT (or 4:00 AM EST, 10:00 AM EST, 4:00 PM EST, and 10:00 PM EST).
Graphics for Eastern Pacific tropical cyclones are normally issued every six hours at
2:00 AM PDT, 8:00 AM PDT, 2:00 PM PDT, and 8:00 PM PDT (or 1:00 AM PST, 7:00 AM PST, 1:00 PM PST, and 7:00 PM PST).
Special graphics may be issued at any time due to significant changes in warnings or in the cyclone.
Maximum 1-minute Wind Speed Probability Table
The table shows the probability that the maximum sustained (1-minute) surface (10 meter elevation) wind
speed of the tropical cyclone will be within various intensity ranges (dissipated, tropical depression,
tropical storm and hurricane) and for the five categories on the Saffir-Simpson Hurricane Scale during
the next 120 hours. These probabilities apply to the maximum sustained surface wind associated with the
cyclone, and not to winds that could occur at specific locations.
The probabilities are based on forecast errors during recent years in the official track and intensity
forecasts issued by the TPC/NHC. The probabilities are computed from the same method that creates the
individual location specific wind speed probabilities.
Graphics for Atlantic tropical cyclones are normally issued every six hours at 5:00 AM EDT, 11:00 AM EDT,
5:00 PM EDT, and 11:00 PM EDT (or 4:00 AM EST, 10:00 AM EST, 4:00 PM EST, and 10:00 PM EST).
Graphics for Eastern Pacific tropical cyclones are normally issued every six hours at 2:00 AM PDT,
8:00 AM PDT, 2:00 PM PDT, and 8:00 PM PDT (or 1:00 AM PST, 7:00 AM PST, 1:00 PM PST, and 7:00 PM PST).
Special graphics may be issued at any time due to significant changes in warnings or in the cyclone.
Experimental Graphical Tropical Weather Outlook

Example Graphical Tropical Weather Outlook for the Atlantic basin.
(Click for new page with mouseovers)
The graphical Tropical Weather Outlook (TWO) is an experimental graphic that the National Hurricane Center (NHC) began testing
during the 2007 hurricane season. The experimental Graphical TWO is intended to be a visual companion product to the text TWO.
The NHC intends to produce, experimentally during 2008, a graphical TWO four times daily in both the Atlantic and Pacific
basins. However, due to the experimental status of these products, the experimental graphic may not always be timely
or even available.
While the experimental graphical TWO is expected to be available shortly after the operational text
TWO, the experimental graphic may take 30 minutes longer (or more) to update following the issuance of the official text
TWO. Given its status as an experimental product, users should not rely solely on the graphical TWO for important
decisions. Rather, users are urged to continue using the operational text TWO during the 2008 season.
For the Atlantic basin, the Graphical TWO will be issued at 2:00 AM, 8:00 AM, 2:00 PM, and 8:00 PM EDT. For the Pacific basin,
the Graphical TWO will be issued at 5:00 AM, 11:00 AM, 5:00 PM, and 11:00 PM PDT. During Standard Time, the graphic will be
issued one hour earlier than the times indicated above.
Note: Please read the Graphical Tropical Weather Outlook's full product description.
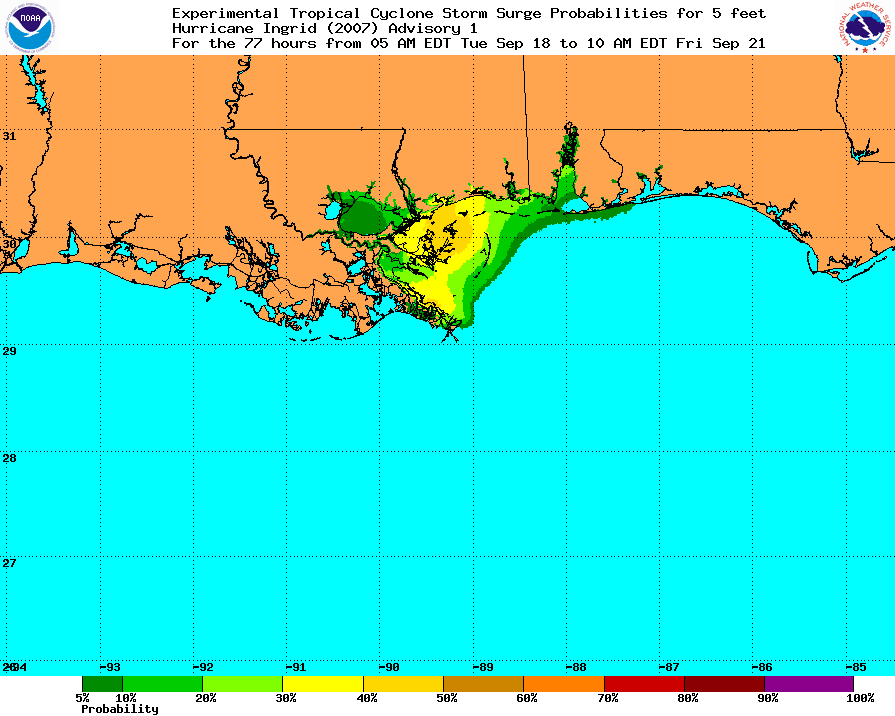
Tropical Cyclone Storm Surge Probabilities for 5 Feet
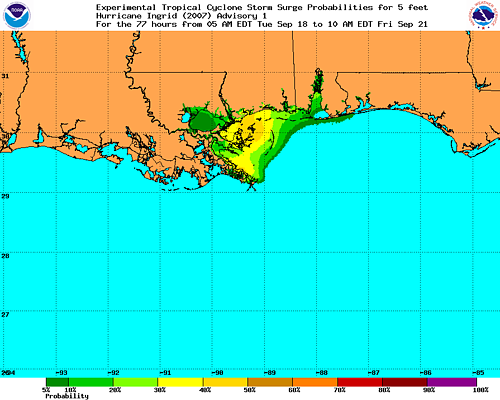
The Tropical Cyclone Storm Surge Probabilities product consists of a graphic and GRIB2 data for creating the graphic for the Gulf
of Mexico and Atlantic coastal areas of the continental United States. The graphic shows probabilities, in percent, of storm surge
exceeding 5 feet. This product is intended to provide users with information which enhances their ability to make preparedness
decisions specific to their own situations.
This storm surge graphic is based upon an ensemble of Sea, Lake, and Overland Surge from Hurricanes (SLOSH)
model runs using the National Hurricane Center (NHC) official advisory and accounts for track, size, and intensity errors based
on historical errors. Additional information on the SLOSH model can be found at:
http://www.nhc.noaa.gov/HAW2/english/surge/slosh.shtml.
The emergency management community is the primary target audience. However, this product will also be widely used by other
federal, state, and local government agencies; the media; maritime interests; and the general public.
The product is available on the NHC website whenever a hurricane watch or hurricane warning is in effect for any portion of the Gulf or Atlantic
coasts of the continental United States. Updates to the product are produced about one hour after the issuance of routine
NHC tropical cyclone advisories at 5:00 AM EDT, 11:00 AM EDT, 5:00 PM EDT, and 11:00 PM EDT (or 4:00 AM EST, 10:00 AM EST, 4:00 PM EST,
and 10:00 PM EST).
Note: You may also read the full description for the Storm Surge Probabilities.
|