

|
|
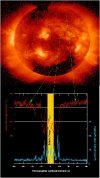
Solar Wind Speed from South Pole to North Pole: The upper panel contains an X-ray image of the Sun obtained by the Soft X-ray Telescope on the Japanese Yohkoh spacecraft; the lower panel shows the solar wind speed and density observed by the Ulysses spacecraft from the South Pole to the North Pole. The latitudinal region indicated by the yellow bar in the lower panel is the region previously explored by in-ecliptic spacecraft.
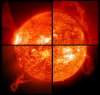
From SOHO, this photo shows a collage of prominences, which are huge clouds of relatively cool dense plasma suspended in the Sun's hot, thin corona. At times, they can erupt, escaping the Sun's atmosphere. The hottest areas appear almost white, while the darker red areas indicate cooler temperatures. Going clockwise from the upper left, the images are from: 15 May 2001; 28 March 2000; 18 January 2000, and 2 February 2001.
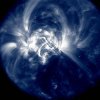
NASA's Transition Region and Coronal Explorer (TRACE) spacecraft recorded a bright but extremely short-lived explosion in the atmosphere of the Sun. The explosion, called a flare, was observed on May 31, 1998, in extreme ultraviolet light using the telescope on board TRACE.
IMP-8 (IMP-J) was launched by NASA on October 26, 1973, to measure the magnetic fields, plasmas, and energetic charged particles (e.g., cosmic rays) of the Earth's magnetotail and magnetosheath and of the near-Earth solar wind.
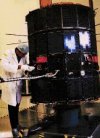
Ulysses spacecraft.
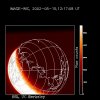
The solar wind flowing from the Sun, from IMAGE.
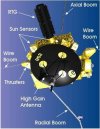
This photo shows images from the Far Ultraviolet Imager that were acquired by the Berkeley Ground Station at the Space Sciences Laboratory, UC Berkeley, or other tracking stations in Alaska and Japan, for the Imager for Magnetopause-to-Aurora Global Exploration (IMAGE mission).
|
Solar-Terrestrial Physics: The Sun and the Earth
Early in 1958, the physicist James Van Allen found himself thoroughly puzzled by data from a newly launched satellite, Explorer l. It carried a Geiger counter, an instrument to detect radiation in space, but its data could only be received for a few minutes at a time when it was over a ground station. The intermittent data raised more questions than it answered. It showed plausible values of radiation intensity while the craft was low in its orbit. But at high altitude, there were no counts at all! Moreover, other data showed sharp transitions, with the count suddenly stopping and then just as suddenly resuming.
He concluded that there might be a problem with the satellite's equipment. It relied on a battery for electric power, and the battery would shut down if onboard temperatures were too high or too low. Still, he was prepared to learn more. When Explorer 3 reached orbit, two months after its predecessor, it carried an onboard temperature sensor. It also carried a tape recorder that could hold radiation readings from an entire orbit. Van Allen got the first such data two days after launch, and found his puzzlement increasing.
The new data showed the count rising rapidly as the craft climbed upward. Then it dropped to zero, as had happened with Explorer l. The count stayed at zero until Explorer 3 returned to lower altitude, and then resumed. Yet through it all, measured onboard temperatures remained at moderate levels, assuring good battery operation. Hence the results could not have resulted from extreme onboard temperatures.
Mystified, Van Allen talked it over with two of his colleagues. The three men quickly realized they were seeing the consequence of a quirk in the Geiger counter itself. It could not respond if the radiation was too intense; it would shut down and refuse to give a reading. They concluded that Explorer 1 was flying through a zone of very strong radiation that surrounded the planet, trapped by the Earth's magnetic field. Substantiated by data gathered by later Explorer spacecraft, this zone quickly became known as the Van Allen belt.
Other spacecraft soon made further discoveries. Explorer 4, which flew in July 1958, carried radiation shielding. This screened out some of the radiation, to keep its Geiger counter from being swamped. Van Allen studied its data, and concluded that the peak radiation intensity would kill an astronaut following exposure of only a few days. Then in December, the space probe Pioneer 3 soared to an altitude of 63,000 miles (191,389 kilometers) and showed that there was a second radiation belt, some 10,000 miles (16,093 kilometers) above the Earth's surface. The inner belt was at 2,000 miles (3,219 kilometers) from the Earth. Fortunately, it was high enough to allow astronauts to fly safely in orbit while remaining well below the dangerous altitudes.
Where did the radiation come from? The obvious answer was the sun, but it was not immediately clear how. The physicist Eugene Parker responded to Van Allen's discoveries with calculations of his own. He studied the corona, a thin atmosphere that extends outward from the sun. Astronomers had already shown that it was very hot, having temperatures of over a million degrees Celsius. Parker showed that these high temperatures would make the corona expand outward, at a speed that would increase with distance from the sun. He called this expanding corona the "solar wind," and proposed that it delivered electrically charged particles that produced the Van Allen radiation.
Could the solar wind be observed? Three Soviet space probes of 1959, called Luna 1, 2, and 3, carried charged-particle detectors and indeed made suitable observations. However, these spacecraft returned data for only a few days. In 1962 an American mission to Venus, Mariner 2, crossed interplanetary space en route to that planet and made far more extensive measurements. The speed of the wind ranged from 350 to 800 kilometers per second. It consisted largely of protons and electrons, with an average density of about ten of these particles per cubic centimeter. This was tenuous indeed; the density of the Earth's atmosphere was a million trillion times greater. Yet the existence of the Van Allen belts showed that this rarefied wind could produce dramatic effects, as it interacted with the Earth's magnetic field.
Like geographers mapping a newly discovered continent, scientists such as Parker and Van Allen laid the groundwork for further discoveries by mapping the shape of this field in space. They did this using magnetometers, instruments that could measure the strength of the field. From 1959 to 1963, the space probes and satellites that contributed to this work included Explorers 6, l0, 12, and 14; Pioneer 5, which probed interplanetary space; and the Interplanetary Monitoring Platform (IMP).
The magnetometers of these craft showed that the Earth's magnetic field was confined within a "magnetosphere." When spacecraft crossed its boundary, the measured strength of the magnetism fell sharply and dropped to the far weaker values that were observed in interplanetary space. The magnetosphere proved to have the shape of a very long teardrop, with a "magnetotail" that was several million miles in length. The solar wind formed this tail, which pointed outward from the sun.
Beginning in 1962, space scientists placed increasing emphasis on studying the sun itself from orbit, making observations at energetic wavelengths that are absorbed in the Earth's atmosphere and cannot be seen from the ground. The Orbiting Solar Observatory spacecraft, which first flew in that year, was particularly significant. The work reached a high point in l973 with the crewed Apollo Telescope Mount, a part of the Skylab space station. Astronauts used its instruments to photograph the sun at x-ray and ultraviolet wavelengths, and obtained new views of solar activity.
This activity rose and fell on an eleven-year cycle, producing greater and fewer sunspots and other features that amounted to storms on the sun's surface. When the sun was active, the corona became brighter and emitted more solar ultraviolet. This radiation was known to heat the Earth's upper atmosphere, which grew warmer and expanded. Pushing itself outward, it became denser at a given altitude. Satellites, orbiting just outside the atmosphere, then experienced increased drag. Their orbits decayed, leading to an untimely end as they fell back into the dense lower atmosphere and burned up like meteors. This happened to Skylab itself in 1979, as it plunged to its death before a rescue mission could boost it to a higher orbit for safety.
Studies of the magnetosphere continued after 1980. There was particular interest in the aurora, a brilliant display of lights in the sky that is often seen at night in polar regions. As early as 1896, the Norwegian physicist Olaf Birkeland had suggested that the aurora could result from electrically charged particles shot outward by the sun and attracted by the Earth's magnetic field. These particles proved to be electrons, which produced the aurora by striking atoms of gas in the upper atmosphere and causing them to fluoresce or glow.
In 1961, the British physicist James Dungey launched a line of research that added detail to these ideas. The new approach concluded that electrons for the aurora are stored in the magnetotail, close to the Earth. These electrons come from the solar wind, which continually adds energy to the magnetotail. But his tail can only hold so much, and several times each day, it gets rid of the excess. It does this by forming a "plasmoid," which amounts to a large portion of the magnetotail that breaks loose and flies outward with the solar wind.
A plasmoid is an enormous blob of rarefied protons and electrons, many times larger than the Earth. Before it forms, the near-Earth magnetotail stretches as it swells with energy. As the plasmoid begins to break loose, the near-Earth field collapses and dumps its electrons into the upper atmosphere, to produce the aurora.
The key to this theory was whether plasmoids indeed could be observed. This happened in l983. The satellite ISEE-3 detected them in space, at distances from Earth of nearly a million miles.
Other spacecraft have made further observations. Between 1979 and 1988, the weather satellite Nimbus 7 and the Solar Maximum Mission, a research craft, made accurate measurements of solar brightness. They found changes of about 0.2 percent from week to week, produced by dark sunspots and small bright regions. Longer-term changes followed the eleven-year solar cycle and came to 0.l percent. Neither of these variations was large enough to have significant influence on the Earth's climate.
More recent missions have included Ulysses, SOHO (Solar and Heliospheric Observatory), IMAGE (Imager for Magnetopause-to-Aurora Global Exploration), and TRACE (Transition Region and Coronal Explorer). Ulysses swung around Jupiter in l992 and used that planet's powerful gravity to enter an orbit that took it high over the solar system. This enabled the spacecraft to study the solar wind above the sun's north and south poles. It found this wind flowing at high speed, 750 kilometers per second, and with reduced density. It also measured the sun's magnetic field near its poles.
SOHO, launched in l995, has contributed to predictions of geomagnetic storms. These are rare but powerful disturbances of the Earth's magnetic field, produced by the sun, which at times have had enough energy to shut down electric-power grids and leave people without electricity. Soho helped provide warning of a particularly severe such storm in 2000. Its instruments have taken photos of the sun in the ultraviolet that have shown excellent detail.
Close to the Sun, the corona is far hotter than the underlying solar surface. Clearly, energy is being transferred from the Sun to heat the corona, but the source of the energy has not been understood. The TRACE spacecraft, which flew in 1998, has helped to show that the source lies in localized disturbances within the Sun's magnetic field. The IMAGE satellite, launched in 2000, complements TRACE by giving views of activity within the Earth's magnetosphere. Among scientists, answers to one set of questions often lead investigators to ask new ones. Researchers have been learning more and more, but the SOHO, TRACE, and IMAGE spacecraft show that there is a continuing demand for new and better observations. They show that scientists still have far to go before they can claim complete understanding.
-T.A. Heppenheimer
References
Akasofu, Syun-Ichi. “The Aurora.” Scientific American, December 1965, 54-62. _____________. “The Dynamic Aurora.” Scientific American, May 1989, 90-97. Allen, C.W. Astrophysical Quantities. Third Edition. London: Athlone Press, 1973. Burch, James. “The Fury of Space Storms.” Scientific American, April 2001, 86-94. Cahill, Laurence. “The Magnetosphere.” Scientific American, March 1965, 58-68. Dwivedi, Bhola, and Phillips, Kenneth. “The Paradox of the Sun's Hot Corona.” Scientific American, June 2001, 40-47. Foukal, Peter. “The Variable Sun.” Scientific American, February 1990, 34-41. Hones, Edward. “The Earth's Magnetotail.” Scientific American, March 1986, 40-47. Hufbauer, Karl. Exploring the Sun: Solar Science Since Galileo. Baltimore, Md.: Johns Hopkins University Press, 1991. Lang, Kenneth. “SOHO Reveals the Secrets of the Sun.” Scientific American. March 1997, 40-47. Parker, E. N. “The Solar Wind.” Scientific American, April 1964, 66-76. “Reach Into Space.” Time, May 4, 1959, 64-70. Smith, Edward and Richard Marsden. “The Ulysses Mission.” Scientific American, January 1998, 74-79. Van Allen, James. “Interplanetary Particles and Fields.” Scientific American, September 1975, 160-73. Van Allen, James, et al. “Observation of High Intensity Radiation by Satellites 1958 Alpha and Gamma.” Jet Propulsion 28 (September 1958): 588-592.
“Explorers 1 and 3.” http://www-spof.gsfc.nasa.gov/Education/wexp13.html IMAGE Science Center. http://image.gsfc.nasa.gov/ IMP-8 Project Information. http://nssdc.gsfc.nasa.gov/space/imp-8.html “Radiation Belts.” http://www-spof.gsfc.nasa.gov/Education/Iradbelt.html SOHO: Exploring the Sun. http://sohowww.nascom.nasa.gov/ TRACE. http://sunland.gsfc.nasa.gov/smex/trace/ Ulysses: http://ulysses.jpl.nasa.gov/mission/mission.html
|