| |
Printer-friendly version (HTML) |
Comparing Employer-Provided Medical Care Benefits for Lower and Higher Wage Full-Time Workers
by Allan Beckmann
Bureau of Labor Statistics
Originally Posted: December 19, 2007
Higher wage workers are considerably more likely to have access to employer-provided medical plans and to participate in such plans when they are offered to them. Higher wage workers also pay a smaller portion of their health insurance premiums than do lower wage workers.
With health care costs continuing to rise,1 and more than 44 million Americans uninsured,2 health insurance coverage is a prominent issue in the United States. According to data from the Census Bureau, a majority of those without health insurance are in lower income families.3 Because most health insurance is employment based,4 it is informative to see how medical benefits vary by wage level among U.S. workers.
This article examines data from the National Compensation Survey (NCS) on medical care benefits for full-time workers in private industry by wage level.5 Specifically, it compares benefits for full-time lower wage workers (those who earn less than $15 per hour) with benefits for full-time higher wage workers (those who earn $15 or more per hour). Three different rates are calculated to measure health insurance benefits: the access rate, the participation rate, and the take-up rate. The access rate is the ratio of employees in surveyed jobs who are offered a plan to the total number of employees in surveyed jobs. The participation rate is the ratio of employees in surveyed jobs who participate in plans to the total number of employees in surveyed jobs. The take-up rate is the ratio of employees in surveyed jobs who participate in plans to the number of employees in surveyed jobs who are offered the plan.
Access to Medical Coverage
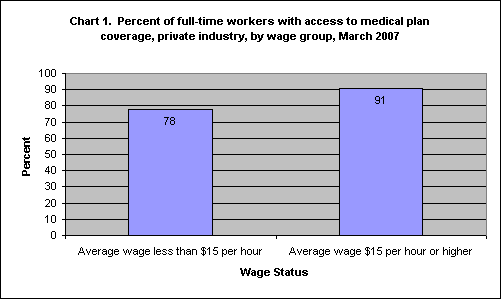
As demonstrated in chart 1, lower wage full-time workers have access to employer-provided medical coverage at a rate that is 13 percentage points lower than higher wage full-time workers. Among lower wage workers, 78 percent have access to medical plan coverage, while among higher wage workers, 91 percent have access to such coverage.

Participation in Medical Coverage
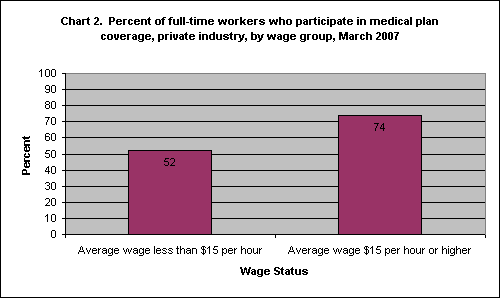
Chart 2 shows that the disparities in access to medical plans between lower wage workers and higher wage workers also manifest themselves in disparities in participation rates. At 52 percent, only slightly more than half of all full-time lower wage workers participate in an employer-provided medical plan. This compares to 74 percent of all full-time higher wage workers who participate in a plan.

Take-up Rate for Medical Coverage
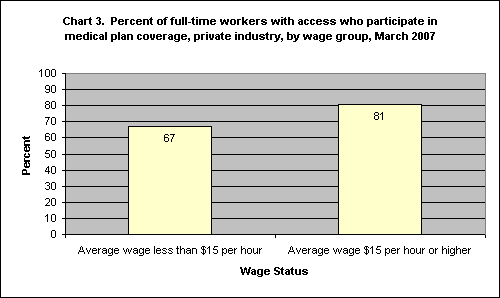
Chart 3 shows that, among those workers who have access to a plan, roughly 67 percent of lower wage full-time workers choose to enroll in a medical plan. On the other hand, about 81 percent of higher wage full-time workers with access to a medical plan choose to enroll. This disparity may be partly due to the fact that many lower wage workers opt out of plans offered because the employee’s required contribution to the plan premium is considered too burdensome on the individual’s or the family’s budget.

Data released by the Consumer Expenditure Survey indicate that lower wage workers spend an average of $16,452 on food, housing, and transportation, roughly 68 percent of their annual expenditures.6 Spending on these necessities does not leave very much money for discretionary expenses, such as health insurance. Another possible source of this disparity may be lower wage workers’ access to government-provided health care for the working poor through Medicaid or similar programs.7 Workers in both wage levels may also opt out of their plans because they are covered by plans provided through other family members’ employers.
Division of Premium Costs
As shown in table 1, full-time lower wage workers who participate in a medical plan pay a larger share of the premium, on average, than do their full-time higher wage counterparts. Lower wage workers are expected to pay for 21 percent of the premium cost for single coverage and 34 percent of the premium cost for family coverage. Higher wage workers, on the other hand, pay 17 percent of the premium cost for single coverage and 27 percent of the premium cost for family coverage.
Lower wage participants are also more likely than higher wage participants to be required to contribute toward their plans’ premiums. As chart 4 shows, among participants who are required to make a contribution toward single coverage, there is a 9-percentage-point difference between lower wage workers and higher wage workers. For family coverage, the difference between wage groups was similarly notable: 92 percent of lower wage workers who participate in a medical plan must pay toward their family coverage, while 84 percent of higher wage medical plan participants must make a contribution.

Premium Values
Employers pay a larger proportion of the cost of health insurance for higher paid full-time workers than they do for lower paid full-time workers. Employers also spend more money per worker on premiums for higher paid workers than they do for lower paid workers. As shown in table 2, for single coverage, employers spend, on average, at least $27 more per worker on monthly premium costs for higher paid workers, and at least $83 more per worker for family coverage. Employee contributions, in plans where one is required, average approximately $80 per month for single coverage, regardless of hourly wage rate. For family coverage, however, the average monthly employee contribution is almost $25 more for lower paid workers than for their higher paid counterparts.
Additional Information
For additional information on health insurance premiums and other employer-provided benefits, visit the NCS Benefits page on the BLS website at http://www.bls.gov/ncs/ebs/home.htm.
NOTE: Standard errors have not been calculated for NCS benefits estimates. Consequently, none of the statistical inferences made in this report could be verified by a statistical test.
Allan Beckmann
Economist, Division of Compensation Data Estimation, Office of Compensation and Working Conditions, Bureau of Labor Statistics.
Telephone: (202) 691-6271; E-mail: Beckmann.Allan@bls.gov
Notes
1 Health care spending has risen from 7 percent of Gross Domestic Product (GDP) in 1970 to 15.3 percent of GDP in 2003. See Fundamentals of Employee Benefit Programs: Part Three, Health Benefits (Washington, Employee Benefit Research Institute, 2005), available on the Internet at http://www.ebri.org/pdf/publications/books/fundamentals/Fnd05.Prt03.Chp29.pdf.
2 According to the U.S. Census Bureau, there were 44.4 million individuals under age 65 without health insurance in the United States in 2005. See Census Bureau Revises 2004 and 2005 Health Insurance Coverage Estimates, CB07-45 (U.S. Department of Commerce), March 23, 2007; available on the Internet at http://www.census.gov/Press-Release/www/releases/archives/health_care_insurance/009789.html.
3 See Paul Fronstin, Sources of Health Insurance and Characteristics of the Uninsured: Updated Analysis of the March 2006 Current Population Survey, Issue Brief No. 305 (Washington, Employee Benefit Research Institute, May 2007), p.6; available on the Internet at http://www.ebri.org/pdf/briefspdf/EBRI_IB_05-20074.pdf.
4 Data from the Current Population Survey (CPS) show that 62.2 percent of the nonelderly U.S. population had employment-based health benefits in 2006. See Paul Fronstin, Sources of Health Insurance and Characteristics of the Uninsured: Analysis of the March 2007 Current Population Survey, Issue Brief No. 310 (Washington, Employee Benefit Research Institute, October 2007), p.1; available on the Internet at http://www.ebri.org/pdf/briefspdf/EBRI_IB_10a-20071.pdf.
5 Because many part-time workers have very low rates of access to and participation in health insurance plans, this article compares health coverage by wage level for full-time workers only. NCS data for March 2007 show that 24 percent of part-time workers had access to medical plans and 12 percent of part-time workers participated in medical plans. In addition, full-time workers were 3 times more likely to have access to employment-based medical benefits than were part-time workers. See National Compensation Survey: Employee Benefits in Private Industry in the United States, March 2007, Summary 07-05 (Bureau of Labor Statistics, August 2007), pp. 1-2, 12; available on the Internet at http://www.bls.gov/ncs/ebs/sp/ebsm0006.pdf.
6 See Consumer Expenditures in 2005, Report 998 (Bureau of Labor Statistics, February 2007); available on the Internet at http://www.bls.gov/cex/csxreprt.htm.
7 Though eligibility requirements vary across states, the average income requirement for Medicaid coverage is 133 percent of the Federal poverty level (FPL) for children under 6 ($27,416 for a family of four), 100 percent of the FPL for children age 6 to 18 ($20,614 for a family of four), and 67 percent of the FPL for adults ($13,811 for a family of four). For more information, see Sheila Zedlewski, Gina Adams, Lisa Dubay, and Genevieve Kenney, Is There a System Supporting Low-Income Working Families? (Washington, Urban Institute, February 2006), available on the Internet at http://www.urban.org/UploadedPDF/311282_lowincome_families.pdf; and "Poverty Thresholds 2006" on the Census Bureau website at http://www.census.gov/hhes/www/poverty/threshld/thresh06.html.