| |
Printer-friendly version (HTML) |
Janitors in 2000: An Overview of NCS Data
by Laura Pfuntner
Originally Posted: November 24, 2003
New data reveal that pay for janitors is influenced by the type of work performed and whether the job is unionized, as well as characteristics of the employer such as location and industry.
Wage rates for janitors, one of the nation’s most populous occupations with over 2 million incumbents, ranged widely in 2000. Across the nation, janitors averaged $9.56 per hour, but their wages varied considerably depending upon location, industry, and other characteristics.1 For example, janitors employed by private establishments in the West South Central states (Arkansas, Louisiana, Oklahoma, and Texas) averaged $6.93 per hour, less than half the $14.78 per hour earned by State and local government janitors in the New York consolidated metropolitan area. These data come from the BLS National Compensation Survey (NCS), which provides comprehensive measures of occupational earnings, compensation cost trends, benefit incidence, and detailed benefits provisions. This article looks primarily at occupational earnings data from the 2000 survey.
The 2000 National Compensation Survey sampled 18,329 establishments in 154 localities, representing 88 million workers, and provided wage and hour data for around 480 occupational classifications.2 Given this large quantity of data, how much information can the survey provide on a single occupation? This study attempts to show the breadth and depth of data available from the NCS by examining the data for a single occupational classification, janitors and cleaners. Pay rates are published for many classifications. Those studied in this article include data on how pay varies by different geographic localities, full- and part-time work schedules, private industry and State and local governments, and the level of duties and responsibilities of the job. This article also provides new data on how janitors’ earnings vary by union or nonunion classification and by the industry in which janitors are employed.
Background
A janitor’s main duty is to keep buildings such as schools, hospitals, offices, and apartments clean and in good condition. Some janitors may also perform routine maintenance tasks. A janitor’s cleaning jobs will often include both heavy and light cleaning, such as dry-mopping floors, shampooing rugs, washing walls and glass, and removing trash. Other common janitorial tasks are refurbishing restroom supplies, mowing lawns, and monitoring air conditioning and heating systems. More skilled janitors may perform simple maintenance tasks such as fixing leaky plumbing, routine painting and carpentry, operating furnaces, and pest extermination.3
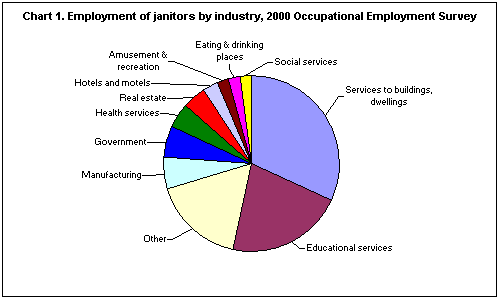
Many janitors work during evening hours, when buildings are empty, and most work 40 hours per week. In large buildings, janitors may work in teams specializing in a particular task, such as vacuuming floors or dusting furniture. Most janitorial jobs are found in highly populated areas, where greater numbers of large buildings are located. In 2000, there were 4.3 million people employed as building cleaners, nearly 2.1 million of them as janitors. The largest employers of janitors were contracting firms specializing in services to buildings, providing nearly a third of janitorial jobs, followed by educational institutions, employing one fifth of janitors. (See chart 1.)4
No special education is required for employment as a janitor; most skills are learned on the job. The occupation is projected to grow about as fast as the average for all occupations through 2010.5
National Compensation Survey
The 2000 National Compensation Survey provides national mean wages for all janitors, janitors classified as part time and full time, and janitors employed in metropolitan and nonmetropolitan areas.6 For the full- and part-time classifications, averages are published for the entire United States as well as for private industry only and State and local government only. The NCS also provides similar estimates for the nine census divisions, all of which are published in individual bulletins for each division.7 Data for many of the 154 localities sampled in the survey are also published in individual local bulletins.
NCS data show that average wages for janitors vary widely across the United States. This analysis begins with a geographic perspective by looking at the nine Census Divisions and then at metropolitan versus nonmetropolitan areas. It concludes by looking at 10 of the 154 localities sampled.
Census divisions. Wages in the Middle Atlantic census division were $11.26 per hour, considerably higher than the national average of $9.56, and substantially exceeding those in every division except for New England. (See table 1.) The West South Central division had the lowest average wage, $7.41, which is 66 percent of the value of the Middle Atlantic average and 78 percent of the national average.8 Wages in the Mountain and South Atlantic divisions were also markedly lower than the national average. Wages in the other four census divisions were close to the national average.9
Metropolitan and nonmetropolitan areas. Nationally, janitors in nonmetropolitan areas averaged $8.98 per hour, 93 percent of the $9.62 average in metropolitan areas. (See table 2.) Average wages in the Middle Atlantic and East South Central divisions were substantially higher in metropolitan areas. The largest difference occurred in the East South Central division, where the rural janitors averaged 70 percent of what their urban counterparts earned. The opposite occurred in the Mountain states, where metropolitan janitors earned, on average, 84 percent of the wages of nonmetropolitan janitors, a 16 percent disadvantage. (This follows a pattern broadly characteristic of the Mountain division: It was the only division in 2000 where the average wage for all workers was higher in rural than in urban areas.) In the remaining divisions, the average wages in the two types of areas were virtually the same or the differences were not statistically significant.
Localities. Of the 154 localities sampled in the NCS, 10 metropolitan areas were chosen for examination in this study. Four localities were classified as large, three as medium, and three as small.10 There was no apparent relationship between the size of the locality and the average wage of janitors in the 10 localities studied. The localities were roughly divided in half, with six reporting average wages of $10 or more per hour, more, and four averaging $8 to $9 per hour. (See table 3.)
Work schedule. At the national, regional, and local levels, pay for full-time janitors exceeded pay for janitors who are employed on a part-time basis. Nationally, the average part-time janitorial wage ($7.00) was about 68 percent of the average full-time janitorial wage ($10.25). In eight of the nine census divisions, the part-time wage did not exceed 73 percent of the value of the full-time wage. Similarly, in the four localities for which both part-time and full-time average wages were available, the part-time wage did not exceed 74 percent of the value of the full-time wage. Nationally, full-time janitors averaged 39 hours per week, more than twice the number of hours (19) recorded for part-time janitors.
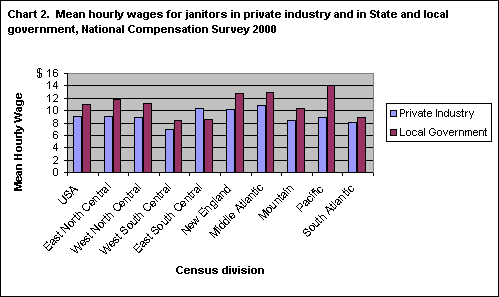
Private industry and State and local government. At the national level, janitors employed in private industry averaged $9.05 per hour, 82 percent of the $11.04 earned by janitors employed by State and local governments. In eight of the nine census divisions, janitors in private industry earned less, on average, than janitors employed in the public sector. (See table 1 and chart 2.) The greatest difference between the two sectors occurred in the Pacific division, where mean wages for janitors in private industry ($8.93) were 64 percent of the value of wages for janitors in State and local government ($13.99). In the East South Central division, the only division in which average wages of public sector janitors were less than those of the private sector, public sector wages ($8.52) were 83 percent of private sector wages ($10.30).
Wages from the nine localities for which data were available for both sectors showed a similar trend. Average hourly wages for private industry janitors in eight of the nine localities did not exceed 79 percent of the value of wages for janitors in State and local government. The greatest disparities occurred in Los Angeles and Hartford, where private industry janitors averaged about 60 percent of the wages of public sector janitors. The one locality in which private industry janitorial wages exceeded public sector wages was Louisville, Kentucky, in the East South Central division, where private industry janitors averaged $15.54, compared with $9.52 for their public sector counterparts.
Level of work. An important feature of the NCS is that each surveyed occupation is classified into a work level, based upon the duties and responsibilities of the job. Individuals in occupations at lower work levels typically perform simple, repetitive tasks that are clear-cut and require little decision making, under detailed guidelines and close supervision. Occupations at higher work levels generally require more extensive or specialized knowledge and skills, and work on tasks that are not so clear-cut, that may require decision making, without detailed guidelines or close supervision. Table 4 shows that wages generally increased as the work level increased.
Wages over time
Although NCS data on janitors were only published beginning in 1997, comparable data from the NCS predecessor, the Occupational Compensation Survey (OCS) program, are available starting in 1992. The data from these two surveys can be used to trace broadly the growth of janitorial wages through the 1990s. However, there are major differences in coverage between the two surveys that make it impossible to do more than look at broad patterns.11
During the last decade, janitorial wages grew at least 1 percent every year, though increases of less than 4 percent are generally not statistically significant. The sharpest rise came in 1997. (See chart 3.) This sharper rise could be attributed to the transition from the Occupational Compensation Survey to the NCS. In addition, increases in the minimum wage in 1996 and 1997 could have had an effect on the distribution of wages for janitors. The minimum wage rose from $4.25 to $4.75 per hour in October 1996, and from $4.75 to $5.15 per hour in September 1997.
Mean janitorial wages can also be compared with NCS data on wages for all occupations, for the service industry, and for all cleaning and building service occupations. The average wage for janitors and cleaners followed the same general patterns as these other occupational classifications.
The Employment Cost Index (ECI) is another source for information on wage and salary trends over time. The ECI is a sample survey used as a measure of the cost of labor, free from the influences of employment shifts among occupations and industries.12 The ECI provides data for the civilian economy, which includes workers in private industry and State and local government, and for more detailed worker groups, such as service occupations. Although the ECI percent-change series are published for all four quarters of the year, this study examined only the third quarter series.13
The ECI 12-month percent-change series for service occupations showed the same pattern of fluctuations as NCS janitor wage data during the 1992-2000 period. (See chart 3.) Like the janitorial wage, the ECI service occupations data series experienced continuous growth through all 8 years. However, the ECI series did not show the sharp rise recorded by NCS for 1997. This may be, in part, a reflection of the broad coverage of the service workers series, which includes higher paid occupations such as police officers and firefighters that are unlikely to be affected dramatically by minimum wage increases.
Union coverage
Pre-NCS surveys showed that a minority of janitors had been covered by union agreements.14 Although NCS publishes collective bargaining status data for broad industry groups, it does not regularly publish specific data on union coverage for janitors. However, special tabulations from NCS data run for this article showed that janitors are still a lightly unionized occupation.15
The tabulations also showed that nonunionized janitors earn less than janitors covered by union agreements. Among janitors at all levels, nonunion janitors earned $8.60 per hour, 72 percent of the $11.98 earned by union janitors. In addition, in each of the seven levels, nonunion janitors earned less than union janitors did. However, the difference between union and nonunion wages tended to decrease as the level of work increased. For example, at level 2, nonunion janitors averaged $8.15 per hour, 64 percent of the wage earned by union janitors ($12.75). At level 5, however, the $14.00 rate for nonunion janitors was 93 percent of the $15.05 rate for union janitors.
Building Cleaning and Maintenance Services
Building cleaning and maintenance services, not elsewhere classified (SIC 7349) is already the largest employer of janitors, and is expected to be the fastest growing employer in the future, according to the 2002-03 Occupational Outlook Handbook. The industry is defined as "Establishments primarily engaged in furnishing building cleaning and maintenance services, not elsewhere classified, such as window cleaning, janitorial service, floor waxing, and office cleaning."16 The NCS does not regularly publish data on wages in SIC 7349, but special tabulations show that there are substantial differences between wages in this industry and wages in other industries.17
The data indicate that janitors employed by building cleaning and maintenance services are paid less than janitors employed in other industries, and that the janitors in this industry tend to belong to lower work levels. (See table 4.) Among all janitors, those employed by SIC 7349 establishments averaged $7.60 per hour, while janitors in other industries averaged $9.67. In each of the three levels for which comparative data were available, janitors in SIC 7349 establishments earned less than janitors employed in other industries.
Pay in this industry follows patterns characteristic of service industries generally: Service industries often pay employees in occupations not specific to a particular industry, such as janitors, lower wages than other industries do. For example, in 1999, when NCS published data for major private industry divisions, cleaning and building service workers employed in service industries earned $8.17 an hour, compared with $11.63 in manufacturing, $10.57 in wholesale trade, and $10.49 in finance, insurance, and real estate.18
The difference between wages in building cleaning and maintenance services and other private industries tended to increase as work level increased. The average hourly wage for level-1 janitors in SIC 7349 was $7.46, which is 91 percent of the average for janitors in other industries ($8.24). However, level-3 janitors employed by SIC 7349 establishments earned $9.14, which is 88 percent of the $10.39 earned by janitors in other industries.
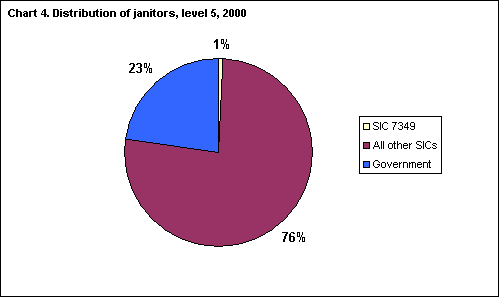
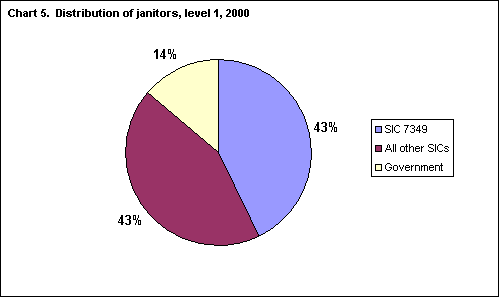
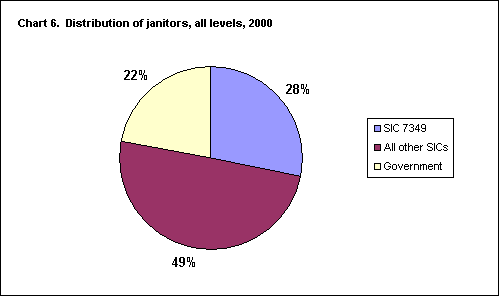
Janitorial jobs in SIC 7349 tended to have lower work levels than those in other industries. (See chart 4, chart 5, and chart 6.) Among all levels of janitors, 28 percent were employed by SIC 7349 establishments, 49 percent by establishments in other private industries, and 22 percent by government institutions (including school districts). At level 1, the percentage of janitors employed in SIC 7349 increased to 43 percent, another 43 percent were employed in other private industries, and 14 percent in government. However, at level 5, only 1 percent of janitors were employed by SIC 7349 establishments, with 76 percent employed by other private industries and 23 percent employed by government.
This pattern of heavy lower level employment may occur because SIC 7349 establishments often contract janitors out on a temporary basis, so there is little chance for advancement to a supervisory position within a workplace. Another reason is that janitors are contracted to establishments with a maintenance management structure already in place. Also, janitors employed in SIC 7349 probably specialize in simple cleaning tasks that can be used in a variety of workplaces.
On the other hand, janitors employed on an individual basis by establishments might by necessity have more skilled and detailed job duties, such as simple repairs and painting, especially if the establishment is small and employs only a small maintenance staff. Also, when employed by a single establishment, janitors have a greater opportunity to move through the ranks and earn a supervisory position. An examination of individual job titles seems to support this explanation, since most of the janitors in SIC 7349 are described as general cleaners, with very few specializing in maintenance or repairs.
Conclusion
The job of a janitor may seem like a simple job, and therefore one might expect to find a monolithic wage structure in the occupation. A look at the data shows otherwise: Janitorial wages vary considerably by the characteristics of the employer (geographic location, sector, and industry) and of the job (level of job duties and collective bargaining status). The wealth of data available from the National Compensation Survey allows the examination of janitorial wages from a variety of perspectives.
Laura Pfuntner
is a student at St. John’s College, University of Oxford, and was a summer intern in the Division of Safety and Health Statistics, Office of Technology and Survey Processing, Bureau of Labor Statistics.
Notes
1 When examining patterns in wage data, it is important to note that differences in wages tabulated according to one characteristic may be affected by other characteristics. For example, janitors covered by union agreements tend to be in jobs that are at higher levels than janitors not covered by union agreements. Thus, differences in work levels could account for some of the disparity between union and nonunion wages. Characteristics such as industry or sector, full- versus part-time work schedule, and geographic area could also impact wage comparisons. Sorting out the independent impact of each characteristic requires using such techniques as multiple regression analysis, which is beyond the scope of this article.
2 See Appendix A: Technical Note, National Compensation Survey: Occupational Wages in the United States, 2000, Bulletin 2548 (Bureau of Labor Statistics, 2001), for more information on NCS scope and methodology.
3 "Building Cleaning Workers," Occupational Outlook Handbook, 2002-03 Edition, Bulletin 2540 (Bureau of Labor Statistics, January 2002), on the Internet at http://www.bls.gov/oco/ocos174.htm (visited November 20, 2003).
4 These estimates are from the Occupational Employment Survey for for SOC 37-2011, Janitors and Cleaners.
5 "Building Cleaning Workers," Occupational Outlook Handbook. For more details, see Daniel E. Hecker, "Occupational employment projections to 2010," Monthly Labor Review, November 2001, p. 70.
6 See National Compensation Survey: Occupational Wages in the United States, 2000, Bulletin 2548 (Bureau of Labor Statistics, 2001) for published wage data.
7 The nine Census Divisions are New England (Connecticut, Maine, Massachusetts, New Hampshire, Rhode Island, Vermont); Middle Atlantic (New Jersey, New York, Pennsylvania); East North Central (Illinois, Indiana, Michigan, Ohio, Wisconsin); West North Central (Iowa, Kansas, Minnesota, Missouri, Nebraska, North Dakota, South Dakota); South Atlantic (Delaware, District of Columbia, Florida, Georgia, Maryland, North Carolina, South Carolina, Virginia, West Virginia); East South Central (Alabama, Kentucky, Mississippi, Tennessee); West South Central (Arkansas, Louisiana, Oklahoma, Texas); Mountain (Arizona, Colorado, Idaho, Montana, Nevada, New Mexico, Utah, Wyoming); Pacific (Alaska, California, Hawaii, Oregon, Washington).
8 Most of the calculations in this article are based on published average hourly wages from the National Compensation Survey. The main calculation is a percent value that shows the relationship of the average wages of two groups as a ratio. For example, the average hourly wage for janitors in New York City is $12.03, and the average wage of janitors in Amarillo, Texas is $8.08. The ratio of the Amarillo wage to the New York wage is .67 ($8.08 divided by $12.03), indicating that the Amarillo wage is 67 percent of the value of the New York wage.
9 Statements of comparisons made in this article are significant at a 1.6 standard error level or better (90-percent confidence interval), unless indicated otherwise.
10 Classification of metropolitan areas was based on population estimates for each from the 2000 Census of Population.
11 Differences include establishment coverage: In 1999, the NCS extended its scope to include establishments employing one to 49 persons, a practice it continued in 2000. Prior to 1999, the NCS wage publications included only establishments with 50 or more employees, as did the OCS program. Job description: Although not likely to be a major factor, by including workers who specialize in washing windows, the NCS job description for janitors is somewhat more inclusive than that used in the OCS program. Work schedule: The OCS program data were limited to full-time workers, whereas the NCS data cited also include part-time workers. The NCS year to year increases for full-time workers were: 15 percent in 1997, 4 percent in 1998, 2 percent in 1999, and 5 percent in 2000.
12 See Employment Cost Indexes, 1975-1999, Bulletin 2532 (Bureau of Labor Statistics, 2000) for more information on ECI scope and methodology and historical trends in compensation.
The reasoning for this choice was that the survey reference month for many of the NCS wages was September, which falls in the 3rd Quarter.
13 The reasoning for this choice was that the survey reference month for many of the NCS wages was September, which falls in the 3rd Quarter.
14 However, janitors are actually more heavily unionized than the workforce as a whole. While 25 percent of all janitors were covered by union agreements, according to the Current Population Survey, only 14.9 percent of the entire workforce was represented by unions in 2000.
15 Estimates of sample error are not available for the union-nonunion data; thus comparisons in this section have not been tested for statistical significance.
16 See Standard Industrial Classification Manual (Office of Management and Budget, 1987).
17 Estimates of sample error are not available for the SIC 7349 data; thus, comparisons in this section have not been tested for statistical significance.
18 For more information, see National Compensation Survey: Occupational Wages in the United States, 1999, Bulletin 2539 (Bureau of Labor Statistics, 2001).

