Charts from the "Tomorrow's Jobs" section of the 2008-2009 Occupational Outlook Handbook
- Chart 1. Population and labor force growth, 1986-96, 1996-2006, and projected 2006-16
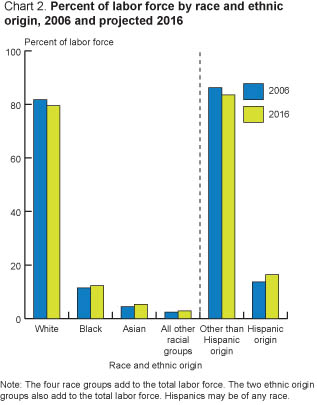
- Chart 2. Percent of labor force by race and ethnic origin, 2006 and projected 2016
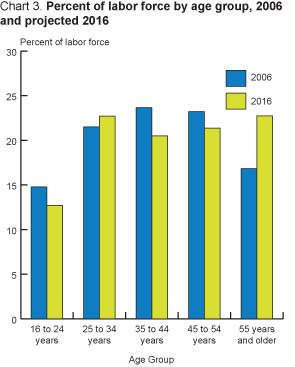
- Chart 3. Percent of labor force by age group, 2006 and projected 2016
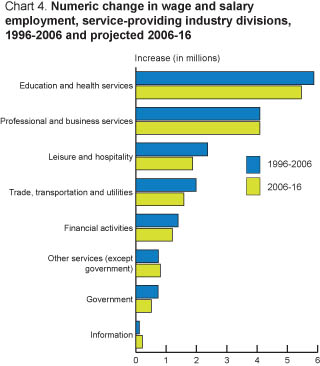
- Chart 4. Percent change in wage and salary employment, service-producing industry divisions, 1996-2006 and projected 2006-16
- Chart 5. Percent change in wage and salary employment, goods-producing industry divisions, 1996-2006 and projected 2006-16
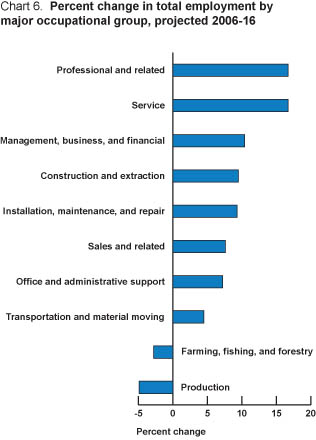
- Chart 6. Percent change in total employment by major occupational group, projected 2006-16
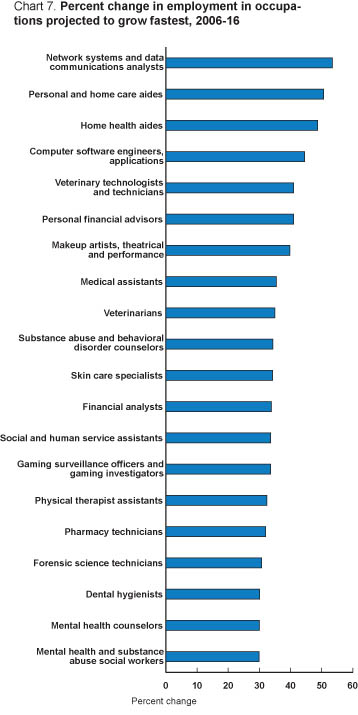
- Chart 7. Percent change in employment in occupations projected to grow fastest, 2006-16
- Chart 8. Job increases in occupations with the largest numerical increases in employment, 2006-16
- Chart 9. Occupations with the largest numerical decrease in employment, projected 2006-16
- Chart 10. Job openings due to growth and replacement needs by major occupational group, projected 2006-16
Last Modified Date: December 18, 2007
|

