Number of Older Americans
The growth of the population age 65 and over affects many aspects of our society,
challenging policymakers, families, businesses, and health care providers, among
others, to meet the needs of aging individuals.
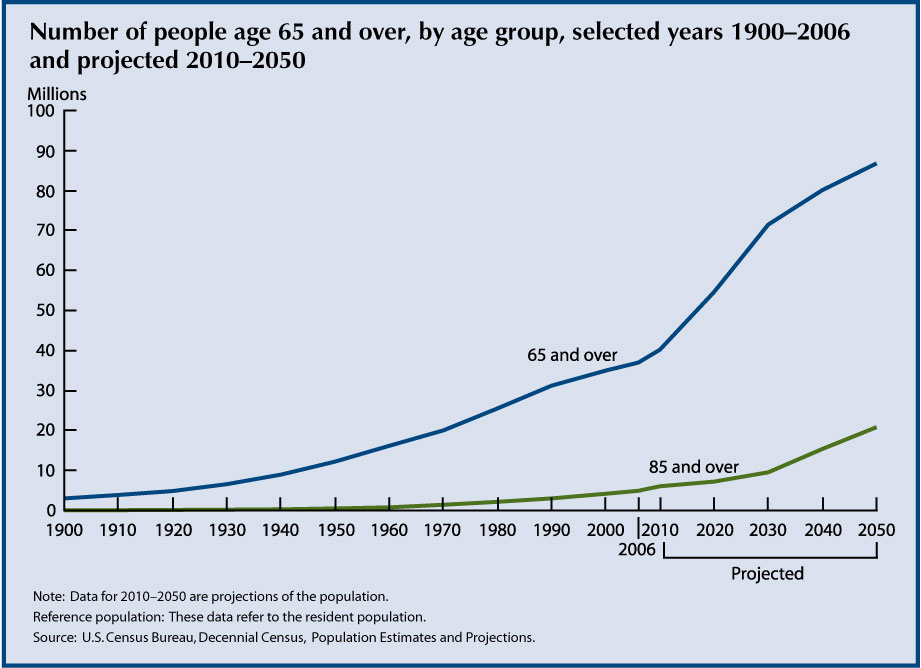
- In 2006, 37 million people age 65 and over lived in
the United States, accounting for just over 12 percent of the total population.
Over the 20th century, the older population grew from 3 million to 37 million. The
oldest-old population (those age 85 and over) grew from just over 100,000 in 1900
to 5.3 million in 2006.
- The Baby Boomers (those born between 1946 and 1964)
will start turning 65 in 2011, and the number of older people will increase dramatically
during the 2010–2030 period. The older population in 2030 is projected to be twice
as large as in 2000, growing from 35 million to 71.5 million and representing nearly
20 percent of the total U.S. population.
- The growth rate of the older population is projected
to slow after 2030, when the last Baby Boomers enter the ranks of the older population.
From 2030 onward, the proportion age 65 and over will be relatively stable, at around
20 percent, even though the absolute number of people age 65 and over is projected
to continue to grow. The oldest-old population is projected to grow rapidly after
2030, when the Baby Boomers move into this age group.
- The U.S. Census Bureau projects that the population
age 85 and over could grow from 5.3 million in 2006 to nearly 21 million by 2050.
Some researchers predict that death rates at older ages will decline more rapidly
than is reflected in the U.S. Census Bureau’s projections, which could lead to faster
growth of this population.1–3
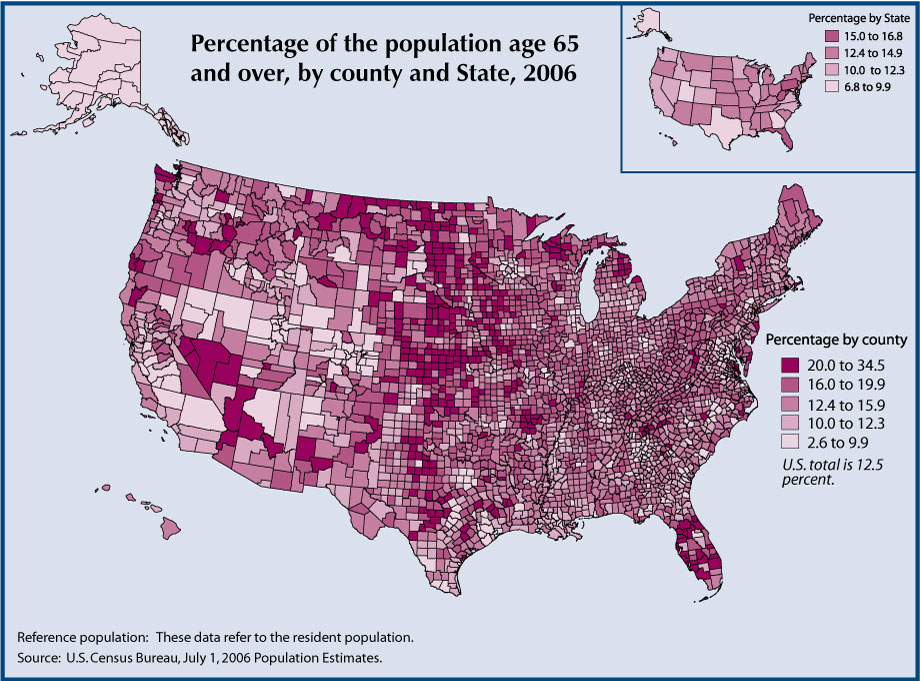
- The proportion of the population age 65 and over varies by State. This proportion
is partly affected by State fertility and mortality levels and partly by the number
of older and younger people who migrate to and from the State. In 2006, Florida
had the highest proportion of people age 65 and over, 17 percent. Pennsylvania and
West Virginia also had high proportions, over 15 percent.
- The proportion of the population age 65 and over varies even more by county. In
2006, 35 percent of McIntosh County, North Dakota, was age 65 and over, the highest
proportion in the country. In several Florida counties, the proportion was over
30 percent. At the other end of the spectrum was Chattahoochee County, Georgia,
with only 3 percent of its population age 65 and over.
- As in most countries of the world, older women outnumber older men in the United
States, and the proportion that is female increases with age. In 2006, women accounted
for 58 percent of the population age 65 and over and for 68 percent of the population
age 85 and over.
- The United States is fairly young for a developed country, with just over 12 percent
of its population age 65 and over. The older population made up more than 15 percent
of the population in most European countries and nearly 20 percent in both Italy
and Japan in 2006.
Data for this indicator’s charts and bullets can be found in Tables 1a, 1b, 1c,
1d, 1e, and 1f.
Racial and Ethnic Composition
As the older population grows larger, it will also grow more diverse, reflecting
the demographic changes in the U.S. population as a whole over the last several
decades. By 2050, programs and services for older people will require greater flexibility
to meet the needs of a more diverse population.
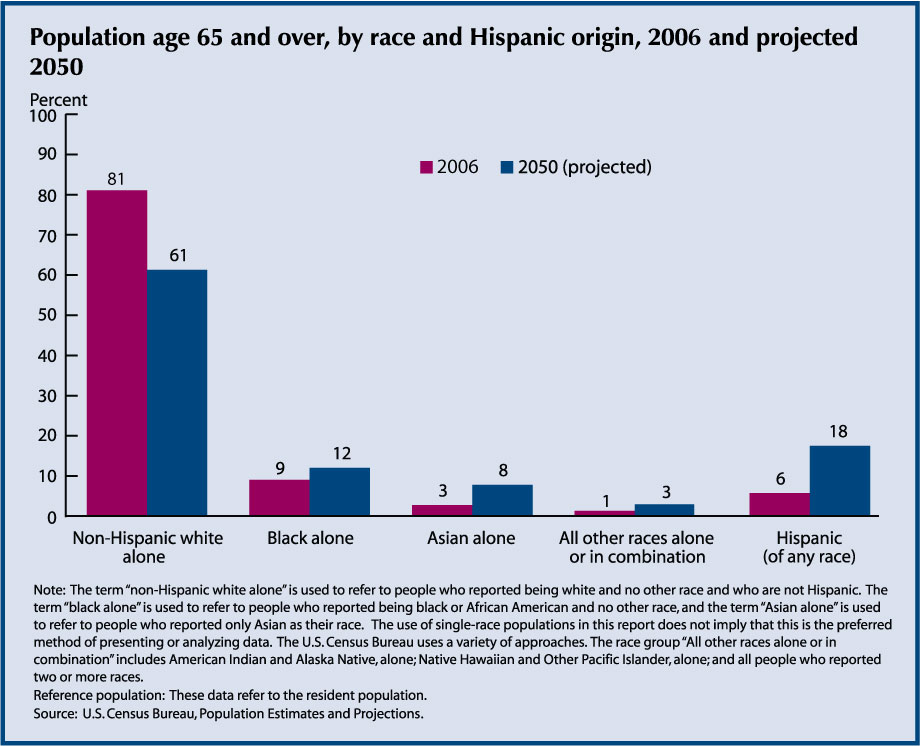
- In 2006, non-Hispanic whites accounted for 81 percent
of the U.S. older population. Blacks made up 9 percent, Asians made up 3 percent,
and Hispanics (of any race) accounted for 6 percent of the older population.
- Projections indicate that by 2050 the com-position
of the older population will be 61 percent non-Hispanic white, 18 percent Hispanic,
12 percent black, and 8 percent Asian.
- The older population among all racial and ethnic groups
will grow; however, the older Hispanic population is projected to grow the fastest,
from just over 2 million in 2005 to 15 million in 2050, and to be larger than the
older black population by 2028. The older Asian population is also projected to
experience a large increase. In 2006, just over 1 million older Asians lived in
the United States; by 2050 this population is projected to be almost 7 million.
Data for this indicator’s chart and bullets can be found in Table 2.
Marital Status
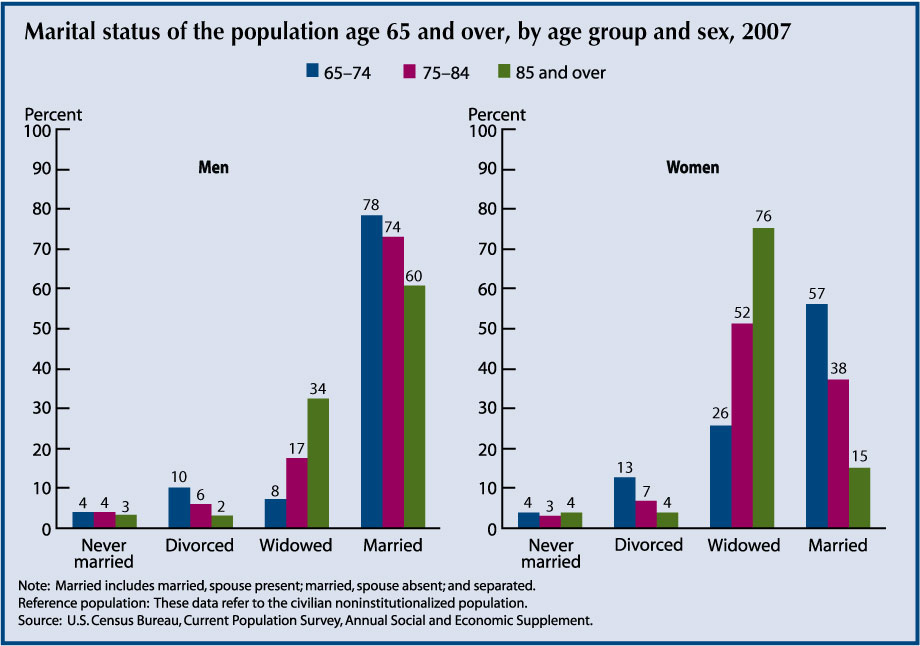
- In 2007, older men were much more likely than older women to be married. Over three-quarters
(78 percent) of men age 65–74 were married, compared with over one-half (57 percent)
of women in the same age group. The proportion married is lower at older ages: 38
percent of women age 75–84 and 15 percent of women age 85 and over were married.
For men, the proportion married also is lower at older ages but not as low as for
older women. Even among the oldest old, the majority of men were married (60 percent).
- Widowhood is more common among older women than older men. Women age 65 and over
were three times as likely as men of the same age to be widowed, 42 percent compared
with 13 percent. The proportion widowed is higher at older ages, and the proportion
widowed is higher for women than men. In 2007, 76 percent of women age 85 and over
were widowed, compared with 34 percent of men.
- Relatively small proportions of older men (8 percent) and women (10 percent) were
divorced in 2007. A small proportion of the older population had never married.
All comparisons presented for this indicator are significant at 0.10 confidence
level. Data for this indicator’s chart and bullets can be found in Table 3.
Educational Attainment
Educational attainment influences socioeconomic status, which in turn plays a role
in well-being at older ages. Higher levels of education are usually associated with
higher incomes, higher standards of living, and above-average health.
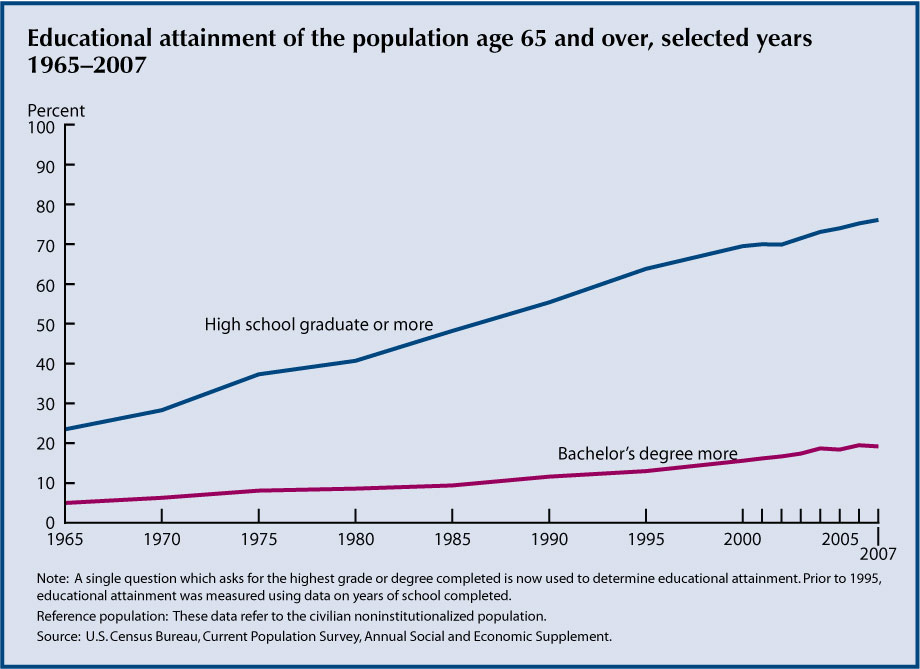
- In 1965, 24 percent of the older population had graduated
from high school, and only 5 percent had at least a bachelor’s degree. By 2007,
76 percent were high school graduates, and 19 percent had a bachelor’s degree or
more.
- In 2007, about 76 percent of both older men and older
women had at least a high school diploma. Older men attained at least a bachelor’s
degree more often than older women (25 percent compared with 15 percent). The gender
gap in completion of a college education will narrow in the future because men and
women in younger cohorts are earning college degrees at roughly the same rate.
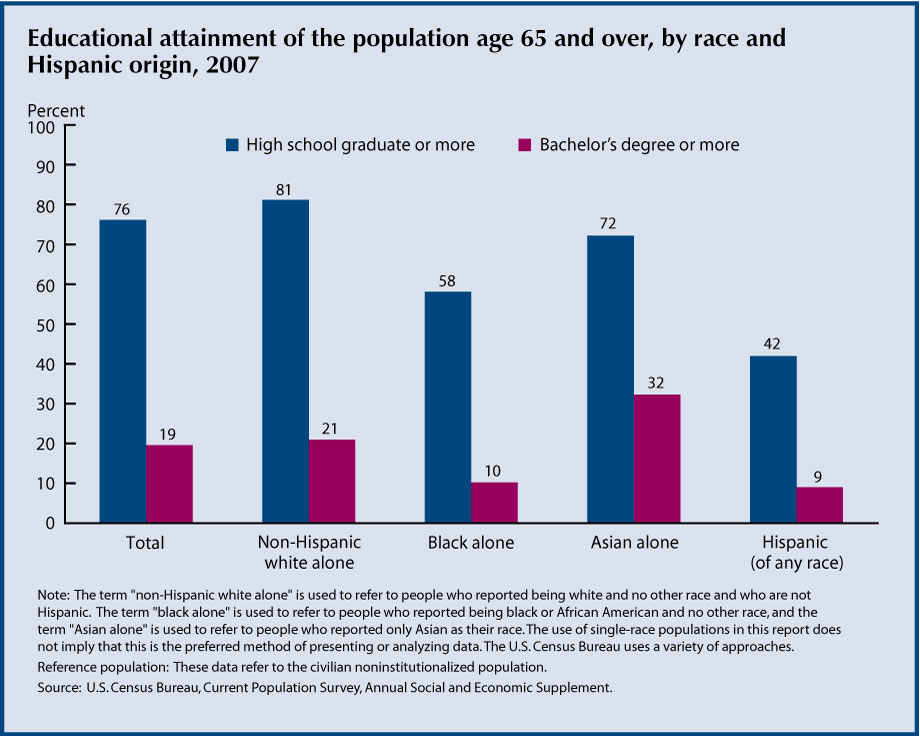
- Despite the overall increase in educational attainment among older Americans, substan-tial
educational differences exist among racial and ethnic groups. In 2007, 81 percent
of non-Hispanic whites age 65 and over had completed high school. Older Asians also
had a high proportion with at least a high school education (72 percent). In contrast,
58 percent of older blacks and 42 percent of older Hispanics had completed high
school.
- In 2007, older Asians had the highest pro-portion with at least a bachelor’s degree
(32 percent). Almost 21 percent of older non-Hispanic whites had this level
of education. The proportions were 10 percent and 9 percent, respectively, for older
blacks and Hispanics.
All comparisons presented for this indicator are significant at 0.10 confidence
level. Data for this indicator’s charts and bullets can be found in Tables 4a and
4b.
Living Arrangements
The living arrangements of America’s older population are important indicators because
they are linked to income, health status, and the availability of caregivers. Older
people who live alone are more likely than older people who live with their spouses
to be in poverty.
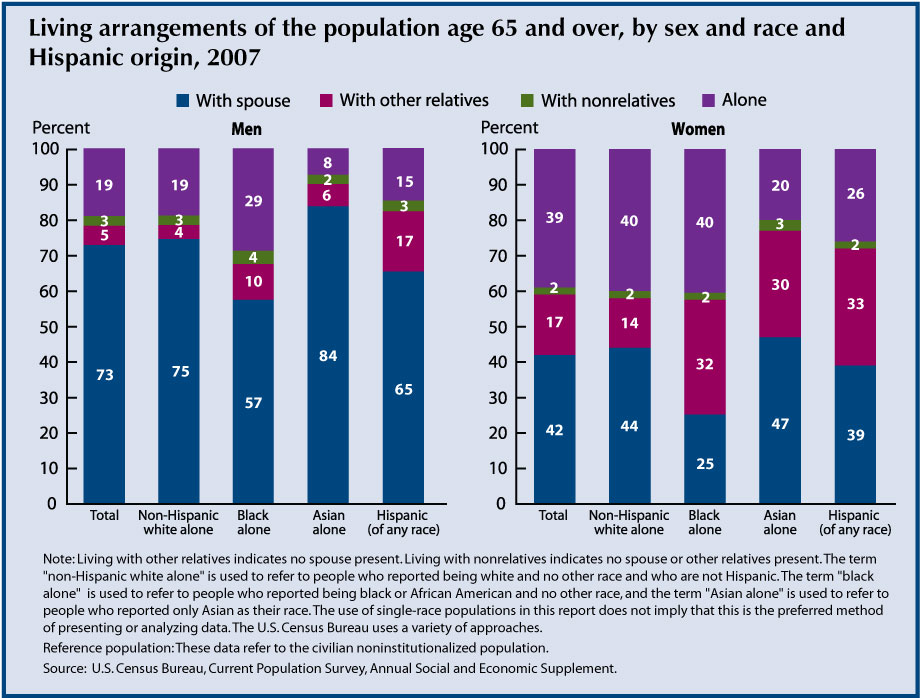
- Older men were more likely to live with their spouse
than were older women. In 2007, 73 percent of older men lived with their spouse
while less than one-half (42 percent) of older women did. In contrast, older women
were more than twice as likely as older men to live alone (39 percent and 19 percent,
respectively).
- Living arrangements of older people differed by race
and Hispanic origin. Older black, Asian, and Hispanic women were more likely than
non-Hispanic white women to live with relatives other than a spouse. For example,
in 2007, 30 percent of older Asian women, 32 percent of older black women, and 33
percent of older Hispanic women, compared with only 14 percent of older non-Hispanic
white women, lived with other relatives. Older non-Hispanic white women and black
women were more likely than women of other races to live alone (about 40 percent
each, compared with 20 percent for older Asian women and 26 percent for older Hispanic
women). Older black men lived alone more than three times as often as older Asian
men (29 percent compared with 8 percent). Older Hispanic men were more likely (17
percent) than men of other races and ethnicities to live with relatives other than
a spouse.
All comparisons presented for this indicator are significant at 0.10 confidence
level. Data for this indicator’s chart and bullets can be found in Tables 5a, 5b,
and 7b on pages 79 and 82.
Older Veterans
Veteran status of America’s older population is associated with higher median family
income, lower percentage of uninsured or coverage by Medicaid, higher percentage
of functional limitations in activities of daily living or instrumental activities
of daily living, greater likelihood of having any disability, and less likelihood
of rating their general health status as good or better.4 The large increase in
the oldest segment of the veteran population will continue to have significant ramifications
on the demand for health care services, particularly in the area of long-term care.5
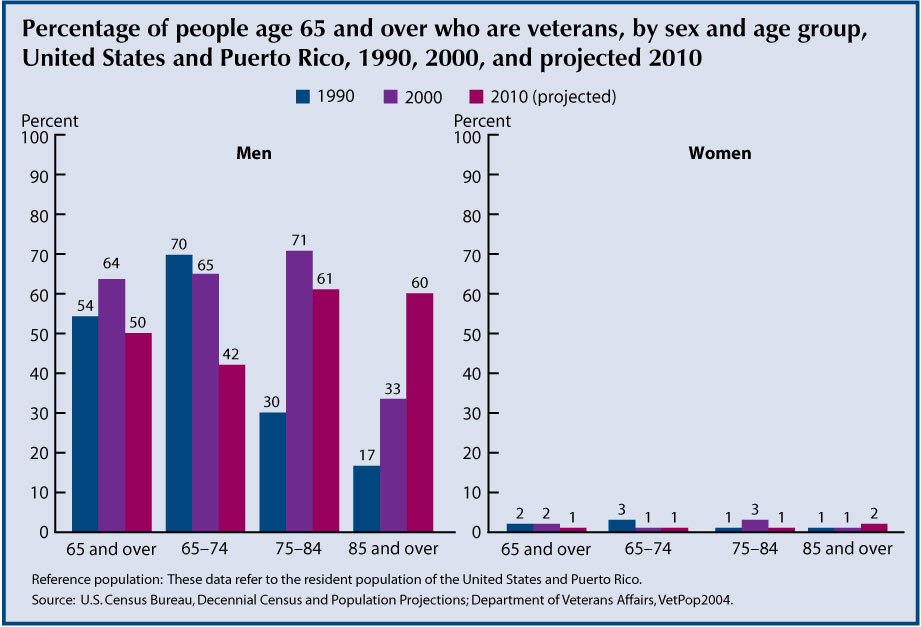
- According to Census 2000, there were 9.7 million veterans
age 65 and over in the United States and Puerto Rico. Two of three men age 65 and
over were veterans.
- More than 95 percent of veterans age 65 and over are
male. Because of the large Korean War and WWII veteran cohorts, the number of male
veterans age 65 and over increased from 7.0 million in 1990 to 9.4 million in 2000.
- The increase in the proportion of men age 85 and over
who are veterans is striking. The number of men age 85 and over who are veterans
has more than doubled between 1990 and 2000 from 150,000 to 400,000 and is projected
to reach almost 1.2 million by 2010. The proportion of men age 85 and over
who are veterans is projected to increase from 33 percent in 2000 to 60 percent
in 2010.
- Between 2000 and 2010, the number of female veterans
age 85 and over is projected to increase from about 30,000 to 95,000.
Data for this indicator’s chart and bullets can be found in Tables 6a and 6b.