Department of Health and Human Services
Centers for Disease Control and Prevention
|
|
||||||||||||||||
|
|
|
|
|
|||||||||||||
|
|
Control and Prevention Division of Cancer Prevention and Control 4770 Buford Hwy, NE MS K-64 Atlanta, GA 30341-3717 Call: 1 (800) CDC-INFO TTY: 1 (888) 232-6348 FAX: (770) 488-4760 E-mail: cdcinfo@cdc.gov Submit a Question Online |
|
|
|
MammographyMammography Percentages by Race and EthnicityThe graph below shows the percentage of women aged 40 years and older who had a mammogram in the last two years, grouped by race and ethnicity and the year when they had their mammogram done. For example, in 1987, more white women than any other racial or ethnic group had a mammogram. By 2003, the same percentage of white and black women got mammograms. American Indian/Alaska Native, Asian/Pacific Islander, and Hispanic women were less likely to have had a mammogram. Percentage of U.S. Women Aged 40 Years and Older Who Have Had a Mammogram in the Last 2 Years by Race and Ethnicity† 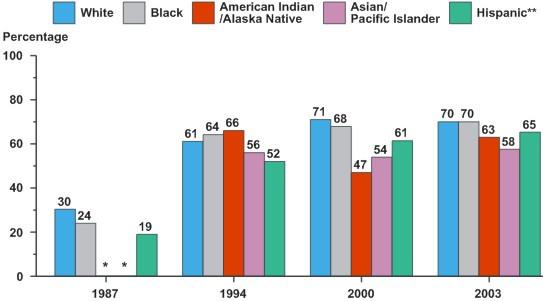
*Estimates are considered unreliable. Mammography Percentages by Level of EducationThe percentages of mammography screening vary by level of education. Women with the most years of schooling are most likely to have had a mammogram in the last two years. The graph below shows the percentage of women aged 40 years and older who had a mammogram in the last two years, based on their highest level of education. The percentage of women getting a mammogram increases as the number of years of schooling increase. For example, in 1987, 18% of women with less than a high school education had a mammogram. In 2003, this percentage goes up to 58%; however, the percentage of women who went to college and got a mammogram is much higher. Percentage of U.S. Women Aged 40 and Older Who Have Had a Mammogram in the Last 2 Years by Education Level† 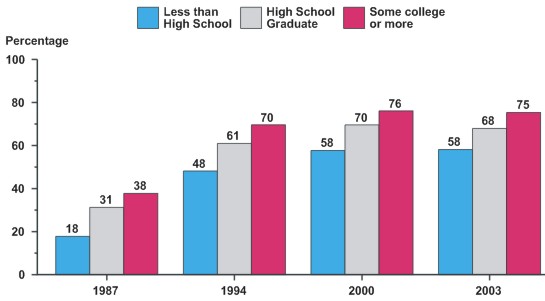
†Source: National Center for Health Statistics. National Health Interview Survey in Health, United States, 2005 with Chartbook on Trends in the Health of Americans. Breast Cancer Screening in the United States by StateThe percentage of women in the United States who had a mammogram varies from state to state. Idaho has the lowest percentage of women getting a mammogram. Massachusetts has the highest percentage of women getting a mammogram. The map below shows how many women aged 40 years and older had a mammogram in the last two years by state in 2006. Percent of U.S. Women Aged 40 Years and Older Who Have Had a Mammogram in the Last 2 Years by State, 2006† 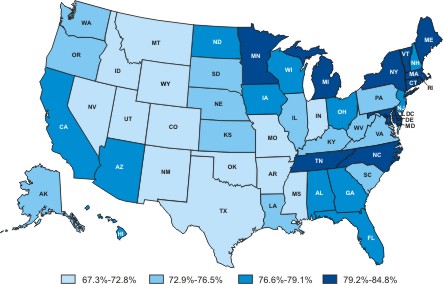
The states with the lowest breast cancer screening percentages (67.3% to 72.8%) include Arkansas, Colorado, Idaho, Indiana, Mississippi, Missouri, Montana, Nevada, New Mexico, Oklahoma, Texas, Utah, and Wyoming. The states with screening percentages in the second quartile (72.9% to 76.5%) include Alaska, Illinois, Kansas, Kentucky, Louisiana, Nebraska, Oregon, Pennsylvania, South Carolina, South Dakota, Virginia, Washington, and West Virginia. The states with screening percentages in the third quartile (76.6% to 79.1%) include Alabama, Arizona, California, Florida, Georgia, Hawaii, Iowa, New Hampshire, New Jersey, North Dakota, Ohio, and Wisconsin. The states with the highest screening percentages (79.2% to 84.8%) include Connecticut, Delaware, the District of Columbia, Maine, Maryland, Massachusetts, Michigan, Minnesota, New York, North Carolina, Rhode Island, Tennessee, and Vermont. †Source: Centers for Disease Control and Prevention (CDC). Behavioral Risk Factor Surveillance System Survey Data. Atlanta, Georgia: U.S. Department of Health and Human Services, Centers for Disease Control and Prevention, 2007.
Page last reviewed: October 10, 2007
Page last updated: April 21, 2008 Content source: Division of Cancer Prevention and Control, National Center for Chronic Disease Prevention and Health Promotion |
|
|||||||||||||||||||||||||||||||||||||||||||||||||||||||||||||||||||||||||||||||||||||||||||||||
|
|
|
||||||||||||
|