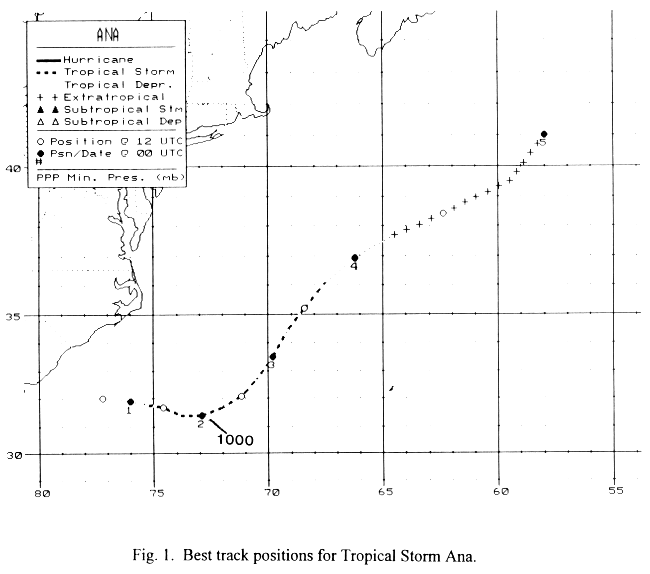
a. Synoptic History
Ana formed as a tropical depression from a
frontal low pressure system just off the coast of South Carolina on 30 June. It moved slowly
eastward and became a tropical storm with
40-knot sustained winds on the next day even as vertical wind shear
limited convective development near the center of the low-level circulation. A deepening
short-wave trough moved to eastern North America and accelerated the storm toward the northeast
on the 2nd and 3rd. On 4 June, Ana became extra-tropical
while moving over colder water and then dissipated. Fig. 1 (30K GIF)
shows the best track of the storm and the track is tabulated in
Table 1. Ana did not affect land.
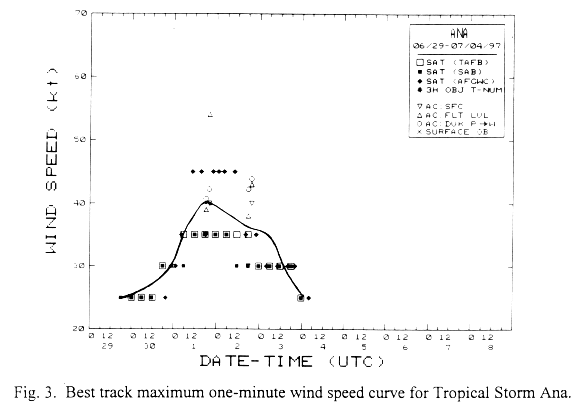
b. Meteorological Statistics
Figures 2 (16K GIF) and
3 (17K GIF) show curves of minimum sea-level
pressure and maximum one-minute surface wind speed, respectively, as a
function of time. Satellite data plotted in these figures are based on the
Dvorak satellite intensity estimating technique as applied at the
Tropical Analysis and Forecast Branch (TAFB), the
Satellite Analysis Branch
(SAB) and the U.S. Air
Force Global Weather Center (AFGWC).
A
USAF Reserve reconnaissance aircraft
flew into Ana on the afternoon of 1 July and measured a 54-knot
wind speed in the northeast quadrant at 1500 feet and a minimum surface pressure of
1000 millibars. These values are the basis for the maximum one-minute surface wind speed of
40 knots and the minimum sea level
pressure as given in Table 1.
c. Casualty and Damage Statistics
There were none.
d. Forecast and Warning Critique
Ana was a tropical storm for 60 hours, during which there were
ten official forecasts issued. The official track errors are
small compared to past performance, but none of the forecasts
verified at 72 hours.
![[NCEP Logo]](graphics/ncep.gif)