|
|  |
 |
|
|
2006
National Survey on Drug Use & Health: National Results
|
Highlights
This report presents the first information from the 2006 National Survey
on Drug Use and Health (NSDUH), an annual survey sponsored by the Substance
Abuse and Mental Health Services Administration (SAMHSA). The survey is the
primary source of information on the use of illicit drugs, alcohol, and tobacco
in the civilian, noninstitutionalized population of the United States aged
12 years old or older. The survey interviews approximately 67,500 persons
each year. Unless otherwise noted, all comparisons in this report described
using terms such as "increased," "decreased," or "more
than" are statistically significant at the .05 level.
Illicit Drug Use
- In 2006, an estimated 20.4 million Americans aged 12 or older were current
(past month) illicit drug users, meaning they had used an illicit drug during
the month prior to the survey interview. This estimate represents 8.3 percent
of the population aged 12 years old or older. Illicit drugs include marijuana/hashish,
cocaine (including crack), heroin, hallucinogens, inhalants, or prescription-type
psychotherapeutics used nonmedically.
- The rate of current illicit drug use among persons aged 12 or older in
2006 (8.3 percent) was similar to the rate in 2005 (8.1 percent).
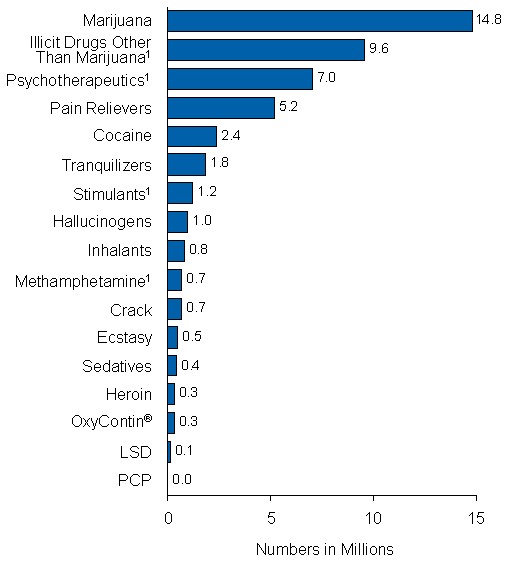
- Marijuana was the most commonly used illicit drug (14.8 million past month
users). Among persons aged 12 or older, the rate of past month marijuana
use was the same in 2006 (6.0 percent) as in 2005.
- In 2006, there were 2.4 million current cocaine users aged 12 or older,
which was the same as in 2005 but greater than in 2002 when the number was
2.0 million. However, the rate of current cocaine use remained stable between
2002 and 2006.
- Hallucinogens were used in the past month by 1.0 million persons (0.4 percent)
aged 12 or older in 2006, including 528,000 (0.2 percent) who had used
Ecstasy. These estimates are similar to the corresponding estimates for
2005.
- There were 7.0 million (2.8 percent) persons aged 12 or older who
used prescription-type psychotherapeutic drugs nonmedically in the
past month. Of these, 5.2 million used pain relievers, an increase from
4.7 million in 2005.
- In 2006, there were an estimated 731,000 current users of methamphetamine
aged 12 or older (0.3 percent of the population). These estimates do
not differ significantly from estimates for 2002, 2003, 2004, and 2005 and
are all based on new survey items added to NSDUH in 2006 to improve the
reporting of methamphetamine use. These improved estimates should not be
compared with estimates of methamphetamine use shown in prior NSDUH reports.
- Among youths aged 12 to 17, current illicit drug use rates remained stable
from 2005 to 2006. However, youth rates declined significantly between 2002
and 2006 for illicit drugs in general (from 11.6 to 9.8 percent) and
for several specific drugs, including marijuana, hallucinogens, LSD, Ecstasy,
prescription-type drugs used nonmedically, pain relievers, tranquilizers,
and the use of illicit drugs other than marijuana.
- The rate of current marijuana use among youths aged 12 to 17 declined
from 8.2 percent in 2002 to 6.7 percent in 2006. Among male youths,
the rate declined from 9.1 to 6.8 percent, but among female youths
the rates in 2002 (7.2 percent) and 2006 (6.4 percent) were not
significantly different.
- There were no significant changes in past month use of any drugs among
young adults aged 18 to 25 between 2005 and 2006. The rate of past year
use increased for Ecstasy (from 3.1 to 3.8 percent) and decreased for
inhalants (2.1 to 1.8 percent).
- From 2002 to 2006, the rate of current use of marijuana among young adults
aged 18 to 25 declined from 17.3 to 16.3 percent. Past month nonmedical
use of prescription-type drugs among young adults increased from 5.4 percent
in 2002 to 6.4 percent in 2006. This was primarily due to an increase
in the rate of pain reliever use, which was 4.1 percent in 2002 and
4.9 percent in 2006. However, nonmedical use of tranquilizers also
increased over the 5-year period (from 1.6 to 2.0 percent).
- Among persons aged 12 or older who used pain relievers nonmedically in
the past 12 months, 55.7 percent reported that the source of the drug
the most recent time they used was from a friend or relative for free. Another
19.1 percent reported they got the drug from just one doctor. Only
3.9 percent got the pain relievers from a drug dealer or other stranger,
and only 0.1 percent reported buying the drug on the Internet. Among
those who reported getting the pain reliever from a friend or relative for
free, 80.7 percent reported in a follow-up question that the friend
or relative had obtained the drugs from just one doctor.
- Among unemployed adults aged 18 or older in 2006, 18.5 percent were
current illicit drug users, which was higher than the 8.8 percent of
those employed full time and 9.4 percent of those employed part time.
However, most drug users were employed. Of the 17.9 million current illicit
drug users aged 18 or older in 2006, 13.4 million (74.9 percent) were
employed either full or part time.
- In 2006, there were 10.2 million persons aged 12 or older who reported
driving under the influence of illicit drugs during the past year. This
corresponds to 4.2 percent of the population aged 12 or older, similar
to the rate in 2005 (4.3 percent), but lower than the rate in 2002
(4.7 percent). In 2006, the rate was highest among young adults aged
18 to 25 (13.0 percent).
Alcohol Use
- Slightly more than half of Americans aged 12 or older reported being current
drinkers of alcohol in the 2006 survey (50.9 percent). This translates
to an estimated 125 million people, which is similar to the 2005 estimate
of 126 million people (51.8 percent).
- More than one fifth (23.0 percent) of persons aged 12 or older participated
in binge drinking (having five or more drinks on the same occasion on at
least 1 day in the 30 days prior to the survey) in 2006. This translates
to about 57 million people, similar to the estimate in 2005.
- In 2006, heavy drinking was reported by 6.9 percent of the population
aged 12 or older, or 17 million people. This rate is similar to the rate
of heavy drinking in 2005 (6.6 percent). Heavy drinking is defined
as binge drinking on at least 5 days in the past 30 days.
- In 2006, among young adults aged 18 to 25, the rate of binge drinking
was 42.2 percent, and the rate of heavy drinking was 15.6 percent.
These rates are similar to the rates in 2005.
- The rate of current alcohol use among youths aged 12 to 17 was 16.6 percent
in 2006. Youth binge and heavy drinking rates were 10.3 and 2.4 percent,
respectively. These rates are essentially the same as the 2005 rates.
- Underage (persons aged 12 to 20) past month and binge drinking rates have
remained essentially unchanged since 2002. In 2006, about 10.8 million persons
aged 12 to 20 (28.3 percent of this age group) reported drinking alcohol
in the past month. Approximately 7.2 million (19.0 percent) were binge
drinkers, and 2.4 million (6.2 percent) were heavy drinkers.
- Among persons aged 12 to 20, past month alcohol use rates were 18.6 percent
among blacks, 19.7 percent among Asians, 25.3 percent among Hispanics,
27.5 percent among those reporting two or more races, 31.3 percent
among American Indians or Alaska Natives, and 32.3 percent among whites.
The 2006 rate for American Indians or Alaska Natives is higher than the
2005 rate of 21.7 percent.
- Among pregnant women aged 15 to 44, binge drinking in the first trimester
dropped from 10.6 percent in 2003-2004 combined data to 4.6 percent
in 2005-2006 combined data.
- In 2006, an estimated 12.4 percent of persons aged 12 or older drove
under the influence of alcohol at least once in the past year. This percentage
has decreased since 2002, when it was 14.2 percent. The 2006 estimate
corresponds to 30.5 million persons.
Tobacco Use
- In 2006, an estimated 72.9 million Americans aged 12 or older were current
(past month) users of a tobacco product. This represents 29.6 percent
of the population in that age range. In addition, 61.6 million persons (25.0 percent
of the population) were current cigarette smokers; 13.7 million (5.6 percent)
smoked cigars; 8.2 million (3.3 percent) used smokeless tobacco; and
2.3 million (0.9 percent) smoked tobacco in pipes.
- The rates of current use of cigarettes, smokeless tobacco, cigars, and
pipe tobacco were unchanged between 2005 and 2006 among persons aged 12
or older. However, between 2002 and 2006, past month cigarette use decreased
from 26.0 to 25.0 percent. Rates of past month use of cigars, smokeless
tobacco, and pipe tobacco were similar in 2002 and 2006.
- The rate of past month cigarette use among 12 to 17 year olds declined
from 13.0 percent in 2002 to 10.4 percent in 2006. However, past
month smokeless tobacco use was higher in 2006 (2.4 percent) than in
2002 (2.0 percent).
- Among pregnant women aged 15 to 44, combined data for 2005 and 2006 indicated
that the rate of past month cigarette use was 16.5 percent. The rate
was higher among women in that age group who were not pregnant (29.5 percent).
Initiation of Substance Use (Incidence, or First-Time Use)
- The illicit drug use categories with the largest number of recent initiates
among persons aged 12 or older were nonmedical use of pain relievers (2.2
million) and marijuana use (2.1 million). These estimates are not significantly
different from the numbers in 2005.
- In 2006, there were 783,000 persons aged 12 or older who had used inhalants
for the first time within the past 12 months; 77.2 percent were under
age 18 when they first used. There was no significant change in the number
of inhalant initiates from 2005 to 2006.
- The number of recent new users of methamphetamine taken nonmedically among
persons aged 12 or older was 259,000 in 2006. This estimate was not significantly
different from the estimates from 2002 to 2005.
- Ecstasy initiation, which had declined from 1.2 million in 2002 to about
600,000 per year during 2004 and 2005, increased to 860,000 in 2006.
- Most (89.2 percent) of the 4.4 million recent alcohol initiates were
younger than 21 at the time of initiation.
- The number of persons aged 12 or older who smoked cigarettes for the first
time within the past 12 months was 2.4 million in 2006, which was significantly
greater than the estimate for 2002 (1.9 million). Most new smokers in 2006
were under age 18 when they first smoked cigarettes (61.2 percent).
Youth Prevention-Related Measures
- Perceived risk is measured by NSDUH as the percentage reporting that there
is great risk in the substance use behavior. Among youths aged 12 to 17,
there were no changes in the perceived risk of marijuana, cocaine, or heroin
between 2005 and 2006. However, between 2002 and 2006, there were increases
in the perceived risk of smoking marijuana once a month (from 32.4 to 34.7 percent)
and smoking marijuana once or twice a week (from 51.5 to 54.2 percent).
On the other hand, the percentage of youths who perceived that trying heroin
once or twice is a great risk declined from 58.5 percent in 2002 to
57.2 percent in 2006, and those who perceived that using cocaine once
a month is a great risk declined from 50.5 to 49.0 percent. There was
also a decrease in the perceived risk of using LSD once or twice a week,
from 76.1 percent in 2005 to 74.7 percent in 2006.
- The proportion of youths aged 12 to 17 who reported perceiving great risk
from smoking one or more packs of cigarettes per day increased from 63.1 percent
in 2002 to 68.7 percent in 2006.
- About half (50.1 percent) of youths aged 12 to 17 reported in 2006
that it would be "fairly easy" or "very easy" for them
to obtain marijuana if they wanted some. Around one quarter reported it
would be easy to get cocaine (25.9 percent). About one in seven (14.4 percent)
indicated that heroin would be "fairly" or "very" easily
available, and 14.0 percent reported easy availability for LSD.
- Among youths, the perceived availability decreased between 2002 and 2006
for marijuana (from 55.0 to 50.1 percent), heroin (from 15.8 to 14.4 percent),
and LSD (from 19.4 to 14.0 percent). However, the percentage reporting
that it would be easy to obtain cocaine showed no decline over this period
(25.0 percent in 2002 and 25.9 percent in 2006).
- A majority of youths (90.4 percent) in 2006 reported that their parents
would strongly disapprove of their trying marijuana or hashish once or twice.
Current marijuana use was much less prevalent among youths who perceived
strong parental disapproval for trying marijuana or hashish once or twice
than for those who did not (4.6 vs. 26.5 percent).
- In 2006, 11.4 percent of youths reported that they had participated
in substance use prevention programs outside of school within the past year.
Approximately four fifths (79.4 percent) reported having seen or heard
drug or alcohol prevention messages from sources outside of school, lower
than in 2005 when the percentage was 81.1 percent. Most (59.8 percent)
youths reported in 2006 that they had talked with a parent in the past year
about the dangers of drug, tobacco, or alcohol use.
Substance Dependence, Abuse, and Treatment
- In 2006, an estimated 22.6 million persons (9.2 percent of the population
aged 12 or older) were classified with substance dependence or abuse in
the past year based on criteria specified in the Diagnostic and Statistical
Manual of Mental Disorders, 4th edition (DSM-IV). Of
these, 3.2 million were classified with dependence on or abuse of both alcohol
and illicit drugs, 3.8 million were dependent on or abused illicit drugs
but not alcohol, and 15.6 million were dependent on or abused alcohol but
not illicit drugs.
- Between 2002 and 2006, there was no change in the number of persons with
substance dependence or abuse (22.0 million in 2002, 22.6 million in 2006).
- The specific illicit drugs that had the highest levels of past year dependence
or abuse in 2006 were marijuana (4.2 million), followed by cocaine (1.7
million) and pain relievers (1.6 million).
- Adults aged 21 or older who had first used alcohol before age 21 were
more likely than adults who had their first drink at age 21 or older to
be classified with alcohol dependence or abuse (9.6 vs. 2.4 percent).
- There were 4.0 million persons aged 12 or older (1.6 percent of the
population) who received some kind of treatment for a problem related to
the use of alcohol or illicit drugs in 2006. More than half (2.2 million)
received treatment at a self-help group. There were 1.6 million persons
who received treatment at a rehabilitation facility as an outpatient, 1.1
million at a mental health center as an outpatient, 934,000 at a rehabilitation
facility as an inpatient, 816,000 at a hospital as an inpatient, 610,000
at a private doctor's office, 420,000 at a prison or jail, and 397,000 at
an emergency room. None of these estimates changed significantly between
2005 and 2006.
- More than half (2.5 million) of the 4.0 million persons who received treatment
for a substance use problem in the past year received treatment for alcohol
use during their most recent treatment. There were 1.2 million persons who
received treatment for marijuana use during their most recent treatment.
Estimates for other drugs were 928,000 persons for cocaine, 547,000 for
pain relievers, 535,000 for stimulants, 466,000 for heroin, and 442,000
for hallucinogens. (Note that respondents could indicate that they received
treatment for more than one substance during their most recent treatment.)
- In 2006, the number of persons aged 12 or older needing treatment for
an illicit drug or alcohol use problem was 23.6 million (9.6 percent
of the population aged 12 or older). Of these, 2.5 million (1.0 percent
of persons aged 12 or older and 10.8 percent of those who needed treatment)
received treatment at a specialty facility. Thus, there were 21.1 million
persons (8.6 percent of the population aged 12 or older) who needed
treatment for an illicit drug or alcohol use problem but did not receive
treatment at a specialty substance abuse facility in the past year.
- Of the 21.1 million people in 2006 who were classified as needing substance
use treatment but did not receive treatment at a specialty facility in the
past year, 940,000 persons (4.5 percent) reported that they felt they
needed treatment for their illicit drug or alcohol use problem. Of these
940,000 persons who felt they needed treatment, 314,000 (33.5 percent)
reported that they made an effort to get treatment, and 625,000 (66.5 percent)
reported making no effort to get treatment.
- The number of people who felt they needed treatment and made an effort
to get it among those who needed but did not receive treatment was not statistically
different in 2006 (314,000) from the number reported in 2005 (296,000).
Prevalence and Treatment of Mental Health Problems & Unmet Treatment Need
- Serious psychological distress (SPD) is an overall indicator of past year
nonspecific psychological distress that is constructed from the K6 scale administered
to adults aged 18 or older in NSDUH.
- In 2006, there were an estimated 24.9 million adults aged 18 or older in
the United States with SPD in the past year. This represents 11.3 percent
of all adults in this country, a rate equal to the rate in 2005.
- Rates of SPD in 2006 were highest for adults aged 18 to 25 (17.7 percent)
and lowest for adults aged 50 or older (6.9 percent).
- The prevalence of SPD among women aged 18 or older (13.7 percent) was
higher than that among men in that age group (8.7 percent).
- SPD in the past year was associated with past year substance dependence
or abuse in 2006. Among adults with SPD in 2006, 22.3 percent (5.6 million)
were dependent on or abused illicit drugs or alcohol. The rate among adults
without SPD was 7.7 percent (15.0 million).
- Among the 24.9 million adults with SPD in 2006, 10.9 million (44.0 percent)
received treatment for a mental health problem in the past year. Among adults
with SPD, 39.0 percent received a prescription medication, 27.2 percent
received outpatient treatment, and 3.9 percent received inpatient treatment
for a mental health problem in the past year.
- Among the 5.6 million adults with both SPD and substance dependence or abuse
(i.e., a substance use disorder) in 2006, about half (50.8 percent) received
mental health treatment or substance use treatment at a specialty facility;
8.4 percent received both treatment for mental health problems and specialty
substance use treatment, 39.6 percent received only treatment for mental
health problems, and 2.8 percent received only specialty substance use
treatment.
- In 2006, there were 30.4 million adults (13.9 percent of persons aged
18 or older) who had at least one major depressive episode (MDE) in their
lifetime, and 15.8 million adults (7.2 percent of persons aged 18 or
older) had at least one MDE in the past year.
- Having MDE in the past year was associated with past year substance dependence
or abuse. Among adults who had MDE in 2006, 24.3 percent were dependent
on or abused alcohol or illicit drugs, while among adults without MDE only
8.1 percent were dependent on or abused alcohol or illicit drugs. Persons
with MDE were more likely than those without MDE to be dependent on or abuse
illicit drugs (9.4 vs. 2.1 percent) and alcohol (19.3 vs. 7.0 percent).
- Among adults aged 18 or older who had MDE in the past year, 69.1 percent
received treatment (i.e., saw or talked to a medical doctor or other professional
or used prescription medication) for depression in the same time period.
- Among adults aged 18 or older with MDE in the past year in 2006, women were
more likely than men to receive treatment for depression in the past year
(73.7 vs. 60.8 percent).
- In 2006, there were 3.2 million youths aged 12 to 17 years (12.8 percent
of the population aged 12 to 17) who had at least one MDE in their lifetime
and 2.0 million youths (7.9 percent) who had MDE during the past year.
These rates are lower than the 2005 estimates of 13.7 percent lifetime
and 8.8 percent past year MDE.
- The rate of MDE in the past year was higher for adolescent females (11.8 percent)
than for adolescent males (4.2 percent).
- In 2006, one third (34.6 percent) of youths with MDE in the past year
had used illicit drugs in the past year, while the rate of illicit drug use
among youths who did not report MDE was 18.2 percent. Similarly, the
rates of past month daily cigarette use and heavy alcohol use were higher
for youths with MDE (5.2 and 4.5 percent, respectively) than for youths
who did not report MDE (2.5 and 2.2 percent, respectively).
- In 2006, 38.9 percent of youths aged 12 to 17 with past year MDE received
treatment for depression (saw or talked to a medical doctor or other professional
or used prescription medication). Among youths with depression, 23.9 percent
saw or talked to a medical doctor or other professional only, 2.1 percent
used prescription medication only, and 12.7 percent received treatment
from both sources for depression in the past year.
- In 2006, there were 5.4 million youths (21.3 percent) who received
treatment or counseling for emotional or behavioral problems in the year prior
to the interview. Adolescent females were more likely than adolescent males
to report past year treatment for mental health problems (23.0 vs. 19.6 percent,
respectively).
-
In 2006, there were 10.5 million adults aged 18
or older (4.8 percent) who reported an unmet need for treatment or
counseling for mental health problems in the past year. This included 4.8
million adults who did not receive mental health treatment and 5.6 million
adults who did receive some type of treatment or counseling for a mental
health problem in the past year. That is, about 20 percent of the 23.8
million adults that received treatment for a mental health problem in the
past 12 months reported an unmet need. (Unmet need among adults who received
treatment may reflect a delay in treatment or a perception of insufficient
treatment.)
- Among the 4.8 million adults who reported an unmet need for treatment or
counseling for mental health problems and did not receive treatment in the
past year, several barriers to treatment were reported. These included an
inability to afford treatment (41.5 percent), believing at the time that
the problem could be handled without treatment (34.0 percent), not having
the time to go for treatment (17.1 percent), and not knowing where to
go for services (16.0 percent) (Figure 8.7).
|
| |
| |
|
|
2006
National Survey on Drug Use & Health: National Results
|
1. Introduction
This report presents the first information from the 2006 National Survey on Drug Use and Health (NSDUH), an annual survey of the civilian, noninstitutionalized population of the United States aged 12 years old or older. Prior to 2002, the survey name was the National Household Survey on Drug Abuse (NHSDA). This initial report on the 2006 data presents national estimates of rates of use, numbers of users, and other measures related to illicit drugs, alcohol, and tobacco products. Measures related to mental health problems also are presented, including data on depression and on the co-occurrence of substance use and mental health problems. Estimates from NSDUH for States and areas within States will be presented in separate reports.
A major focus of this report is a comparison of substance use prevalence estimates between 2005 and 2006. Trends since 2002 also are discussed for some measures. Because of improvements to the survey in 2002, the 2002 data constitute a new baseline for tracking trends in substance use and other measures. Therefore, estimates from the 2002 through 2006 NSDUHs should not be compared with estimates from the 2001 and earlier surveys in the series to assess changes in substance use and mental health problems over time.
1.1. Summary of NSDUH
NSDUH is the primary source of statistical information on the use of illegal drugs by the U.S. population. Conducted by the Federal Government since 1971, the survey collects data by administering questionnaires to a representative sample of the population through face-to-face interviews at the respondent's place of residence. The survey is sponsored by the Substance Abuse and Mental Health Services Administration (SAMHSA), U.S. Department of Health and Human Services, and is planned and managed by SAMHSA's Office of Applied Studies (OAS). Data collection is conducted under contract with RTI International, Research Triangle Park, North Carolina.1 This section briefly describes the survey methodology; a more complete description is provided in Appendix A.
NSDUH collects information from residents of households and noninstitutional group quarters (e.g., shelters, rooming houses, dormitories) and from civilians living on military bases. The survey excludes homeless persons who do not use shelters, military personnel on active duty, and residents of institutional group quarters, such as jails and hospitals. Appendix D describes surveys that cover populations outside the NSDUH target population.
Since 1999, the NSDUH interview has been carried out using computer-assisted interviewing (CAI). Most of the questions are administered with audio computer-assisted self-interviewing (ACASI). ACASI is designed to provide the respondent with a highly private and confidential means of responding to questions to increase the level of honest reporting of illicit drug use and other sensitive behaviors. Less sensitive items are administered by interviewers using computer-assisted personal interviewing (CAPI).
The 2006 NSDUH employed a State-based design with an independent, multistage area probability sample within each State and the District of Columbia. The eight States with the largest population (which together account for 48 percent of the total U.S. population aged 12 or older) were designated as large sample States (California, Florida, Illinois, Michigan, New York, Ohio, Pennsylvania, and Texas). For these States, the design provided a sample sufficient to support direct State estimates. For the remaining 42 States and the District of Columbia, smaller, but adequate, samples support State estimates using small area estimation (SAE) techniques. The design oversampled youths and young adults, so that each State's sample was approximately equally distributed among three age groups: 12 to 17 years, 18 to 25 years, and 26 years or older.
Nationally, 137,057 addresses were screened for the 2006 survey, and 67,802 completed interviews were obtained. The survey was conducted from January through December 2006. Weighted response rates for household screening and for interviewing were 90.6 and 74.2 percent, respectively. See Appendix B for more information on NSDUH response rates.
1.2. Trend Measurement
Although the design of the 2002 through 2006 NSDUHs is similar to the design
of the 1999 through 2001 surveys, there are important methodological differences
that affect the comparability of the 2002-2006 estimates with estimates
from prior surveys. In addition to the name change, each NSDUH respondent
completing the interview is now given an incentive payment of $30. These changes,
implemented in 2002 and continued subsequently, resulted in an improvement
in the response rate, but also affected respondents' reporting of items that
are the basis of prevalence measures produced each year. Comparability also
may be affected by improved data collection quality control procedures that
were introduced beginning in 2001 and by the incorporation of new population
data from the 2000 decennial census into NSDUH sample weighting procedures.
Analyses of the effects of these factors on NSDUH estimates have shown
that 2002 and later data should not be compared with 2001 and earlier data
from the survey series to assess changes over time. Appendix C
of the 2004 NSDUH report on national findings discusses this issue in more
detail (see OAS, 2005b).
1.3. Change in Methamphetamine Use Estimates
This report includes new estimates of methamphetamine use based on data obtained from survey items added to NSDUH in 2005 and 2006. The new survey items were added to better account for how methamphetamine is supplied and obtained. Unlike other stimulants that are available by prescription, most methamphetamine in the United States is supplied through illicit manufacturing and trafficking rather than through the conventional prescription drug distribution process. Therefore, one concern is that methamphetamine use may have been underestimated in NSDUH due to its inclusion within a set of questions about prescription-type drugs. Specifically, survey respondents who used methamphetamine might not have reported its use when questions about it were asked in the context of other questions about prescription pharmaceuticals.
Section B.4.6 in Appendix B provides a discussion of the new items and the process used to generate the prevalence estimates based on them. The new estimates in this report, discussed in Chapter 2, are generally 15 to 25 percent higher than estimates of methamphetamine use published in prior reports. To assess trends in this report, a statistical adjustment was applied to 2002-2005 methamphetamine data, resulting in estimates comparable with the 2006 estimates. Because of these changes, the methamphetamine use estimates presented here are different from those shown in prior NSDUH reports and should not be compared or combined with them. In addition, because of the differences in measurement, the methamphetamine use estimates are not presented with the estimates for other drugs in the detailed tables posted to the SAMHSA website and in the tables of Appendix G in this report, but are included in a separate set of tables.
It is important to note that only the methamphetamine use estimates have been changed. Estimates for the more general drug use categories that include methamphetamine (i.e., stimulants used nonmedically, prescription psychotherapeutic drugs used nonmedically, use of illicit drugs other than marijuana, and illicit drug use) have not been modified and are comparable with those presented in previous NSDUH reports. However, estimates for these grouped categories of drugs should not be compared or combined with the new methamphetamine use estimates. Similarly, initiation estimates discussed in Chapter 5 do not incorporate the new methamphetamine items. It is expected that the 2007 NSDUH data will fully integrate the new survey items on methamphetamine with existing incidence and prevalence measures for other drugs.
1.4. Format of Report and Explanation of Tables
This report has separate chapters that discuss the national findings on seven topics: use of illicit drugs; use of alcohol; use of tobacco products; initiation of substance use; prevention-related issues; substance dependence, abuse, and treatment; and mental health problems and treatment. A final chapter summarizes the results and discusses key findings in relation to other research and survey results. Technical appendices describe the survey (Appendix A), provide technical details on the statistical methods and measurement (Appendix B), offer key NSDUH definitions (Appendix C), discuss other sources of related data (Appendix D), list the references cited in the report (as well as other relevant references) (Appendix E), and present selected tabulations of estimates (Appendices F and G).
Tables, text, and figures present prevalence measures for the population in terms of both the number of persons and the percentage of the population. Substance use tables show prevalence estimates by lifetime (i.e., ever used), past year, and past month use. Analyses focus primarily on past month use, which also is referred to as "current use." Tables and figures in which estimates are presented by year have footnotes indicating whether the 2006 estimates are significantly different from 2005 or earlier estimates.
Statistical tests have been conducted for all statements appearing in the text of the report that compare estimates between years or subgroups of the population. Unless explicitly stated that a difference is not statistically significant, all statements that describe differences are significant at the .05 level. Statistically significant differences are described using terms such as "higher," "lower," "increased," and "decreased." Statements that use terms such as "similar," "no difference," "same," or "remained steady" to describe the relationship between estimates denote that a difference is not statistically significant. In addition, a set of estimates for survey years or population subgroups may be presented without a statement of comparison, in which case a statistically significant difference between these estimates is not implied and testing was not conducted.
All estimates presented in the report have met the criteria for statistical reliability (see Section B.2.2 of Appendix B). Estimates that do not meet these criteria are suppressed and do not appear in tables, figures, or text. Also, subgroups with suppressed estimates are not included in statistical tests of comparisons. For example, a statement that "whites had the highest prevalence" means that the rate among whites was higher than the rate among all nonsuppressed racial/ethnic subgroups, but not necessarily higher than the rate among a subgroup for which the estimate was suppressed.
Data are presented for racial/ethnic groups based on current guidelines for collecting and reporting race and ethnicity data (Office of Management and Budget [OMB], 1997). Because respondents were allowed to choose more than one racial group, a "two or more races" category is presented that includes persons who reported more than one category among the basic groups listed in the survey question (white, black or African American, American Indian or Alaska Native, Native Hawaiian, Other Pacific Islander, Asian, Other). Respondents choosing both Native Hawaiian and Other Pacific Islander but no other categories mentioned above are classified in the combined "Native Hawaiian or Other Pacific Islander" category instead of the "two or more race" category. It should be noted that, except for the "Hispanic or Latino" group, the racial/ethnic groups discussed in this report include only non-Hispanics. The category "Hispanic or Latino" includes Hispanics of any race.
Data also are presented for four U.S. geographic regions and nine geographic divisions within these regions. These regions and divisions, defined by the U.S. Census Bureau, consist of the following groups of States:
Northeast Region - New England Division: Connecticut, Maine, Massachusetts, New Hampshire, Rhode Island, Vermont; Middle Atlantic Division: New Jersey, New York, Pennsylvania.
Midwest Region - East North Central Division: Illinois, Indiana, Michigan, Ohio, Wisconsin; West North Central Division: Iowa, Kansas, Minnesota, Missouri, Nebraska, North Dakota, South Dakota.
South Region - South Atlantic Division: Delaware, District of Columbia, Florida, Georgia, Maryland, North Carolina, South Carolina, Virginia, West Virginia; East South Central Division: Alabama, Kentucky, Mississippi, Tennessee; West South Central Division: Arkansas, Louisiana, Oklahoma, Texas.
West Region - Mountain Division: Arizona, Colorado, Idaho, Montana, Nevada, New Mexico, Utah, Wyoming; Pacific Division: Alaska, California, Hawaii, Oregon, Washington.
Geographic comparisons also are made based on county type, a variable that reflects different levels of urbanicity and metropolitan area inclusion of counties, based on metropolitan area definitions issued by the OMB in June 2003 (OMB, 2003). For this purpose, counties are grouped based on the 2003 rural-urban continuum codes. These codes were originally developed by the U.S. Department of Agriculture (Butler & Beale, 1994). Each county is either inside or outside a metropolitan statistical area (MSA), as defined by the OMB.
Large metropolitan areas have a population of 1 million or more. Small metropolitan areas have a population of fewer than 1 million. Small metropolitan areas are further classified based on whether they have a population of 250,000 or more. Nonmetropolitan areas are areas outside MSAs. Counties in nonmetropolitan areas are further classified based on the number of people in the county who live in an urbanized area, as defined by the Census Bureau at the subcounty level. "Urbanized" counties have a population of 20,000 or more in urbanized areas, "less urbanized" counties have at least 2,500 but fewer than 20,000 population in urbanized areas, and "completely rural" counties have fewer than 2,500 population in urbanized areas.
1.5. Other NSDUH Reports and Data
Other reports focusing on specific topics of interest will be produced using the 2006 NSDUH data and made available on SAMHSA's website. A report on State-level estimates for 2005-2006 will be available in early 2008.
A comprehensive set of tables, referred to as "detailed tables," is available through the Internet at http://www.oas.samhsa.gov. The tables are organized into sections based primarily on the topic, and most tables are provided in several parts, showing population estimates (e.g., numbers of drug users), rates (e.g., percentages of population using drugs), and standard errors of all nonsuppressed estimates. A small subset of these detailed tables has been selected for inclusion in Appendices F and G of this report. The appendix tables can be mapped back to the detailed tables by using the table number in parentheses in the upper left corner of each table (e.g., Table G.1 in Appendix G is Table 8.1A in the detailed tables). Additional methodological information on NSDUH, including the questionnaire, is available electronically at the same Web address.
Brief descriptive reports and in-depth analytic reports focusing on specific issues or population groups also are produced by OAS. A complete listing of previously published reports from NSDUH and other data sources is available from OAS. Most of these reports also are available through the Internet (http://www.oas.samhsa.gov). In addition, OAS makes public use data files available to researchers through the Substance Abuse and Mental Health Data Archive (SAMHDA, 2007) at http://www.icpsr.umich.edu/SAMHDA/index.html. Currently, files are available from the 1979 to 2005 surveys. The 2006 NSDUH public use file will be available by the end of 2007.
|
| |
| |
|
|
2006
National Survey on Drug Use & Health: National Results
|
2. Illicit Drug Use
The National Survey on Drug Use and Health (NSDUH) obtains information on nine different categories of illicit drug use: use of marijuana, cocaine, heroin, hallucinogens, and inhalants; and the nonmedical use of prescription-type pain relievers, tranquilizers, stimulants, and sedatives. In these categories, hashish is included with marijuana, and crack is considered a form of cocaine. Several drugs are grouped under the hallucinogens category, including LSD, PCP, peyote, mescaline, mushrooms, and "Ecstasy" (MDMA). Inhalants include a variety of substances, such as nitrous oxide, amyl nitrite, cleaning fluids, gasoline, spray paint, other aerosol sprays, and glue. The four categories of prescription-type drugs (pain relievers, tranquilizers, stimulants, and sedatives) cover numerous pharmaceutical drugs available by prescription and drugs within these groupings that may be manufactured illegally, such as methamphetamine, which is included under stimulants. Respondents are asked to report only "nonmedical" use of these drugs, defined as use without a prescription of the individual's own or simply for the experience or feeling the drugs caused. Use of over-the-counter drugs and legitimate use of prescription drugs are not included. NSDUH reports combine the four prescription-type drug groups into a category referred to as "psychotherapeutics."
Estimates of "illicit drug use" reported from NSDUH reflect the use of any of the nine drug categories listed above. Use of alcohol and tobacco products, while illegal for youths, is not included in these estimates, but is discussed in Chapters 3 and 4.
This chapter includes new estimates of methamphetamine use based on data obtained from survey items added to NSDUH in 2005 and 2006. The new survey items were added to better account for how methamphetamine is supplied and obtained. Unlike other stimulants that are available by prescription, most methamphetamine is supplied through illicit manufacturing and trafficking rather than through the conventional prescription drug distribution process. Therefore, one concern is that methamphetamine use may have been underestimated in NSDUH due to its inclusion within a set of questions about prescription-type drugs. Specifically, respondents who used methamphetamine might not have reported its use when questions about it were asked in the context of other questions about prescription pharmaceuticals. Section B.4.6 in Appendix B provides a discussion of the new items and the process used to generate the adjusted estimates based on them.
The new methamphetamine use estimates in this report are generally 15 to 25 percent higher than estimates of methamphetamine use published in prior reports. Estimates for stimulant use and use of psychotherapeutic drugs do not incorporate data from the new items. To assess trends, a statistical adjustment was applied to the 2002-2005 methamphetamine use data, resulting in estimates comparable with the 2006 estimates. Because of these changes, the methamphetamine use estimates presented here are different from those in prior NSDUH reports and should not be compared or combined with them. In addition, because of the differences in measurement, the methamphetamine use estimates are not presented with the estimates for other drugs in the 2006 detailed tables posted on the Substance Abuse and Mental Health Services Administration (SAMHSA) website or in Appendix G's tables in this report, but they are included in Table s B.6 and B.7 in Section B.4.6 of Appendix B, which also presents further methodological information.
It is important to note that only the methamphetamine use estimates have been changed. Estimates for the more general drug use categories that include methamphetamine use (i.e., stimulants used nonmedically, prescription psychotherapeutic drugs used nonmedically, use of illicit drugs other than marijuana, and illicit drug use) have not been modified and are comparable with those presented in previous NSDUH reports. However, estimates for use of these grouped categories of drugs should not be compared or combined with the new methamphetamine use estimates. It is expected that the 2007 NSDUH data will fully integrate the new survey items on methamphetamine use with existing incidence and prevalence measures for other drugs.
- In 2006, an estimated 20.4 million Americans aged 12 or older were current (past month) illicit drug users, meaning they had used an illicit drug during the month prior to the survey interview. This estimate represents 8.3 percent of the population aged 12 years old or older.
- The overall rate of current illicit drug use among persons aged 12 or older in 2006 (8.3 percent) was similar to the rate in 2005 (8.1 percent) and has remained stable since 2002 (8.3 percent).
- Marijuana was the most commonly used illicit drug (14.8 million past month users) (Figure 2.1). In 2006, marijuana was used by 72.8 percent of current illicit drug users and was the only drug used by 52.8 percent of them. Illicit drugs other than marijuana were used by 9.6 million persons or 47.2 percent of illicit drug users aged 12 or older. Current use of other drugs but not marijuana was reported by 27.2 percent of illicit drug users, and 20.0 percent used both marijuana and other drugs.
- Among persons aged 12 or older, the overall rate of past month marijuana use in 2006 (6.0 percent) was the same as in 2005 and was similar to the rates in earlier years going back to 2002 (Figure 2.2).
Below is a bar graph. Click here for the text describing this graph.
Figure 2.1 Past Month Use of Specific Illicit Drugs among Persons Aged 12 or Older: 2006
1Estimates for methamphetamine use incorporate data from new questions added in 2005 and 2006 that are not included in estimates for use of illicit drugs other than marijuana, use of psychotherapeutics, or stimulant use. See the introductory paragraphs of this chapter for further information.
Below is a bar graph. Click here for the text describing this graph.
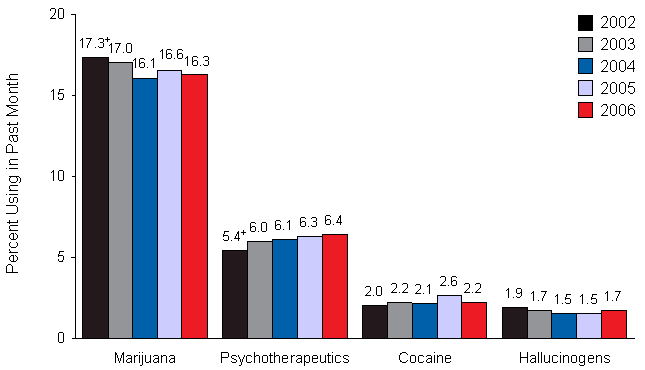
Figure 2.2 Past Month Use of Selected Illicit Drugs among Persons Aged 12 or Older: 2002-2006
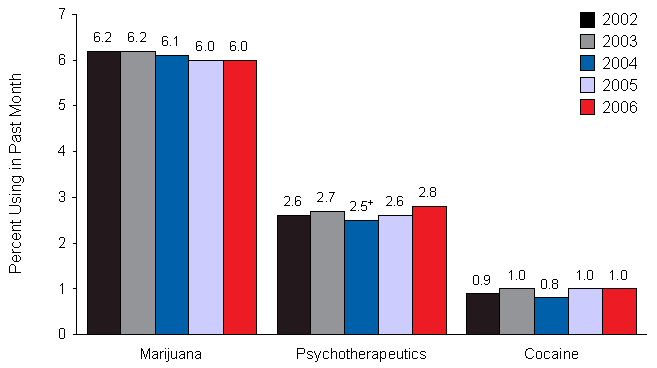
+Difference between this estimate and the 2006 estimate is statistically significant at the .05 level.
- An estimated 5.2 million persons were current nonmedical users of prescription pain relievers in 2006, which is more than the estimated 4.7 million in 2005. However, the change in the rate of current nonmedical use of pain relievers between 2005 and 2006 (1.9 and 2.1 percent, respectively) was not statistically significant.
- In 2006, there were 2.4 million current cocaine users, the same as in 2005 (2.4 million) but more than in 2002 (2.0 million). However, the rate of current cocaine use remained stable between 2002 and 2006 (Figure 2.2). The number of past month crack users was similar in 2005 and 2006 with 682,000 and 702,000, respectively.
- The number of current heroin users increased from 136,000 in 2005 to 338,000 in 2006, and the corresponding prevalence rate increased from 0.06 to 0.14 percent.
- Hallucinogens were used in the past month by 1.0 million persons (0.4 percent) in 2006, including 528,000 (0.2 percent) who had used Ecstasy. These estimates are similar to the corresponding estimates for 2005. However, lifetime use of Ecstasy increased from 10.2 million persons in 2002 to 12.3 million in 2006 (4.3 to 5.0 percent of persons aged 12 or older), but past year use of Ecstasy decreased from 3.2 million (1.3 percent) to 2.1 million (0.9 percent) over the same period.
- There were 9.6 million people aged 12 or older (3.9 percent) who were current users of illicit drugs other than marijuana in 2006. Most (7.0 million persons, or 2.8 percent of the population) used psychotherapeutic drugs nonmedically. In addition to the estimated 5.2 million nonmedical users of pain relievers in 2006, 1.8 million used tranquilizers, 1.2 million used stimulants, and 385,000 used sedatives. The numbers of nonmedical users of tranquilizers, stimulants, and sedatives were similar to the corresponding numbers in 2005, and the percentage rates also remained stable.
- In 2006, there were an estimated 731,000 current users of methamphetamine aged 12 or older. This constitutes 0.3 percent of the population. These estimates do not differ significantly from those for 2002, 2003, 2004, and 2005. However, the rate of lifetime methamphetamine use in 2006 (5.8 percent) was higher than that in 2005 (5.2 percent) but lower than that in 2002 (6.5 percent).
Age
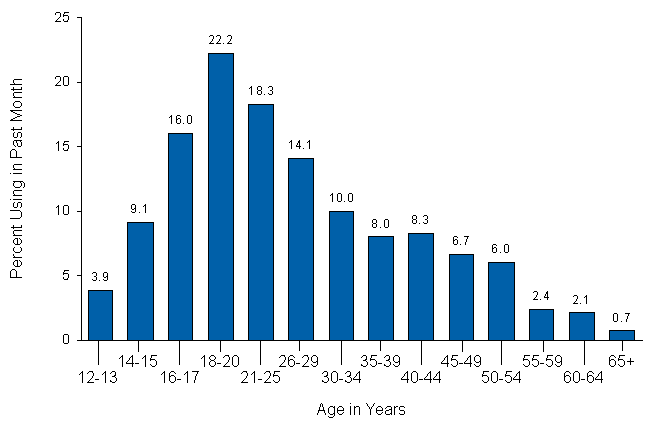
- Rates of past month illicit drug use varied with age. Through the adolescent years from 12 to 17, the rates of current illicit drug use increased from 3.9 percent at ages 12 or 13 to 9.1 percent at ages 14 or 15 to 16.0 percent at ages 16 or 17 (Figure 2.3). The highest rate was among persons aged 18 to 20 (22.2 percent). The rate was 18.3 percent among those aged 21 to 25 and declined with increasing age among adults aged 26 or older.
Below is a bar graph. Click here for the text describing this graph.
Figure 2.3 Past Month Illicit Drug Use among Persons Aged 12 or Older, by Age: 2006
- Although adults aged 26 or older were less likely to be current drug users than youths aged 12 to 17 or young adults aged 18 to 25 (6.1 vs. 9.8 and 19.8 percent, respectively), there were more drug users aged 26 or older (11.4 million) than in the 12-to-17-year age group (2.5 million) and 18-to-25-year age group (6.5 million) combined.
- Current illicit drug use remained stable from 2005 to 2006 among youths aged 12 to 17, young adults aged 18 to 25, and adults aged 26 or older (Figure 2.4). From 2002 to 2006, however, the rate of illicit drug use among 12 to 17 year olds decreased from 11.6 to 9.8 percent.
Below is a bar graph. Click here for the text describing this graph.
Figure 2.4 Past Month Illicit Drug Use among Persons Aged 12 or Older, by Age: 2002-2006
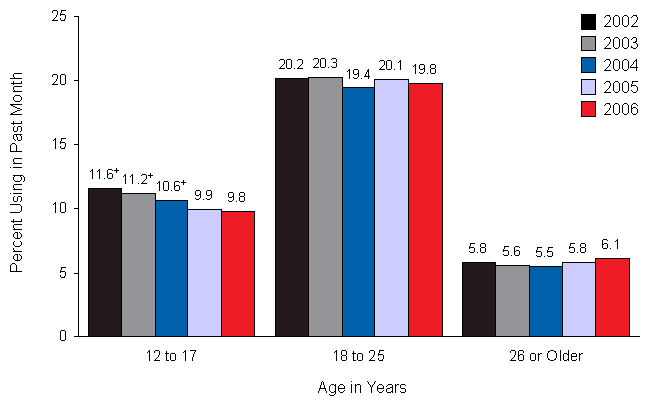
+Difference between this estimate and the 2006 estimate is statistically significant at the .05 level.
Youths Aged 12 to 17
- In 2006, 9.8 percent of youths aged 12 to 17 were current illicit drug users: 6.7 percent used marijuana, 3.3 percent engaged in nonmedical use of prescription-type drugs, 1.3 percent used inhalants, 0.7 percent used hallucinogens, and 0.4 percent used cocaine (Figure 2.5).
Below is a bar graph. Click here for the text describing this graph.
Figure 2.5 Past Month Use of Selected Illicit Drugs among Youths Aged 12 to 17: 2002-2006

+Difference between this estimate and the 2006 estimate is statistically significant at the .05 level.
- Among youths aged 12 to 17, the types of drugs used in the past month varied by age group. Among 12 or 13 year olds, 2.0 percent used prescription-type drugs nonmedically, 1.2 percent used inhalants, and 0.9 percent used marijuana. Among 14 or 15 year olds, marijuana was the dominant drug used (5.8 percent), followed by prescription-type drugs used nonmedically (3.1 percent), and then by inhalants (1.7 percent). Marijuana also was the most commonly used drug among 16 or 17 year olds (13.0 percent), followed by prescription-type drugs used nonmedically (4.7 percent), and then by hallucinogens (1.3 percent), inhalants (1.1 percent), and cocaine (0.8 percent).
- Current illicit drug use rates remained stable from 2005 to 2006 among youths aged 12 to 17. However, rates of current use declined significantly from 2002 to 2006 for any illicit drug and several specific drugs (including marijuana, hallucinogens, LSD, Ecstasy, prescription-type drugs used nonmedically, pain relievers, tranquilizers, and the use of illicit drugs other than marijuana) (Figures 2.4 and 2.5). For any illicit drug use, the rates were 11.6 percent in 2002, 11.2 percent in 2003, 10.6 percent in 2004, 9.9 percent in 2005, and 9.8 percent in 2006.
- The rate of current marijuana use among youths aged 12 to 17 declined from 8.2 percent in 2002 to 6.7 percent in 2006. Significant declines were also evident between 2002 and 2006 for past year use (from 15.8 to 13.2 percent) and lifetime use (from 20.6 to 17.3 percent).
- Prevalence rates among 12 to 17 year olds also were lower in 2006 than in 2002 for current use of illicit drugs other than marijuana; nonmedical use of psychotherapeutics, pain relievers, and tranquilizers; and use of hallucinogens, LSD, and Ecstasy. The rate for illicit drugs other than marijuana declined from 5.7 percent in 2002 to 4.9 percent in 2006; nonmedical use of psychotherapeutic drugs decreased from 4.0 to 3.3 percent; nonmedical use of pain relievers declined from 3.2 to 2.7 percent; and nonmedical use of tranquilizers decreased from 0.8 to 0.5 percent. Adolescents' current use of hallucinogens declined from 1.0 percent in 2002 to 0.7 percent in 2006, reflecting decreases in current use of Ecstasy (from 0.5 to 0.3 percent) and LSD (from 0.2 to 0.1 percent).
Young Adults Aged 18 to 25
- Rates of current use of illicit drugs were higher for young adults aged 18 to 25 (19.8 percent) than for youths aged 12 to 17 and adults aged 26 or older, with 16.3 percent using marijuana, 6.4 percent using prescription-type drugs nonmedically, 2.2 percent using cocaine, and 1.7 percent using hallucinogens (Figure 2.6).
Below is a bar graph. Click here for the text describing this graph.
Figure 2.6 Past Month Use of Selected Illicit Drugs among Young Adults Aged 18 to 25: 2002-2006
+Difference between this estimate and the 2006 estimate is statistically significant at the .05 level.
- There were no significant changes in past month use of any drugs among young adults aged 18 to 25 between 2005 and 2006. The rate of past year use increased for Ecstasy (from 3.1 to 3.8 percent) and decreased for inhalants (2.1 to 1.8 percent).
- From 2002 to 2006, the rate of current use of marijuana among young adults aged 18 to 25 declined from 17.3 to 16.3 percent. Past month nonmedical use of prescription-type drugs among young adults increased from 5.4 percent in 2002 to 6.4 percent in 2006. This was primarily due to an increase in the rate of pain reliever use, which was 4.1 percent in 2002 and 4.9 percent in 2006. However, nonmedical use of tranquilizers also increased over the 5-year period (from 1.6 to 2.0 percent).
- Among young adults aged 18 to 25, lifetime use of hallucinogens decreased from 24.2 percent in 2002 to 20.2 percent in 2006. Similarly, past year use of hallucinogens decreased between 2002 and 2006 (8.4 and 6.6 percent, respectively). Lifetime and past year nonmedical use of psychotherapeutic drugs increased between 2002 and 2006 (27.7 vs. 30.3 percent for lifetime use and 14.2 vs. 15.5 percent for past year use), with increases in the rates of pain reliever and tranquilizer use.
Adults Aged 26 or Older
- Among adults aged 26 or older, 6.1 percent reported current illicit drug use in 2006 (Figure 2.4). In this age group, 4.2 percent used marijuana, and 2.2 percent used prescription-type drugs nonmedically. Less than 1 percent used cocaine (0.8 percent), hallucinogens (0.1 percent), and inhalants (0.2 percent). The only significant change between 2005 and 2006 in the rates of past month use among adults in this age group involved heroin, which increased from 0.03 to 0.14 percent. Lifetime nonmedical use of OxyContin® among adults aged 26 or older increased from 0.9 percent in 2005 to 1.1 percent in 2006, and past year use of stimulants and heroin also increased (stimulants, from 0.6 to 0.9 percent; heroin, from 0.1 to 0.2 percent).
- Among adults aged 50 to 59, the rate of current illicit drug use increased between 2002 and 2005, then remained unchanged in 2006 (Figure 2.7). For those aged 50 to 54, the rate increased from 3.4 in 2002 to 6.0 percent in 2006. Among those aged 55 to 59, current illicit drug use showed a mixed trend with no significant difference between the rates in 2002 and 2006. These patterns and trends may partially reflect the aging into these age groups of the baby boom cohort, whose lifetime rates of illicit drug use are higher than those of older cohorts.
Below is a bar graph. Click here for the text describing this graph.
Figure 2.7 Past Month Illicit Drug Use among Adults Aged 50 to 59: 2002-2006
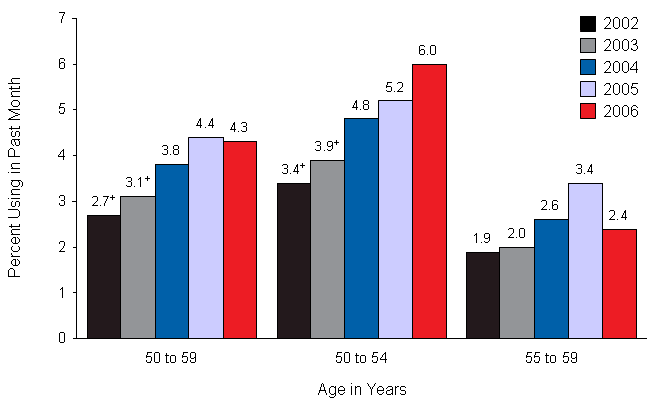
+Difference between this estimate and the 2006 estimate is statistically significant at the .05 level.
Gender
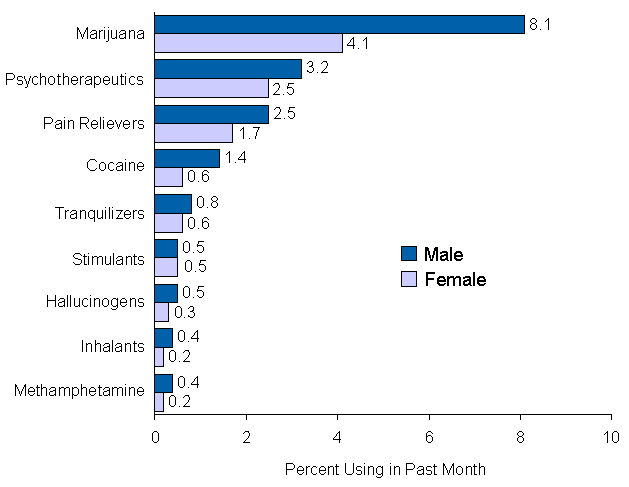
- As in prior years, males were more likely than females among persons aged 12 or older to be current illicit drug users in 2006 (10.5 vs. 6.2 percent, respectively). The rate of past month marijuana use for males was about twice as high as the rate for females (8.1 vs. 4.1 percent) (Figure 2.8). However, males and females had similar rates of past month use of stimulants (0.5 percent for both males and females), Ecstasy (0.2 percent for both), sedatives (0.1 and 0.2 percent, respectively), OxyContin® (0.1 percent for both), LSD (0.1 and less than 0.1 percent), and PCP (less than 0.1 percent for both).
Below is a bar graph. Click here for the text describing this graph.
Figure 2.8 Past Month Use of Selected Drugs among Persons Aged 12 or Older, by Gender: 2006
- From 2005 to 2006, the rate of past month nonmedical use of prescription-type psychotherapeutic drugs increased from 2.8 to 3.2 percent among males aged 12 or older, mirroring an increase in the nonmedical use of pain relievers (from 2.1 to 2.5 percent). The rate of current heroin use also increased among males (from 0.1 to 0.2 percent). There were no significant changes from 2005 to 2006 in the rate of past month drug use among females aged 12 or older.
- Among youths aged 12 to 17, the rate of current illicit drug use was similar for boys (9.8 percent) and girls (9.7 percent). In 2006, male and female adolescents had similar rates of current marijuana use (6.8 and 6.4 percent) (Figure 2.9) and nonmedical use of prescription-type psychotherapeutics (3.1 and 3.5 percent, respectively).
- Past month marijuana use among male youths aged 12 to 17 declined gradually from 9.1 percent in 2002 to 6.8 percent in 2006. Among female youths, the trend was less clear with the rates in 2006 (6.4 percent) and 2002 (7.2 percent) not being significantly different.
Below is a bar graph. Click here for the text describing this graph.
Figure 2.9 Past Month Marijuana Use among Youths Aged 12 to 17, by Gender: 2002-2006
+Difference between this estimate and the 2006 estimate is statistically significant at the .05 level.
Pregnant Women
- Among pregnant women aged 15 to 44 years, 4.0 percent reported using illicit drugs in the past month based on combined 2005 and 2006 NSDUH data. This rate was significantly lower than the rate among women aged 15 to 44 who were not pregnant (10.0 percent). The 2003-2004 combined rate of current illicit drug use among pregnant women (4.6 percent) was not significantly different from the 2005-2006 combined rate.
Race/Ethnicity
- Current illicit drug use varied by race/ethnicity in 2006. Among persons aged 12 or older, the rate was lowest among Asians (3.6 percent). Rates were 13.7 percent for American Indians or Alaska Natives, 9.8 percent for blacks, 8.9 percent for persons reporting two or more races, 8.5 percent for whites, 7.5 percent for Native Hawaiians or Other Pacific Islanders, and 6.9 percent for Hispanics.
- Among youths aged 12 to 17 in 2006, the rate of current illicit drug use among American Indians or Alaska Natives was about twice the overall rate among youths (18.7 vs. 9.8 percent, respectively). The rates were 11.8 percent among youths reporting two or more races, 10.2 percent among blacks, 10.0 percent among whites, 8.9 percent among Hispanics, and 6.7 percent among Asians.
- There were no statistically significant changes between 2005 and 2006 in the rate of current illicit drug use for any racial/ethnic subgroup among persons aged 12 or older or among youths aged 12 to 17. Among young adults aged 18 to 25 who reported two or more races, the rate of current illicit drug use decreased from 31.8 percent in 2005 to 22.4 percent in 2006. In that 18-to-25-year age group, 28.5 percent of American Indians or Alaska Natives, 22.7 percent of whites, 17.3 percent of blacks, 13.9 percent of Hispanics, and 9.0 percent of Asians were current illicit drug users in 2006.
Education
- Illicit drug use in 2006 varied by educational status. Among adults aged 18 or older, the rate of current illicit drug use was lower for college graduates (5.9 percent) than for those who did not graduate from high school (9.2 percent), high school graduates (8.6 percent), and those with some college (9.1 percent). However, adults who had graduated from college were more likely to have tried illicit drugs in their lifetime when compared with adults who had not completed high school (50.1 vs. 37.2 percent). Among college graduates, the rate of current illicit drug use increased from 5.0 percent in 2005 to 5.9 percent in 2006.
College Students
- In the college-aged population (persons aged 18 to 22 years old), the rate of current use of illicit drugs was lower among full-time college students (19.2 percent) than among other persons aged 18 to 22 years, which includes part-time college students, students in other grades, and nonstudents (22.6 percent). Current illicit drug use among college students and other 18 to 22 year olds did not change between 2005 and 2006.
- There was a significant decrease in current use of crack among persons aged 18 to 22 who were not full-time college students, from 0.6 percent in 2005 to 0.2 percent in 2006. The rate was unchanged among full-time college students (0.1 percent in both 2005 and 2006).
Employment
- Current illicit drug use differed by employment status in 2006. Among adults aged 18 or older, the rate of drug use was higher for unemployed persons (18.5 percent) than for those who were employed full time (8.8 percent) or part time (9.4 percent). These rates were all similar to the corresponding rates in 2005.
- Although the rate of past month illicit drug use was higher among unemployed persons compared with those from other employment groups, most drug users were employed. Of the 17.9 million current illicit drug users aged 18 or older in 2006, 13.4 million (74.9 percent) were employed either full or part time.
Geographic Area
- Among persons aged 12 or older, the rate of current illicit drug use in 2006 was 9.5 percent in the West, 8.9 percent in the Northeast, 7.9 percent in the Midwest, and 7.4 percent in the South.
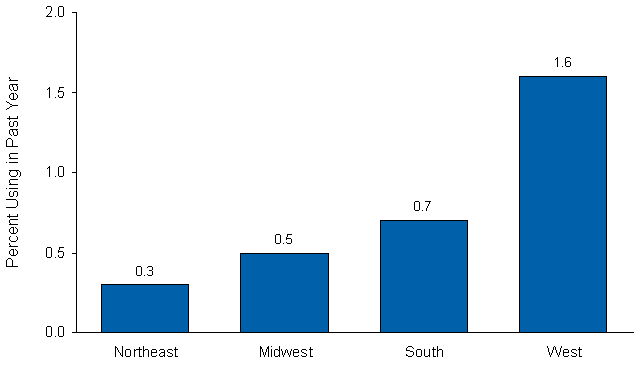
- Past year methamphetamine use was higher in the West (1.6 percent) than in the Northeast (0.3 percent), Midwest (0.5 percent) or South (0.7 percent) in 2006 (Figure 2.10). The rates of past year use in 2006 were similar to those in 2002 in each region.
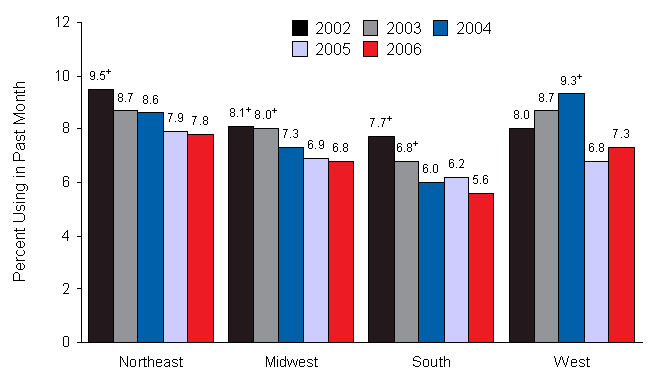
- Among youths aged 12 to 17, there was evidence of regional differences in the trends of marijuana use between 2002 and 2006 (Figure 2.11). Current marijuana use rates declined in the Northeast, Midwest, and South between 2002 and 2006. In the West, the rates were steady between 2002 and 2004 (8.0 percent in 2002, 8.7 percent in 2003, and 9.3 percent in 2004) and then declined to 6.8 percent in 2005 and remained steady at 7.3 percent in 2006.
Below is a bar graph. Click here for the text describing this graph.
Figure 2.10 Past Year Methamphetamine Use among Persons Aged 12 or Older, by Geographic Region: 2006
Below is a bar graph. Click here for the text describing this graph.
Figure 2.11 Past Month Marijuana Use among Youths Aged 12 to 17, by Geographic Region: 2002-2006
+Difference between this estimate and the 2006 estimate is statistically significant at the .05 level.
- The rate of current illicit drug use in metropolitan areas was higher than the rate in nonmetropolitan areas in 2006. The rates were 8.7 percent in large metropolitan counties, 8.3 percent in small metropolitan counties, and 6.8 percent in nonmetropolitan counties as a group. Within nonmetropolitan areas, counties that were urbanized had a rate of 7.1 percent, less urbanized counties had a rate of 6.5 percent, while completely rural counties had a rate of 7.8 percent. The rates in 2005 were similar to those in 2006.
- The rate of current illicit drug use among the population aged 12 or older in completely rural counties in 2006 (7.8 percent) was similar to that observed in 2002 (6.7 percent) and 2005 (5.1 percent) but higher than the rate in 2003 (3.1 percent) and 2004 (4.6 percent).
Criminal Justice Populations
- In 2006, there were an estimated 1.6 million adults aged 18 or older on parole or other supervised release from prison during the past year. Over one fourth of these (29.7 percent) were current illicit drug users, higher than the 7.9 percent among adults not on parole or supervised release.
- Among the 4.6 million adults on probation at some time in the past year, 31.9 percent reported current illicit drug use in 2006. This was higher than the rate of 7.6 percent among adults not on probation in 2006.
Frequency of Use
- In 2006, among past year marijuana users aged 12 or older, 12.3 percent used marijuana on 300 or more days within the past 12 months. This translates into 3.1 million using marijuana on a daily or almost daily basis over a 12-month period, similar to the estimate in 2005. Among past month marijuana users aged 12 or older, 34.4 percent (5.1 million) used the drug on 20 or more days in the past month.
Association with Cigarette and Alcohol Use
- In 2006, the rate of current illicit drug use was almost 9 times higher among youths aged 12 to 17 who smoked cigarettes in the past month (47.8 percent) than it was among youths who did not smoke cigarettes in the past month (5.4 percent).
- Past month illicit drug use also was associated with the level of past month alcohol use. Among youths aged 12 to 17 in 2006 who were heavy drinkers (i.e., drank five or more drinks on the same occasion [i.e., at the same time or within a couple of hours of each other] on each of 5 or more days in the past 30 days), 57.6 percent also were current illicit drug users, which was higher than among nondrinkers (4.8 percent).
Driving Under the Influence of Illicit Drugs
- In 2006, there were 10.2 million persons aged 12 or older who reported driving under the influence of illicit drugs during the past year. This corresponds to 4.2 percent of the population aged 12 or older, similar to the rate in 2005 (4.3 percent), but lower than the rate in 2002 (4.7 percent). In 2006, the rate was highest among young adults aged 18 to 25 (13.0 percent).
Source of Prescription Drugs
- Nonmedical users of prescription-type psychotherapeutic drugs are asked questions regarding how they obtained the drugs they recently used nonmedically. In both 2005 and 2006, over half of the nonmedical users of prescription-type pain relievers, tranquilizers, stimulants, and sedatives said they obtained the drugs they used most recently "from a friend or relative for free." A follow-up question added in 2006 asked these respondents where their friend or relative had obtained the drugs.
- Among persons aged 12 or older who used pain relievers nonmedically in the past 12 months, 55.7 percent reported in 2006 that they got the pain relievers they most recently used from a friend or relative for free. Another 9.3 percent bought the drugs from a friend or family member. Around one fifth (19.1 percent) reported they got the drugs from just one doctor. Only 3.9 percent got the pain relievers from a drug dealer or other stranger, and only 0.1 percent reported buying the drug on the Internet.
- In 80.7 percent of the cases where nonmedical users of prescription pain relievers obtained the drugs from a friend or relative for free, the individuals indicated that their friend or relative had obtained the drugs from just one doctor. Only 1.6 percent reported that the friend or relative had bought the drug from a drug dealer or other stranger.
- In 2006, over half (53.6 percent) of past year methamphetamine users reported that they obtained the methamphetamine they used most recently from a friend or relative for free. Another 21.4 percent bought it from a friend or relative. Around one in five users (21.1 percent) bought it from a drug dealer or other stranger.
|
| |
| |
|
|
2006
National Survey on Drug Use & Health: National Results
|
3. Alcohol Use
The National Survey on Drug Use and Health (NSDUH) includes questions about the recency and frequency of consumption of alcoholic beverages, such as beer, wine, whiskey, brandy, and mixed drinks. An extensive list of examples of the kinds of beverages covered is given to respondents prior to the question administration. A "drink" is defined as a can or bottle of beer, a glass of wine or a wine cooler, a shot of liquor, or a mixed drink with liquor in it. Times when the respondent only had a sip or two from a drink are not considered to be consumption. For this report, estimates for the prevalence of alcohol use are reported primarily at three levels defined for both males and females and for all ages as follows:
Current (past month) use - At least one drink in the past 30 days (includes binge and heavy use).
Binge use - Five or more drinks on the same occasion (i.e., at the same time or within a couple of hours of each other) on at least 1 day in the past 30 days (includes heavy use).
Heavy use - Five or more drinks on the same occasion on each of 5 or more days in the past 30 days.
- Slightly more than half of Americans aged 12 or older reported being current drinkers of alcohol in the 2006 survey (50.9 percent). This translates to an estimated 125 million people, which is similar to the 2005 estimate of 126 million people (51.8 percent).
- More than one fifth (23.0 percent) of persons aged 12 or older participated in binge drinking at least once in the 30 days prior to the survey in 2006. This translates to about 57 million people. The rate in 2006 is similar to the rate in 2005 (22.7 percent).
- In 2006, heavy drinking was reported by 6.9 percent of the population aged 12 or older, or 17 million people. This percentage is similar to the rate of heavy drinking in 2005 (6.6 percent).
Age
- In 2006, rates of current alcohol use were 3.9 percent among persons aged 12 or 13, 15.6 percent of persons aged 14 or 15, 29.7 percent of 16 or 17 year olds, 51.6 percent of those aged 18 to 20, and 68.6 percent of 21 to 25 year olds (Figure 3.1). Among older age groups, the prevalence of alcohol use decreased with increasing age, from 63.5 percent among 26 to 29 year olds to 48.0 percent among 60 to 64 year olds and 38.4 percent among people aged 65 or older.
Below is a bar graph. Click here for the text describing this graph.
Figure 3.1 Current, Binge, and Heavy Alcohol Use among Persons Aged 12 or Older, by Age: 2006
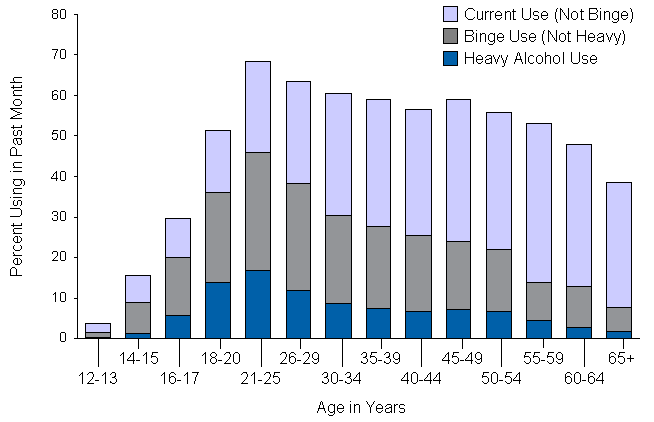
- Rates of binge alcohol use in 2006 were 1.5 percent among 12 or 13 year olds, 8.9 percent among 14 or 15 year olds, 20.0 percent among 16 or 17 year olds, 36.2 percent among persons aged 18 to 20, and 46.1 percent among those aged 21 to 25. The rate peaked at ages 21 to 23 (49.3 percent at age 21, 48.9 percent at age 22, and 47.2 percent at age 23), then decreased beyond young adulthood from 34.2 percent of 26 to 34 year olds to 18.4 percent of persons aged 35 or older.
- The rate of binge drinking was 42.2 percent for young adults aged 18 to 25. Heavy alcohol use was reported by 15.6 percent of persons aged 18 to 25. These rates are similar to the rates in 2005 (41.9 and 15.3 percent, respectively).
- Persons aged 65 or older had lower rates of binge drinking (7.6 percent) than adults in other age groups. The rate of heavy drinking among persons aged 65 or older was 1.6 percent.
- The rate of current alcohol use among youths aged 12 to 17 was 16.6 percent in 2006. Youth binge and heavy drinking rates were 10.3 and 2.4 percent, respectively. These rates are essentially the same as the 2005 rates (16.5 percent, 9.9 percent, and 2.4 percent, respectively).
Underage Alcohol Use
- In 2006, about 10.8 million persons aged 12 to 20 (28.3 percent of this age group) reported drinking alcohol in the past month. Approximately 7.2 million (19.0 percent) were binge drinkers, and 2.4 million (6.2 percent) were heavy drinkers. These figures have remained essentially the same since the 2002 survey.
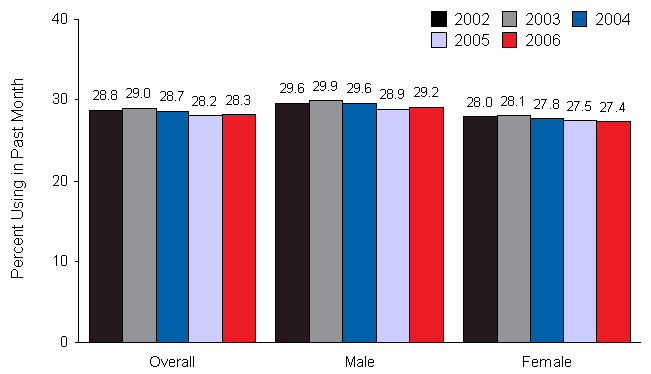
- More males than females aged 12 to 20 reported current alcohol use (29.2 vs. 27.4 percent, respectively), binge drinking (21.3 vs. 16.5 percent), and heavy drinking (7.9 vs. 4.3 percent) in 2006 (Figure 3.2).
Below is a bar graph. Click here for the text describing this graph.
Figure 3.2 Current Alcohol Use among Persons Aged 12 to 20, by Gender: 2002-2006
+Difference between this estimate and the 2006 estimate is statistically significant at the .05 level.
- Among persons aged 12 to 20, past month alcohol use rates were 18.6 percent among blacks, 19.7 percent among Asians, 25.3 percent among Hispanics, 27.5 percent among those reporting two or more races, 31.3 percent among American Indians or Alaska Natives, and 32.3 percent among whites. The 2006 rate for American Indians or Alaska Natives is higher than the 2005 rate of 21.7 percent.
- Among persons aged 12 to 20, binge drinking was reported by 23.6 percent of American Indians or Alaska Natives, 22.7 percent of whites, 20.7 percent of persons reporting two or more races, and 16.5 percent of Hispanics, but only by 11.8 percent of Asians and 8.6 percent of blacks. The 2006 rate among Asians is higher than the 2005 rate of 7.4 percent.
- Across geographic regions in 2006, underage current alcohol use rates were higher in the Northeast (32.0 percent) and Midwest (29.7 percent) than in the South (25.8 percent). The rate in the West (28.1 percent) was similar to rates in the South and Midwest regions, but significantly lower than the rate in the Northeast.
- In 2006, underage current alcohol use rates were similar in small metropolitan areas (28.9 percent), large metropolitan areas (27.8 percent), and nonmetropolitan areas (29.1 percent). The rate in completely rural nonmetropolitan areas was 28.2 percent.
Gender
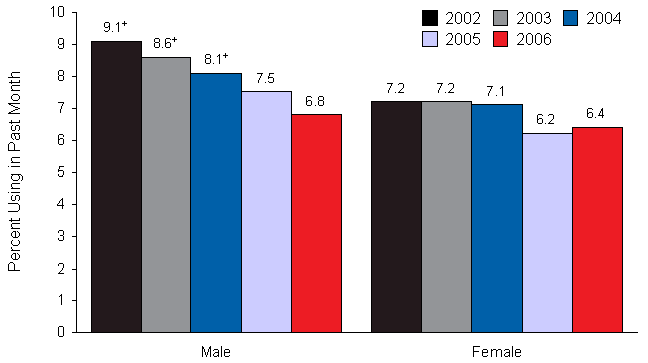
- In 2006, 57.0 percent of males aged 12 or older were current drinkers, higher than the rate for females (45.2 percent). However, among youths aged 12 to 17, the percentage of males who were current drinkers (16.3 percent) was similar to the rate for females (17.0 percent).
- Among adults aged 18 to 25, an estimated 57.9 percent of females and 65.9 percent of males reported current drinking in 2006. The 2006 rate among females aged 18 to 25 is higher than the 2005 rate of 55.4 percent.
Pregnant Women
- Among pregnant women aged 15 to 44, an estimated 11.8 percent reported current alcohol use, 2.9 percent reported binge drinking, and 0.7 percent reported heavy drinking. These rates were significantly lower than the rates for nonpregnant women in the same age group (53.0 percent, 23.6 percent, and 5.4 percent, respectively). Binge drinking during the first trimester of pregnancy dropped from 10.6 percent in combined 2003–2004 data to 4.6 percent in combined 2005-2006 data. All of the current estimates for pregnant women are based on data averaged over 2005 and 2006.
Race/Ethnicity
- Among persons aged 12 or older, whites in 2006 were more likely than other racial/ethnic groups to report current use of alcohol (55.8 percent) (Figure 3.3). The rates were 47.1 percent for persons reporting two or more races, 41.8 percent for Hispanics, 40.0 percent for blacks, 37.2 percent for American Indians or Alaska Natives, 36.7 percent for Native Hawaiians or Other Pacific Islanders, and 35.4 percent for Asians.
Below is a bar graph. Click here for the text describing this graph.
Figure 3.3 Current, Binge, and Heavy Alcohol Use among Persons Aged 12 or Older, by Race/Ethnicity: 2006
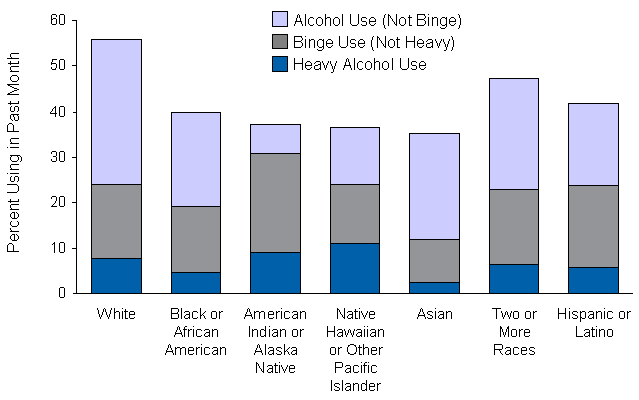
- The rate of binge alcohol use was lowest among Asians (11.8 percent). Rates for other racial/ethnic groups were 19.1 percent for blacks, 22.8 percent for persons reporting two or more races, 23.9 percent for Hispanics, 24.1 percent for whites, 24.1 percent for Native Hawaiians or Other Pacific Islanders, and 31.0 percent for American Indians or Alaska Natives.
- Among youths aged 12 to 17 in 2006, Asians and blacks had the lowest rates of past month alcohol use. Only 7.6 percent of Asian youths and 10.5 percent of black youths were current drinkers, while 15.3 percent of Hispanic youths, 16.2 percent of those reporting two or more races, 19.2 percent of white youths, and 20.5 percent of American Indian or Alaska Native youths were current drinkers.
Education
- Among adults aged 18 or older, the rate of past month alcohol use increased with increasing levels of education. Among adults with less than a high school education, 36.5 percent were current drinkers in 2006, significantly lower than the 67.3 percent of college graduates who were current drinkers. However, among adults aged 26 or older, binge and heavy alcohol use rates were lower among college graduates (19.1 and 5.4 percent, respectively) than among those who had not completed college (22.3 vs. 6.2 percent, respectively).
College Students
- Young adults aged 18 to 22 enrolled full time in college were more likely than their peers not enrolled full time (i.e., part-time college students and persons not currently enrolled in college) to use alcohol in the past month, binge drink, and drink heavily. Past month alcohol use was reported by 66.4 percent of full-time college students compared with 54.1 percent of persons aged 18 to 22 who were not enrolled full time. Binge and heavy use rates for college students were 45.5 and 19.0 percent, respectively, compared with 38.4 and 13.3 percent, respectively, for 18 to 22 year olds not enrolled full time in college.
- The pattern of higher rates of current alcohol use, binge alcohol use, and heavy alcohol use among full-time college students compared with rates for others aged 18 to 22 has remained consistent since 2002 (Figure 3.4).
Below is a bar graph. Click here for the text describing this graph.
Figure 3.4 Heavy Alcohol Use among Adults Aged 18 to 22, by College Enrollment: 2002-2006

+Difference between this estimate and the 2006 estimate is statistically significant at the .05 level.
Employment
- Rates of current alcohol use were 62.0 percent for full-time employed adults aged 18 or older in 2006, higher than the rate for unemployed adults (52.1 percent). However, the pattern was different for binge and heavy alcohol use. Rates of binge and heavy use for unemployed persons were 34.2 and 12.2 percent, respectively, while these rates were 29.7 and 8.9 percent for full-time employed persons.
- Most binge and heavy alcohol users were employed in 2006. Among 54.0 million adult binge drinkers, 42.9 million (79.4 percent) were employed either full or part time. Among 16.3 million heavy drinkers, 12.9 million (79.2 percent) were employed.
Geographic Area
- The rate of past month alcohol use for people aged 12 or older in 2006 was lower in the South (46.9 percent) than in the Northeast (56.3 percent), Midwest (53.5 percent), or West (50.4 percent).
- Among people aged 12 or older, the rate of past month alcohol use in large metropolitan areas (53.5 percent) was higher than the 49.6 percent in small metropolitan areas and 45.0 percent in nonmetropolitan areas. Binge drinking was equally prevalent in small metropolitan areas (22.6 percent), large metropolitan areas (23.4 percent), and nonmetropolitan areas (22.2 percent). The rate of heavy alcohol use in large metropolitan areas increased from 6.1 percent in 2005 to 6.7 percent in 2006. The rates in small metropolitan areas and nonmetropolitan areas in 2006 were both 7.1 percent.
- The rates of binge alcohol use among youths aged 12 to 17 were 11.2 percent in nonmetropolitan areas, 9.8 percent in small metropolitan areas, and 10.3 percent in large metropolitan areas, where the rate increased from 9.3 percent in 2005. In completely rural counties of nonmetropolitan areas, 12.2 percent of youths reported binge drinking in 2006.
Association with Illicit Drug and Tobacco Use
- The level of alcohol use was associated with illicit drug use in 2006. Among the 16.9 million heavy drinkers aged 12 or older, 32.6 percent were current illicit drug users. Persons who were not current alcohol users were less likely to have used illicit drugs in the past month (3.4 percent) than those who reported (a) current use of alcohol but did not meet the criteria for binge or heavy use (6.4 percent), (b) binge use but did not meet the criteria for heavy use (16.0 percent), or (c) heavy use of alcohol (32.6 percent).
- Alcohol consumption levels also were associated with tobacco use. Among heavy alcohol users aged 12 or older, 58.3 percent smoked cigarettes in the past month, while only 20.4 percent of non-binge current drinkers and 17.2 percent of persons who did not drink alcohol in the past month were current smokers. Smokeless tobacco use and cigar use also were more prevalent among heavy drinkers (11.4 and 18.7 percent, respectively) than among non-binge drinkers (2.1 and 4.6 percent) and nondrinkers (2.2 and 2.1 percent).
Driving Under the Influence of Alcohol
- In 2006, an estimated 12.4 percent of persons aged 12 or older drove under the influence of alcohol at least once in the past year (Figure 3.5). This percentage has dropped since 2002, when it was 14.2 percent, and is significantly lower than 2005, when it was 13.0 percent. The 2006 estimate corresponds to 30.5 million persons.
Below is a bar graph. Click here for the text describing this graph.
Figure 3.5 Driving Under the Influence of Alcohol in the Past Year among Persons Aged 12 or Older: 2002-2006
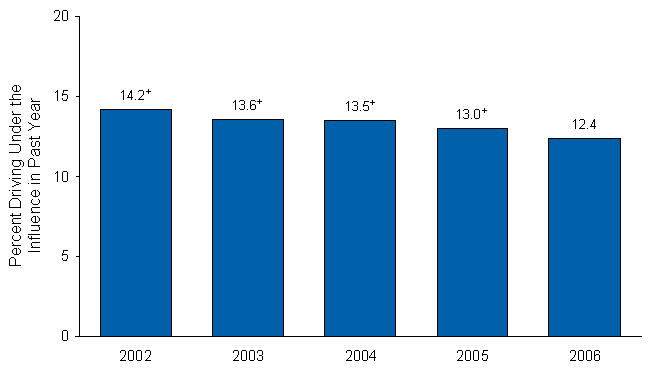
+Difference between this estimate and the 2006 estimate is statistically significant at the .05 level.
- Driving under the influence of alcohol was associated with age in 2006. An estimated 7.9 percent of 16 or 17 year olds, 19.7 percent of 18 to 20 year olds, and 27.3 percent of 21 to 25 year olds reported driving under the influence of alcohol in the past year (Figure 3.6). Beyond age 25, these rates showed a general decline with increasing age.
- Among persons aged 12 or older, males were nearly twice as likely as females (16.3 vs. 8.6 percent) to drive under the influence of alcohol in the past year.
Below is a bar graph. Click here for the text describing this graph.
Figure 3.6 Driving Under the Influence of Alcohol in the Past Year among Persons Aged 16 or Older, by Age: 2006
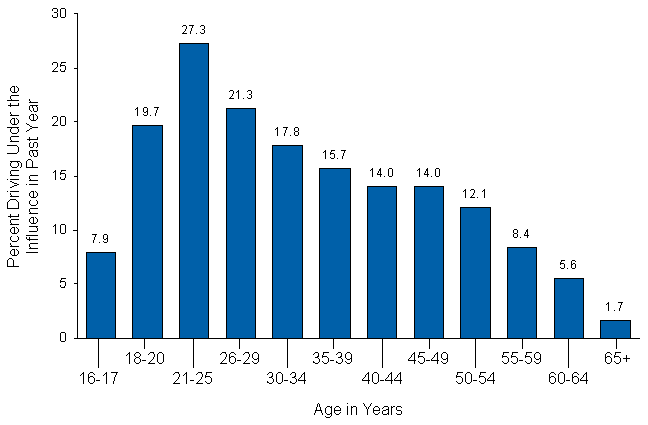
|
| |
| |
|
|
2006
National Survey on Drug Use & Health: National Results
|
4. Tobacco Use
The National Survey on Drug Use and Health (NSDUH) includes a series of questions about the use of tobacco products, including cigarettes, chewing tobacco, snuff, cigars, and pipe tobacco. Cigarette use is defined as smoking "part or all of a cigarette." For analytic purposes, data for chewing tobacco and snuff are combined as "smokeless tobacco."
- In 2006, an estimated 72.9 million Americans aged 12 or older were current (past month) users of a tobacco product. This represents 29.6 percent of the population in that age range. In addition, 61.6 million persons (25.0 percent of the population) were current cigarette smokers; 13.7 million (5.6 percent) smoked cigars; 8.2 million (3.3 percent) used smokeless tobacco; and 2.3 million (0.9 percent) smoked tobacco in pipes (Figure 4.1).
Below is a bar graph. Click here for the text describing this graph.
Figure 4.1 Past Month Tobacco Use among Persons Aged 12 or Older: 2002-2006
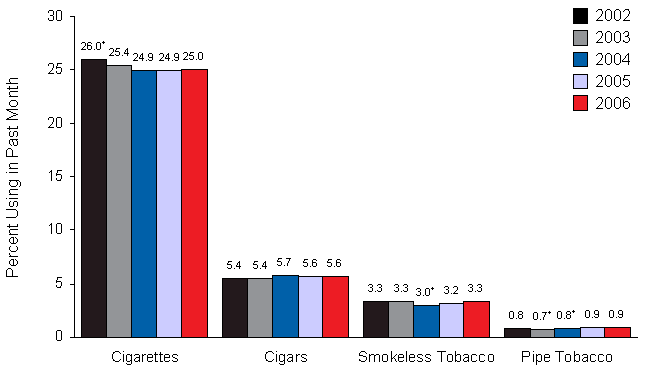
+Difference between this estimate and the 2006 estimate is statistically significant at the .05 level.
- The rates of current use of cigarettes, smokeless tobacco, cigars, and pipe tobacco were unchanged between 2005 and 2006. However, between 2002 and 2006, past month cigarette use decreased from 26.0 to 25.0 percent. Rates of past month use of cigars, smokeless tobacco, and pipe tobacco were similar in 2002 and 2006.
Age
- Young adults aged 18 to 25 had the highest rate of current use of a tobacco product (43.9 percent) and of each specific product compared with youths aged 12 to 17 and adults aged 26 or older. In 2006, the rates of past month use among young adults were 38.4 percent for cigarettes, 12.1 percent for cigars, 5.2 percent for smokeless tobacco, and 1.3 percent for pipe tobacco. The rate of current use of a tobacco product by young adults decreased from 2002 to 2006 (45.3 vs. 43.9 percent), as did the rate of cigarette use (40.8 vs. 38.4 percent). However, the rate of current use of cigars by young adults was higher in 2006 than in 2002 (12.1 vs. 11.0 percent).
- Among youths aged 12 to 17 in 2006, 3.3 million (12.9 percent) used a tobacco product in the past month, and 2.6 million (10.4 percent) used cigarettes (Figure 4.2). The rate of past month cigarette use among 12 to 17 year olds declined from 13.0 percent in 2002 to 10.4 percent in 2006. Past month use of smokeless tobacco, however, was higher in 2006 (2.4 percent) than in 2002 (2.0 percent).
Below is a line graph. Click here for the text describing this graph.
Figure 4.2 Past Month Tobacco Use among Youths Aged 12 to 17: 2002-2006
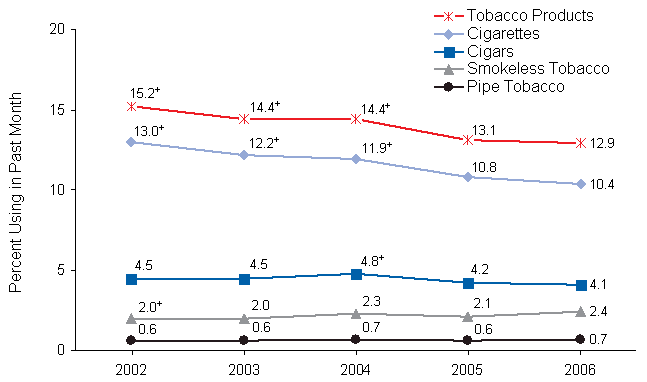
+Difference between this estimate and the 2006 estimate is statistically significant at the .05 level.
- In 2006, 1.7 percent of 12 or 13 year olds, 9.1 percent of 14 or 15 year olds, and 19.9 percent of 16 or 17 year olds were current cigarette smokers (Figure 4.3). The percentage of past month cigarette smokers among 12 or 13 year olds was lower in 2006 than in 2005 (1.7 vs. 2.4 percent). Across age groups, current cigarette use peaked at 40.2 percent among young adults aged 21 to 25. Less than a quarter (22.5 percent) of persons in the 35 or older age group in 2006 smoked cigarettes in the past month.
Below is a bar graph. Click here for the text describing this graph.
Figure 4.3 Past Month Cigarette Use among Persons Aged 12 or Older, by Age: 2006
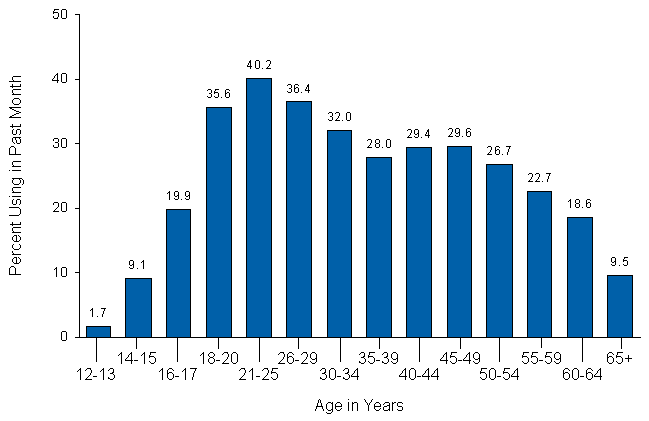
Gender
- In 2006, current use of a tobacco product among persons aged 12 or older was reported by a higher percentage of males (36.4 percent) than females (23.3 percent). Males also had higher rates of past month use than females of each specific tobacco product: cigarette smoking (27.8 percent of males vs. 22.4 percent of females), cigar smoking (9.3 vs. 2.1 percent), use of smokeless tobacco (6.6 vs. 0.3 percent), and use of pipe tobacco (1.7 vs. 0.2 percent).
- Among youths aged 12 to 17, the rate of current cigarette smoking in 2006 did not differ significantly for females (10.7 percent) and males (10.0 percent). The rate for both males and females declined between 2002 and 2006 (12.3 percent for males in 2002; 13.6 percent for females in 2002) (Figure 4.4).
Below is a bar graph. Click here for the text describing this graph.
Figure 4.4 Past Month Cigarette Use among Youths Aged 12 to 17, by Gender: 2002-2006
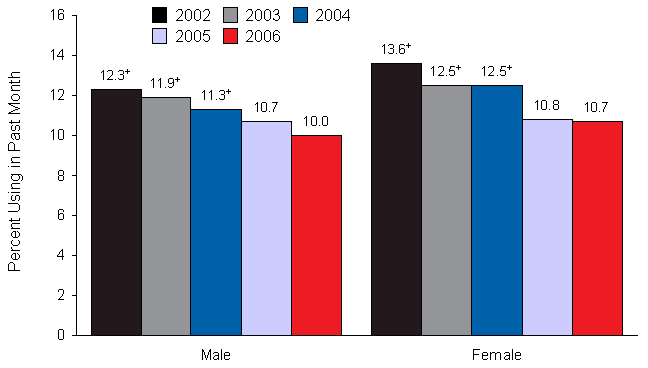
+Difference between this estimate and the 2006 estimate is statistically significant at the .05 level.
Pregnant Women
- Among women aged 15 to 44, combined data for 2005 and 2006 indicated that the rate of past month cigarette use was lower among those who were pregnant (16.5 percent) than it was among those who were not pregnant (29.5 percent).
- Looking at combined 2005-2006 data, rates of past month cigarette smoking were lower for pregnant women than nonpregnant women among those aged 26 to 44 (10.3 vs. 29.1 percent) and among those aged 18 to 25 (25.6 vs. 35.6 percent) (Figure 4.5). However, among those aged 15 to 17, the rate of cigarette smoking for pregnant women was higher than for nonpregnant women (23.1 vs. 17.1 percent), although the difference was not significant. Similar patterns were observed in the combined 2003-2004 data.
Below is a bar graph. Click here for the text describing this graph.
Figure 4.5 Past Month Cigarette Use among Women Aged 15 to 44, by Age and Pregnancy Status: 2005-2006 Combined
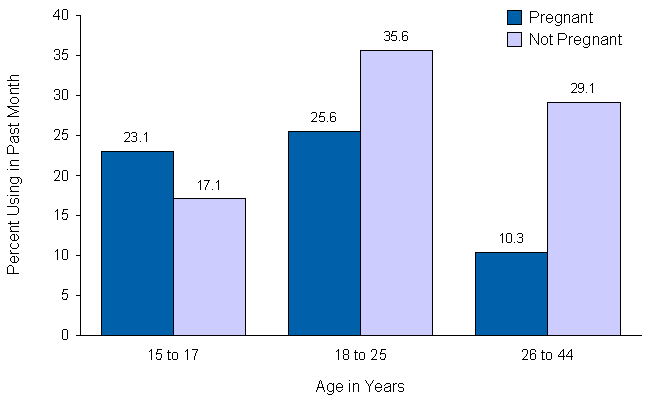
Race/Ethnicity
- In 2006, the prevalence of current use of a tobacco product among persons aged 12 or older was 16.0 percent for Asians, 24.4 percent for Hispanics, 29.1 percent for blacks, 31.4 percent for whites, 34.2 percent for persons who reported two or more races, and 42.3 percent for American Indians or Alaska Natives. There were no statistically significant changes in past month tobacco use between 2005 and 2006 for any of these racial/ethnic groups.
- In 2006, current cigarette smoking among youths aged 12 to 17 and young adults aged 18 to 25 was more prevalent among whites than blacks (12.4 vs. 6.0 percent for youths and 44.4 vs. 27.5 percent for young adults). Among adults aged 26 or older, however, whites and blacks used cigarettes at about the same rate (24.9 and 27.2 percent, respectively). The rates for Hispanics were 8.2 percent among youths, 28.8 percent among young adults, and 23.6 percent among those aged 26 or older.
- Current use of smokeless tobacco decreased from 8.1 percent in 2005 to 3.2 percent in 2006 among American Indians or Alaska Natives aged 12 to 17. In the same age group, past month use of smokeless tobacco among blacks increased from 0.1 to 0.5 percent.
Education
- Cigarette smoking in the past month was less prevalent among adults with more education. Among adults aged 18 or older, current cigarette use in 2006 was reported by 35.6 percent of those who had not completed high school, 31.9 percent of high school graduates who did not attend college, 27.7 percent of persons with some college, and 14.3 percent of college graduates (Figure 4.6). Past month cigarette smoking among young adults aged 18 to 25 who had some college decreased from 36.1 percent in 2005 to 33.8 percent in 2006.
Below is a bar graph. Click here for the text describing this graph.
Figure 4.6 Past Month Tobacco Use among Persons Aged 18 or Older, by Education: 2006
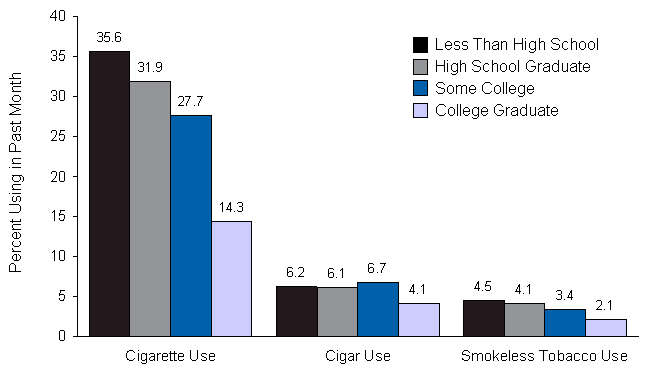
- In 2006, the use of smokeless tobacco in the past month was reported by 4.5 percent of persons aged 18 or older who had not completed high school, 4.1 percent of those who completed high school but did not attend college, and 3.4 percent of those who attended some college. The prevalence among college graduates, 2.1 percent, was lower than among the other groups.
College Students
- Among young adults 18 to 22 years old, full-time college students were less likely to be current cigarette smokers than their peers who were not enrolled full time in college. Cigarette use in the past month in 2006 was reported by 28.4 percent of full-time college students, less than the rate of 43.5 percent for those not enrolled full time.
- In 2006, past month cigar smoking was equally common among male full-time college students aged 18 to 22 (19.0 percent) as among males in the same age group who were not enrolled full time in college (20.3 percent).
- Among full-time college students aged 19, current cigarette smoking increased from 24.4 percent in 2005 to 28.8 percent in 2006; however, it decreased for students aged 20 (from 32.3 to 27.2 percent) and 21 (from 36.3 to 30.2 percent). Past month cigarette smoking also declined from 32.9 to 23.5 percent among Hispanic full-time students aged 18 to 22. Use of any tobacco product and of the individual products remained stable for persons aged 18 to 22 who were not enrolled as full-time college students.
Employment
- In 2006, current cigarette smoking was more common among unemployed adults aged 18 or older than among adults who were working full time or part time (47.8 vs. 28.8 and 25.4 percent, respectively). Cigar smoking followed a similar pattern, with 11.3 percent of unemployed adults reporting past month use compared with 6.8 percent of full-time workers and 5.6 percent of part-time workers.
- Current use of smokeless tobacco was higher among adults aged 18 or older who were employed full time (4.6 percent) than among adults who were employed part time (1.9 percent) and the "other" employment category, which includes persons not in the labor force (2.0 percent). The rate among unemployed adults was 3.4 percent.
Geographic Area
- In 2006, current cigarette smoking among persons aged 12 or older was lowest in the West (21.2 percent) and Northeast (23.0 percent) and higher in the Midwest (27.4 percent) and South (27.0 percent). Use of smokeless tobacco was higher in the South and Midwest (4.3 and 3.8 percent, respectively) than in the West and Northeast (2.7 and 1.8 percent, respectively), with the lowest rate occurring in the Northeast. Cigar smoking was highest in the Midwest (6.5 percent).
- In the West, the prevalence of current smokeless tobacco use among persons aged 12 or older increased from 2.0 percent in 2005 to 2.7 percent in 2006; this increase also occurred both among youths aged 12 to 17 (from 1.0 to 1.8 percent) and adults aged 18 or older (from 2.2 to 2.8 percent). In the South, current cigarette smoking among adults aged 26 or older increased from 25.0 percent in 2005 to 27.1 percent in 2006.
- Among persons aged 12 or older, the rate of current cigarette use was associated with county type in 2006. The rates of cigarette smoking were 30.1 percent in completely rural counties, 29.3 percent in less urbanized nonmetropolitan areas, 26.6 percent in urbanized nonmetropolitan areas, 26.3 percent in small metropolitan areas, and 23.3 percent in large metropolitan areas.
- In completely rural nonmetropolitan counties, current cigarette use among persons aged 12 or older increased from 23.3 percent in 2005 to 30.1 percent in 2006, a rate similar to those observed in 2002 and 2003 (31.8 and 28.0, respectively). This pattern was largely attributable to persons aged 18 or older, whose rate of current smoking increased from 24.2 percent in 2005 to 32.2 percent in 2006, similar to the rate in 2002 (33.2 percent). Among rural youths aged 12 to 17, the percentage of current cigarette smokers in 2006 was lower than it was in 2002 (12.0 vs. 20.4 percent).
- Use of smokeless tobacco in the past month among persons aged 12 or older was lowest in large metropolitan areas (2.0 percent). In small metropolitan areas, the rate was 3.7 percent; in nonmetropolitan areas, it was 7.1 percent; and in completely rural nonmetropolitan counties, the rate was 10.0 percent.
Association with Illicit Drug and Alcohol Use
- Use of illicit drugs and alcohol was more common among current cigarette smokers than among nonsmokers in 2006, as in 2002 through 2005. Among persons aged 12 or older, 20.4 percent of past month cigarette smokers reported current use of an illicit drug compared with 4.2 percent of persons who were not current cigarette smokers (Figure 4.7). Past month alcohol use was reported by 66.3 percent of current cigarette smokers compared with 45.8 percent of those who did not use cigarettes in the past month. The association also was found with binge drinking (43.6 percent of current cigarette users vs. 16.1 percent of current nonusers) and heavy drinking (16.0 vs. 3.8 percent, respectively).
- Use of tobacco products other than cigarettes was higher among current cigarette smokers than among current nonsmokers. Smokeless tobacco use in the past month was reported by 5.0 percent of current cigarette smokers compared with 2.8 percent of nonsmokers. Moreover, 12.5 percent of current cigarette smokers also smoked cigars in the past month compared with 3.3 percent of those who did not smoke cigarettes, and 2.1 percent of current cigarette smokers also used pipes in the past month compared with 0.6 percent of those who did not smoke cigarettes.
Below is a bar graph. Click here for the text describing this graph.
Figure 4.7 Past Month Illicit Drug Use and Binge Alcohol Use among Persons Aged 12 or Older, by Current Cigarette Use: 2006
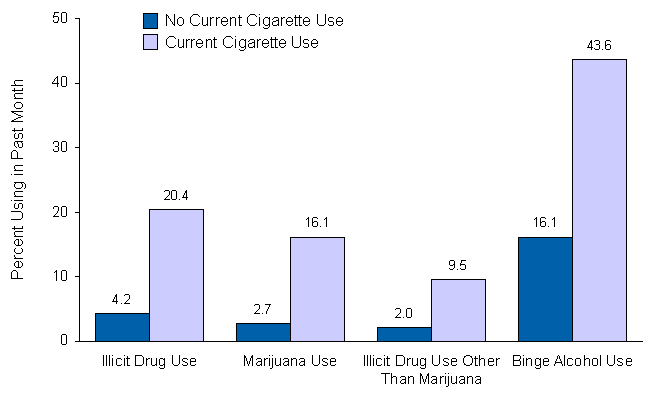
|
| |
| |
|
|
2006
National Survey on Drug Use & Health: National Results
|
5. Initiation of Substance Use
Information on substance use initiation, also known as incidence or first-time use, is important for policymakers and researchers. Measures of initiation are often leading indicators of emerging patterns of substance use. They provide valuable information that can be used in the assessment of the effectiveness of current prevention programs and in focusing prevention efforts.
With its large sample size and oversampling of youths aged 12 to 17 and young adults aged 18 to 25, the National Survey on Drug Use and Health (NSDUH) provides a variety of estimates related to substance use initiation based on questions on age and month at first use. Using this information, along with the interview date and the respondent's date of birth, a date of first use is determined for each substance used by a respondent. Estimates of the number of initiates, rates of initiation, and average age at first use can be constructed for specific time periods. For example, estimates for calendar years as far back as 1965 have been tabulated from 2002-2004 NSDUH data to show long-term trends in initiation. However, methodological assessments of these long-term trend estimates of initiation have suggested that they are biased due to suspected recall errors that seem to increase with the length of recall (Gfroerer, Hughes, Chromy, Heller, & Packer, 2004). Evidence of forward and backward telescoping, where respondents shift their reported age at first use either closer to their current age or further from the interview date, also has been found (Golub, Johnson, & Labouvie, 2000; Johnson & Schultz, 2005).
Because of concerns about the validity of trend estimates of incidence based on long recall periods, an alternative approach to estimating incidence was developed and presented for the first time in the 2004 NSDUH national findings report (Office of Applied Studies [OAS], 2005b) and has continued in subsequent NSDUH reports, including the present one. The new estimates describe initiation of substance use in the 12 months prior to the interview date, and individuals who initiated use within the past 12 months are defined as recent or past year initiates. Estimates for each year are produced independently based on the data from the survey conducted that year. This approach should improve the comparability of estimates across years. Although it will not eliminate reporting biases, the approach should minimize recall bias because the estimates are based on a more recent time period than the previously produced calendar year estimates. The more recent time period also provides more timely information on incidence. Finally, an advantage of this approach is that initiation estimates can be analyzed in conjunction with past year prevalence estimates because they reflect the same time period. For example, this approach allows the estimation of initiates as a proportion of past year users. For specific substances, initiation prior to age 12 is not well covered, and initiation prior to age 11 is not included at all. This problem primarily affects estimates of initiation for cigarettes, alcohol, and inhalants because they tend to be initiated at a younger age than other substances.
As a measure of central tendency, means are heavily influenced by the presence of extreme values in the data. Thus, for the purposes of this report and unless specified otherwise, the mean age at initiation pertains to persons aged 12 to 49. This constraint was implemented so that the mean age estimates reported would not be influenced by those few respondents who were past year initiates at age 50 or older. This should increase the utility of these results to health researchers and analysts by providing a better picture of the substance use initiation behaviors among the civilian, noninstitutionalized population in the United States. Note that this constraint only affects estimates of mean age at initiation; other estimates in this chapter, including the number and prevalence of past year initiates, are among all persons aged 12 or older.
See Section B.4.1 in Appendix B for further discussion of the methods and bias in initiation estimates. The Substance Abuse and Mental Health Services Administration (SAMHSA) continues to study the advantages and disadvantages of alternative methods of estimating incidence.
Illicit Drugs
- In 2006, an estimated 2.8 million persons aged 12 or older used an illicit drug for the first time within the past 12 months; this averages to nearly 8,000 initiates per day. This estimate was not significantly different from the number in 2005 (2.9 million). More than half of initiates (57.8 percent) were younger than age 18 when they first used, and about half of new users (53.2 percent) were female. The average age at initiation among persons aged 12 to 49 was 19.0 years.
- The specific drug categories with the largest number of recent initiates among persons aged 12 or older were nonmedical use of pain relievers (2.2 million) and marijuana use (2.1 million), followed by nonmedical use of tranquilizers (1.1 million), cocaine (1.0 million), Ecstasy (0.9 million), stimulants (0.8 million), and inhalants (0.8 million) (Figure 5.1).
- Among persons aged 12 to 49, the average age at first use of inhalants in 2006 was 15.7 years; it was 17.4 years for marijuana, 20.3 years for cocaine, 20.6 years for Ecstasy, 21.9 years for pain relievers, and 26.5 for sedatives (Figure 5.2).
Below is a bar graph. Click here for the text describing this graph.
Figure 5.1 Past Year Initiates for Specific Illicit Drugs among Persons Aged 12 or Older: 2006
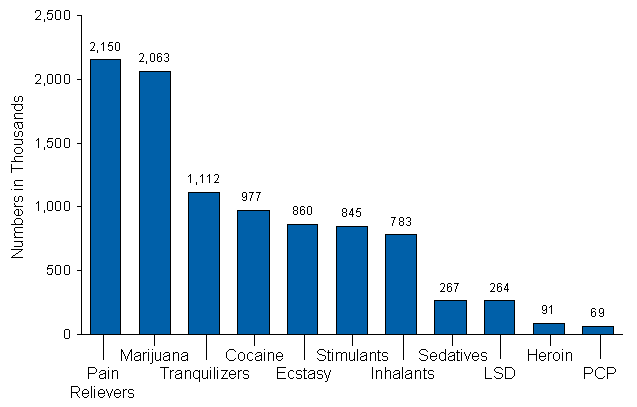
Below is a bar graph. Click here for the text describing this graph.
Figure 5.2 Mean Age at First Use for Specific Illicit Drugs among Past Year Initiates Aged 12 to 49: 2006
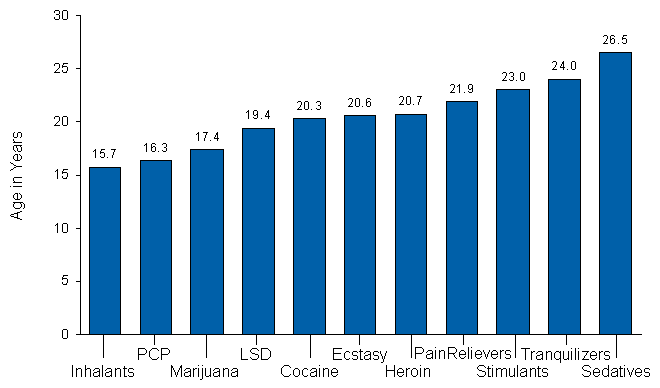
Marijuana
- In 2006, there were 2.1 million persons who had used marijuana for the first time within the past 12 months; this averages to approximately 6,000 initiates per day. This estimate was about the same as the number in 2005 (2.1 million), 2004 (2.1 million), 2003 (2.0 million), and 2002 (2.2 million) (Figure 5.3).
Below is a bar graph. Click here for the text describing this graph.
Figure 5.3 Past Year Marijuana Initiates among Persons Aged 12 or Older and Mean Age at First Use of Marijuana among Past Year Marijuana Initiates Aged 12 to 49: 2002-2006
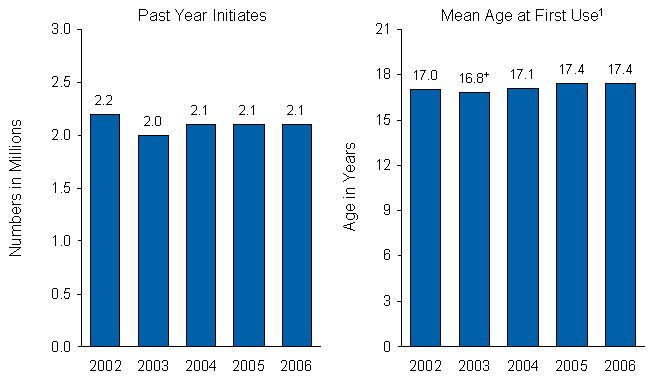
+Difference between this estimate and the 2006 estimate is statistically significant at the .05 level.
1Mean-age-at-first-use estimates are for recent initiates aged 12 to 49.
- Most (63.3 percent) of the 2.1 million recent marijuana initiates were younger than age 18 when they first used. Among youths aged 12 to 17, an estimated 4.7 percent had used marijuana for the first time within the past year, similar to the rate in 2005 (4.5 percent).
- As a percentage of those aged 12 to 17 who had not used marijuana prior to the past year, youth marijuana initiation in 2006 (5.4 percent) was similar to the rate in 2005 (5.2 percent).
- In 2006, the average age at first marijuana use among recent initiates aged 12 to 49 was 17.4 years, the same as the average in 2005 (Figure 5.3). Among recent initiates aged 12 or older who initiated use prior to the age of 21, the mean ages at first use were 15.9 years in 2002, 15.9 years in 2003, 16.0 years in 2004, 16.0 years in 2005, and 16.1 years in 2006.
Cocaine
- In 2006, there were 977,000 persons aged 12 or older who had used cocaine for the first time within the past 12 months; this averages to approximately 2,700 initiates per day. This estimate was not significantly different from the number in 2005 (872,000).
- Most (66.1 percent) of the 1.0 million recent cocaine initiates were 18 or older when they first used. The average age at first use among recent initiates aged 12 to 49 was 20.3 years, which was slightly higher than the average age in 2005 (19.7 years), although this difference in the average was not statistically significant.
Heroin
- In 2006, there were 91,000 persons aged 12 or older who had used heroin for the first time within the past 12 months. The average age at first use among recent initiates aged 12 to 49 was 20.7 years in 2006. There were no significant changes in the number of initiates or in the average age at first use from 2005 to 2006.
Hallucinogens
- In 2006, there were 1.1 million persons aged 12 or older who had used hallucinogens for the first time within the past 12 months. This estimate was not significantly different from the estimate in 2005 (953,000), but it was higher than the estimates in 2004 (934,000) and 2003 (886,000).
- There was no significant change between 2005 and 2006 in the number of past year initiates of LSD.
- There was an increase in the past year initiates of Ecstasy between 2005 and 2006. The number of Ecstasy initiates in the past year was 1.2 million in 2002, 642,000 in 2003, 607,000 in 2004, 615,000 in 2005, and 860,000 in 2006 (Figure 5.4). Most (70.1 percent) of the recent Ecstasy initiates in 2006 were aged 18 or older at the time they first used Ecstasy. The corresponding figure was 65.9 percent in 2005. Among past year initiates aged 12 to 49, the average age at initiation of Ecstasy in 2006 was 20.6 years, similar to the average age in 2005 (20.7 years).
Below is a bar graph. Click here for the text describing this graph.
Figure 5.4 Past Year Ecstasy Initiates among Persons Aged 12 or Older and Mean Age at First Use of Ecstasy among Past Year Ecstasy Initiates Aged 12 to 49: 2002-2006
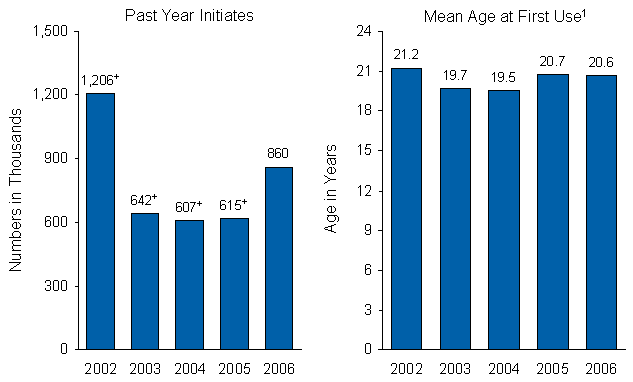
+Difference between this estimate and the 2006 estimate is statistically significant at the .05 level.
1Mean-age-at-first-use estimates are for recent initiates aged 12 to 49.
Inhalants
- In 2006, there were 783,000 persons aged 12 or older who had used inhalants for the first time within the past 12 months; 77.2 percent were under age 18 when they first used. The average age at first use among recent initiates aged 12 to 49 was 15.7 years in 2006. There was no significant change in the number of inhalant initiates or the average age at first use from 2005 to 2006.
Psychotherapeutics
- Psychotherapeutics include the nonmedical use of any prescription-type pain relievers, tranquilizers, stimulants, or sedatives. Over-the-counter substances are not included. In 2006, there were 2.6 million persons aged 12 or older who used psychotherapeutics nonmedically for the first time within the past year. The numbers of new users of specific psychotherapeutics in 2006 were 2.2 million for pain relievers, 1.1 million for tranquilizers, 845,000 for stimulants, and 267,000 for sedatives. There was a significant increase in the number of past year initiates of stimulants from 2005 (647,000) to 2006, but there were no significant changes in the estimates for the remaining psychotherapeutics.
- The average age at first nonmedical use of psychotherapeutics among recent initiates aged 12 to 49 was 22.9 years. For specific drug classes, the average ages were 21.9 years for pain relievers, 23.0 years for stimulants, 24.0 years for tranquilizers, and 26.5 years for sedatives.
- In 2006, the number of new nonmedical users of OxyContin® aged 12 or older was 533,000, with an average age at first use of 22.6 years among those aged 12 to 49. These estimates are similar to those for 2005 (526,000 and 23.2 years, respectively).
- The number of recent new users of methamphetamine taken nonmedically among persons aged 12 or older was 259,000 in 2006 (Figure 5.5). This estimate was not significantly different from the estimate in each year between 2002 and 2005, although there was a decline in methamphetamine initiates from 318,000 in 2004 to 192,000 in 2005. The average age of new methamphetamine users aged 12 to 49 was 18.9 years in 2002, 20.4 years in 2003, 20.6 years in 2004, 18.6 years in 2005, and 22.2 years in 2006. The difference in the 2006 estimate of this average age was not significantly different from the estimate in each year between 2002 and 2005.
Below is a bar graph. Click here for the text describing this graph.
Figure 5.5 Past Year Methamphetamine Initiates among Persons Aged 12 or Older and Mean Age at First Use of Methamphetamine among Past Year Methamphetamine Initiates Aged 12 to 49: 2002-2006
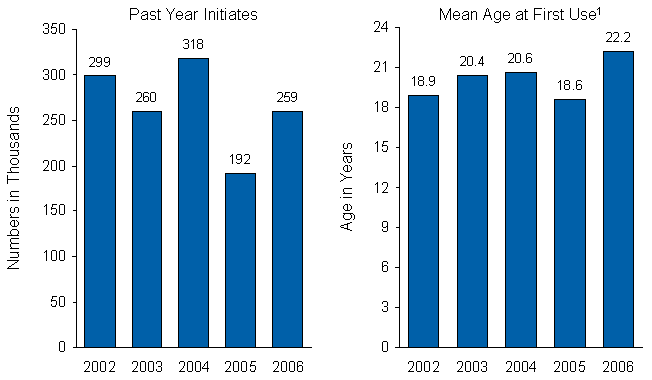
+Difference between this estimate and the 2006 estimate is statistically significant at the .05 level.
1Mean-age-at-first-use estimates are for recent initiates aged 12 to 49.
Alcohol
- In 2006, there were 4.4 million persons aged 12 or older who had used alcohol for the first time within the past 12 months; this averages to approximately 12,000 initiates per day. The number of alcohol initiates was significantly greater than in 2002 (3.9 million) and 2003 (4.1 million), but similar to the numbers in 2004 (4.4 million) and 2005 (4.3 million).
- Most (89.2 percent) of the 4.4 million recent alcohol initiates were younger than 21 at the time of initiation.
- In 2006, the average age at first alcohol use among recent initiates aged 12 to 49 was 16.6 years, similar to the corresponding 2005 estimate (16.4 years). The mean age at first use among recent initiates aged 12 or older who initiated use prior to the age of 21 was 15.8 years. This is significantly higher than the 2005 estimate (15.6 years).
Tobacco
- The number of persons aged 12 or older who smoked cigarettes for the first time within the past 12 months was 2.4 million in 2006, which was similar to the estimate in 2005 (2.3 million) but significantly greater than the estimate for 2002 (1.9 million) (Figure 5.6). Most new smokers in 2006 were under age 18 when they first smoked cigarettes (61.2 percent).
Below is a bar graph. Click here for the text describing this graph.
Figure 5.6 Past Year Cigarette Initiates among Persons Aged 12 or Older, by Age at First Use: 2002-2006
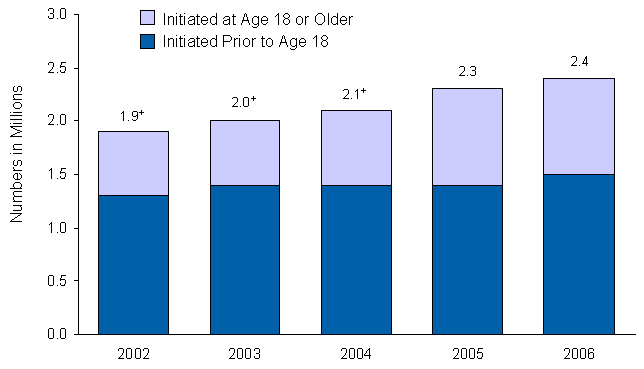
+Difference between this estimate and the 2006 estimate is statistically significant at the .05 level.
- In 2006, among recent initiates aged 12 to 49, the average age of first cigarette use was 17.1 years, similar to the average in 2005 (17.3 years).
- Of those aged 12 or older who had not smoked cigarettes prior to the past year, the past year initiation rate for cigarettes was 2.9 percent in 2006, similar to the rate in 2005 (2.7 percent). Among youths aged 12 to 17 years, incidence showed no significant changes between 2002 (6.7 percent) and 2006 (6.6 percent). This pattern was observed for both male and female youths (Figure 5.7).
Below is a bar graph. Click here for the text describing this graph.
Figure 5.7 Past Year Cigarette Initiation among Youths Aged 12 to 17 Who Had Never Smoked, by Gender: 2002-2006
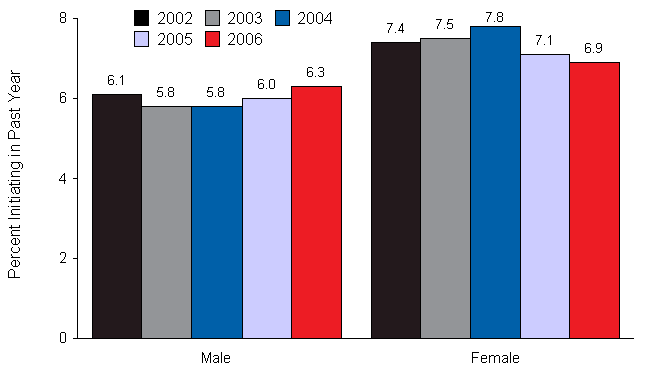
+Difference between this estimate and the 2006 estimate is statistically significant at the .05 level.
- In 2006, the number of persons who had started smoking cigarettes daily within the past 12 months was 1.1 million. This estimate is similar to the estimates for 2002 (1.0 million), 2003 (1.1 million), 2004 (1.1 million), and 2005 (1.0 million). Of these new daily smokers in 2006, 44.2 percent, or 0.5 million (an average of about 1,300 initiates per day), were younger than age 18 when they started smoking daily.
- The average age of first daily smoking among new daily smokers aged 12 to 49 in 2006 was 18.9 years. This was not significantly different from the average in 2005 (19.7 years).
- In 2006, there were 3.1 million persons aged 12 or older who had used cigars for the first time in the past 12 months, similar to the number in 2005 (3.3 million). However, this estimate reflects a significant increase in the number of initiates from 2003 (2.7 million). Among past year cigar initiates aged 12 to 49, the average age at first use was lower in 2006 (19.9 years) than in 2005 (21.2 years).
- The number of persons aged 12 or older initiating use of smokeless tobacco in the past year was higher in 2006 (1.3 million) than in 2005 (1.1 million) and more than 30 percent higher than in 2002 (951,000). More than three quarters (77.8 percent) of new initiates in 2006 were male, and about half (49.3 percent) were under age 18 when they first used.
- The average age at first smokeless tobacco use among recent initiates aged 12 to 49 in 2006 was 19.0 years. Averages were 18.5 years for males and 20.9 years for females.
|
| |
| |
|
|
2006
National Survey on Drug Use & Health: National Results
|
6. Youth Prevention-Related Measures
The National Survey on Drug Use and Health (NSDUH) includes questions for youths aged 12 to 17 about a number of risk and protective factors that may affect the likelihood that they will engage in substance use. Risk factors are individual characteristics and environmental influences associated with an increased vulnerability to the initiation, continuation, or escalation of substance use. Protective factors include individual resilience and other circumstances that appear to reduce the likelihood of substance use. Risk and protective factors include variables that operate at different stages of development and reflect different domains of influence, including the individual, family, peer, school, community, and societal levels (Hawkins, Catalano, & Miller, 1992). Interventions to prevent substance use generally are designed to ameliorate the influence of risk factors and enhance the effectiveness of protective factors.
This chapter presents findings for youth prevention-related measures collected in the 2006 NSDUH and compares these with findings from previous years. Included are measures of perceived risk from substance use (cigarettes, alcohol, and illicit drugs), perceived availability of substances, perceived parental disapproval of substance use, feelings about peer substance use, involvement in fighting and delinquent behavior, participation in religious and other activities, exposure to substance use prevention messages and programs, and parental involvement.
In this chapter, rates of substance use are compared for persons responding differently to questions reflecting risk or protective factors, such as the perceived risk of harm from using a substance. Because the NSDUH data for an individual are collected at only one point in time, it is not possible to determine causal connections from these data. However, a number of research studies of youths have shown that reducing risk factors and increasing protective factors can reduce rates of substance use (Botvin, Botvin, & Ruchlin, 1998). This report shows that marijuana use, cigarette use, and alcohol use among youths aged 12 to 17 decreased between 2002 and 2006, yet corresponding changes in individual risk and protective factors for the same period may or may not have occurred. There can be many reasons for this, such as the lack of or a weak causal connection, a lagged relationship between the occurrence of a risk factor and the change in drug use behavior, or that individual use is typically the result of multiple simultaneous risk factors rather than a single factor (Newcomb, Maddahian, & Bentler, 1986).
Perceptions of Risk
One factor that can influence whether youths will use tobacco, alcohol, or illicit drugs is the extent to which youths believe these substances might cause them harm. NSDUH respondents were asked how much they thought people risk harming themselves physically and in other ways when they use various substances. Response choices for these items were "great risk," "moderate risk," "slight risk," or "no risk."
- The percentages of youths reporting binge alcohol use and use of cigarettes and marijuana in the past month were lower among those who perceived great risk in using these substances than among those who did not perceive great risk. For example, in 2006, 6.0 percent of youths aged 12 to 17 who perceived great risk from "having 5 or more drinks of an alcoholic beverage once or twice a week" reported binge drinking in the past month (consumption of five or more drinks of an alcoholic beverage on a single occasion on at least 1 day in the past 30 days); by contrast, past month binge drinking was reported by 13.2 percent of youths who saw moderate, slight, or no risk from having five or more drinks of an alcoholic beverage once or twice a week (Figure 6.1). Past month marijuana use was reported by 1.5 percent of youths who saw great risk in smoking marijuana once a month compared with 9.5 percent of youths who saw moderate, slight, or no risk.
Below is a bar graph. Click here for the text describing this graph.
Figure 6.1 Past Month Binge Drinking and Marijuana Use among Youths Aged 12 to 17, by Perceptions of Risk: 2006
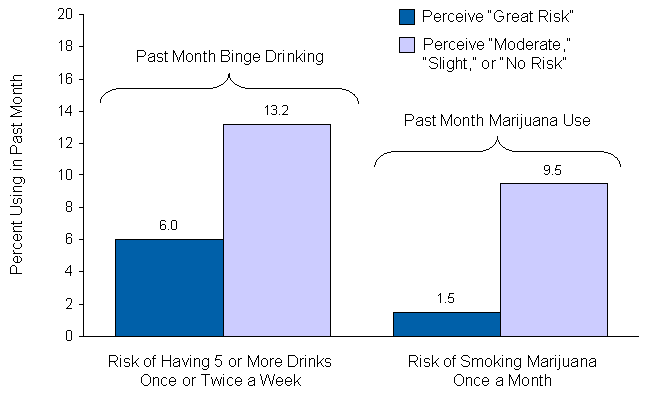
- Increases in the perceived risk of using a substance often are associated with decreases in the rate of use of that substance. Looking over the 5-year period, the proportion of youths aged 12 to 17 who reported perceiving great risk from smoking one or more packs of cigarettes per day increased from 63.1 percent in 2002 to 68.7 percent in 2006 (Figure 6.2). The rate of past month cigarette smoking among youths aged 12 to 17 dropped from 13.0 to 10.4 percent during the same period.
Below is a bar graph. Click here for the text describing this graph.
Figure 6.2 Perceived Great Risk of Cigarette and Alcohol Use among Youths Aged 12 to 17: 2002-2006
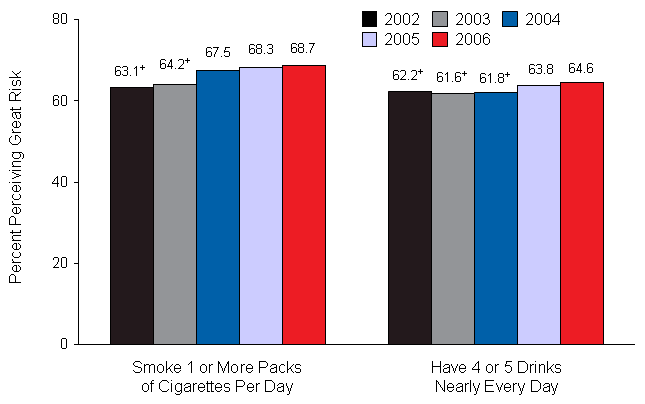
+Difference between this estimate and the 2006 estimate is statistically significant at the .05 level.
- The percentage of youths aged 12 to 17 indicating great risk in having four or five drinks nearly every day increased from 62.2 percent in 2002 to 64.6 percent in 2006 (Figure 6.2). However, the rates of past month heavy alcohol use among youths aged 12 to 17 were about the same in 2002 (2.5 percent) and 2006 (2.4 percent).
- The percentage of youths aged 12 to 17 perceiving great risk in having five or more drinks of an alcoholic beverage once or twice a week was stable between 2002 and 2006 (38.2 percent in 2002 and 39.4 percent in 2006) with the exception of a significant increase between 2004 (38.1 percent) and 2006. The rates of past month binge alcohol use among youths remained unchanged (10.7 percent in 2002 and 10.3 percent in 2006).
- The percentage of youths aged 12 to 17 indicating great risk in smoking marijuana once a month increased from 32.4 percent in 2002 to 34.7 percent in 2006 (Figure 6.3). The percentage of youths aged 12 to 17 perceiving great risk in smoking marijuana once or twice a week also increased from 51.5 percent in 2002 to 54.2 percent in 2006.
Below is a bar graph. Click here for the text describing this graph.
Figure 6.3 Perceived Great Risk of Marijuana Use among Youths Aged 12 to 17: 2002-2006
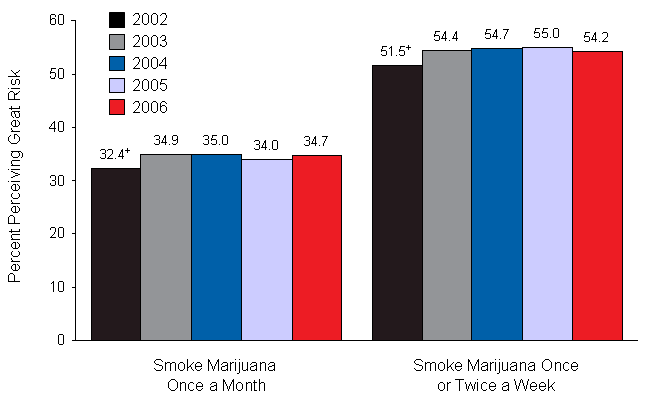
+Difference between this estimate and the 2006 estimate is statistically significant at the .05 level.
- Coincident with the increase in the perceived great risk of marijuana use, the prevalence of lifetime, past year, and past month marijuana use among youths aged 12 to 17 decreased between 2002 and 2006. During this period, lifetime use of marijuana dropped from 20.6 to 17.3 percent, past year use declined from 15.8 to 13.2 percent, and past month use fell from 8.2 to 6.7 percent.
- Between 2002 and 2006, the percentage of youths aged 12 to 17 perceiving great risk declined for the following substance use patterns: trying heroin once or twice (from 58.5 to 57.2 percent), using heroin once or twice a week (from 82.5 to 81.2 percent), using cocaine once a month (from 50.5 to 49.0 percent), and using LSD once or twice a week (from 76.2 to 74.7 percent) (Figure 6.4). Over the same period, however, the percentage of youths aged 12 to 17 indicating great risk for using cocaine once or twice a week (79.8 percent in 2002 and 79.2 percent in 2006) and for trying LSD once or twice (52.6 percent in 2002 and 51.6 percent in 2006) remained unchanged.
Below is a line graph. Click here for the text describing this graph.
Figure 6.4 Perceived Great Risk of Use of Selected Illicit Drugs among Youths Aged 12 to 17: 2002-2006
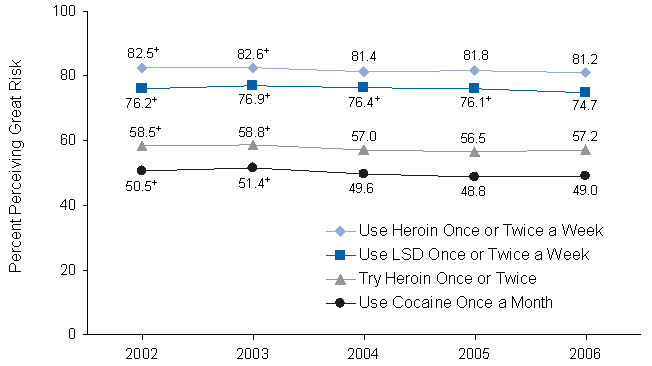
+Difference between this estimate and the 2006 estimate is statistically significant at the .05 level.
Perceived Availability
- In 2006, about half (50.1 percent) of the youths aged 12 to 17 reported that it would be "fairly easy" or "very easy" for them to obtain marijuana if they wanted some (Figure 6.5). Around one quarter reported it would be easy to get cocaine (25.9 percent). One in seven (14.0 percent) indicated that LSD would be "fairly" or "very" easily available, and 14.4 percent reported so for heroin. Between 2002 and 2006, the perceived availability of substances decreased among youths aged 12 to 17 for marijuana (from 55.0 to 50.1 percent), LSD (from 19.4 to 14.0 percent), and heroin (from 15.8 to 14.4 percent).
Below is a bar graph. Click here for the text describing this graph.
Figure 6.5 Perceived Availability of Selected Illicit Drugs among Youths Aged 12 to 17: 2002-2006
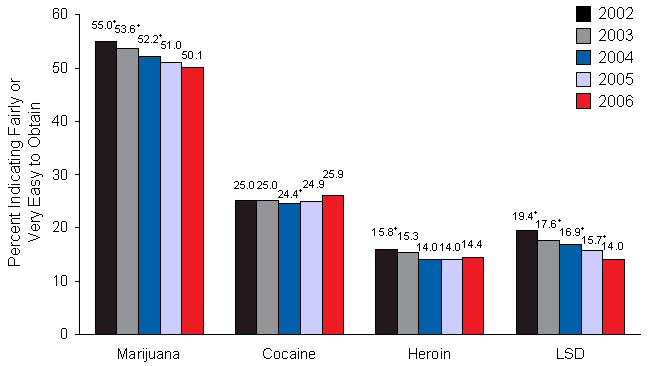
+Difference between this estimate and the 2006 estimate is statistically significant at the .05 level.
- The percentage of youths who reported that illicit drugs would be easy to obtain was associated with age, with perceived availability increasing with age. For example, in 2006, 20.7 percent of those aged 12 or 13 said it would be fairly or very easy to obtain marijuana compared with 52.9 percent of those aged 14 or 15 and 73.9 percent of those aged 16 or 17.
- In 2006, 15.3 percent of youths aged 12 to 17 indicated that they had been approached by someone selling drugs in the past month. This was down from the 16.7 percent reported in 2002.
Perceived Parental Disapproval of Substance Use
- Most youths aged 12 to 17 believed their parents would "strongly disapprove" of their using substances. In 2006, 91.4 percent of youths aged 12 to 17 reported that their parents would strongly disapprove of their smoking one or more packs of cigarettes per day. A majority of youths (90.4 percent) reported that their parents would strongly disapprove of their trying marijuana or hashish once or twice, and 89.6 percent reported their parents would strongly disapprove of their having one or two drinks of an alcoholic beverage nearly every day. These rates of perceived parental disapproval in using substances in 2006 were similar to those reported in 2005.
- Youths aged 12 to 17 who believed their parents would strongly disapprove of their using a particular substance were less likely to use that substance than were youths who believed their parents would somewhat disapprove or neither approve nor disapprove. For example, in 2006, past month cigarette use was reported by 7.4 percent of youths who perceived strong parental disapproval of their smoking one or more packs of cigarettes per day compared with 42.1 percent of youths who believed their parents would not strongly disapprove. Current marijuana use also was much less prevalent among youths who perceived strong parental disapproval for trying marijuana or hashish once or twice than among those who did not (4.6 vs. 26.5 percent, respectively).
Feelings about Peer Substance Use
- A majority of youths aged 12 to 17 reported that they disapprove of their peers using substances. In 2006, 89.1 percent of youths "strongly" or "somewhat" disapproved of their peers smoking one or more packs of cigarettes per day, and 82.8 percent strongly or somewhat disapproved of peers using marijuana or hashish once a month or more. These rates were higher than those reported in 2005 (88.2 and 81.4 percent, respectively). In 2006, 81.7 percent of youths strongly or somewhat disapproved of peers trying marijuana or hashish once or twice, and 86.4 percent of youths strongly or somewhat disapproved of peers having one or two drinks of an alcoholic beverage nearly every day. Both estimates were similar to those reported in 2005 (80.8 and 85.6 percent, respectively).
- The percentage strongly or somewhat disapproving of peers' substance use generally decreased with age. In 2006, disapproval of peers using marijuana once a month or more, for example, was reported by 92.4 percent of youths aged 12 or 13, 82.5 percent of those aged 14 or 15, and 74.0 percent of those aged 16 or 17 (Figure 6.6).
Below is a bar graph. Click here for the text describing this graph.
Figure 6.6 Disapproval of Peer Substance Use among Youths Aged 12 to 17, by Age: 2006
- In 2006, past month marijuana use was reported by 2.5 percent of youths aged 12 to 17 who strongly or somewhat disapproved of their peers using marijuana once a month or more compared with 26.4 percent of youths who reported that they neither approve nor disapprove of such behavior from their peers.
Fighting and Delinquent Behavior
- In 2006, 22.6 percent of youths aged 12 to 17 reported that, in the past year, they had gotten into a serious fight at school or at work; 17.0 percent had taken part in a group-against-group fight; 3.2 percent had carried a handgun at least once; 3.3 percent had sold illegal drugs; 4.8 percent had, at least once, stolen or tried to steal something worth more than $50 (increased from 4.2 percent in 2005); and 7.9 percent had, in at least one instance, attacked others with the intent to harm or seriously hurt them.
- Youths aged 12 to 17 who had engaged in fighting or other delinquent behaviors were more likely than other youths to have used illicit drugs in the lifetime, past year, and past month. For example, in 2006, past month illicit drug use was reported by 17.3 percent of youths who had gotten into serious fights at school or work in the past year compared with 7.6 percent of those who had not engaged in fighting, and by 37.2 percent of those who had stolen or tried to steal something worth over $50 in the past year compared with 8.4 percent of those who had not engaged in such theft (Figure 6.7).
Below is a bar graph. Click here for the text describing this graph.
Figure 6.7 Past Month Illicit Drug Use among Youths Aged 12 to 17, by Participation in Fighting and Delinquent Behavior in the Past Year: 2006
Religious Beliefs and Participation in Activities
- In 2006, 31.7 percent of youths aged 12 to 17 reported that they had attended religious services 25 or more times in the past year; 77.0 percent expressed agreement with the statement that religious beliefs are a very important part of their lives; 68.3 percent agreed with the statement that religious beliefs influence how they make decisions in life; and 35.1 percent agreed with the statement that it is important for their friends to share their religious beliefs. Findings for these measures remained unchanged from 2005 to 2006. Lifetime, past year, and past month use of illicit drugs, cigarettes, and alcohol (including binge alcohol) were lower among youths who agreed with these statements than among those who disagreed. For example, past month illicit drug use was reported by 7.6 percent of those who agreed that religious beliefs are a very important part of life compared with 17.1 percent of those who disagreed with that statement.
Exposure to Substance Use Prevention Messages and Programs
- In 2006, approximately one in eight youths aged 12 to 17 (11.4 percent) reported that they had participated in drug, tobacco, or alcohol prevention programs outside of school in the past year. However, the prevalence of past month use of illicit drugs, marijuana, cigarettes, or binge alcohol was not significantly lower among those who participated in these prevention programs outside of school (8.9 percent, 6.1 percent, 8.9 percent, and 9.8 percent, respectively) than among those who did not (9.9 percent, 6.7 percent, 10.6 percent, and 10.4 percent, respectively).
- In 2006, 79.4 percent of youths aged 12 to 17 reported having seen or heard drug or alcohol prevention messages from sources outside of school, which declined from 81.1 percent in 2005. The prevalence of past month use of illicit drugs, marijuana, cigarettes, or binge alcohol was lower among those who reported having such exposure (9.2 percent, 6.2 percent, 9.5 percent, and 10.0 percent, respectively) than among those who reported having no such exposure (12.0 percent, 8.5 percent, 13.8 percent, and 11.5 percent, respectively).
- In 2006, 59.8 percent of youths aged 12 to 17 reported that they had talked at least once in the past year with at least one of their parents about the dangers of drug, tobacco, or alcohol use, which was the same as in 2005. Among youths who reported having had such conversations with their parents, rates of past month use of illicit drugs, cigarettes, and alcohol (including binge alcohol) were lower than among youths who did not talk about substance abuse. That is, past month use of illicit drugs was reported by 8.6 percent of youths who had talked with their parents about drug, tobacco, or alcohol use compared with 11.3 percent of those who had not. Past month cigarette use was lower among youths who had talked with their parents (9.4 percent) than among those who had not (11.8 percent), and past month binge drinking was lower among youths who had talked with their parents (9.3 percent) than among those who had not (11.8 percent).
Parental Involvement
- Youths aged 12 to 17 were asked a number of questions related to the extent of support, oversight, and control that they perceived their parents exercised over them in the year prior to the survey. In 2006, among youths aged 12 to 17 enrolled in school in the past year, 79.5 percent reported that in the past year their parents always or sometimes checked on whether or not they had completed their homework, 79.8 percent reported that their parents always or sometimes provided help with their homework, and 69.1 percent reported that their parents limited the amount of time that they spent out with friends on school nights. Also in 2006, among youths aged 12 to 17, 87.5 percent reported that in the past year their parents made them always or sometimes do chores around the house, 39.4 percent reported that their parents limited the amount of time that they watched television, and 86.6 percent reported that their parents always or sometimes let them know that they had done a good job. All of these percentages were similar to those reported in 2005. In addition, among youths aged 12 to 17 in 2006, 86.0 percent reported that their parents let them know they were proud of something they had done, which increased from the 84.8 percent in 2005.
- In 2006, past month use of illicit drugs, cigarettes, and alcohol (including binge alcohol) was lower among youths aged 12 to 17 who reported that their parents always or sometimes engaged in monitoring behaviors than among youths whose parents "seldom" or "never" engaged in such behaviors. For example, the rate of past month use of any illicit drug was 8.1 percent for youths whose parents always or sometimes helped with homework compared with 16.9 percent among youths who indicated that their parents seldom or never helped. Rates for current cigarette smoking were 8.9 and 17.4 percent for the two groups of youths, respectively, and rates of past month binge alcohol use were 9.0 versus 17.0 percent correspondingly.
|
| |
| |
|
|
2006
National Survey on Drug Use & Health: National Results
|
7. Substance Dependence, Abuse, and Treatment
The National Survey on Drug Use and Health (NSDUH) includes a series of questions to assess the prevalence of substance use disorders (i.e., dependence on or abuse of a substance) in the past 12 months. Substances include alcohol and illicit drugs, such as marijuana, cocaine, heroin, hallucinogens, and inhalants, and the nonmedical use of prescription-type psychotherapeutic drugs. These questions are used to classify persons as dependent on or abusing specific substances based on criteria specified in the Diagnostic and Statistical Manual of Mental Disorders, 4th edition (DSM-IV) (American Psychiatric Association [APA], 1994).
The questions related to dependence ask about health and emotional problems associated with substance use, unsuccessful attempts to cut down on use, tolerance, withdrawal, reducing other activities to use substances, spending a lot of time engaging in activities related to substance use, or using the substance in greater quantities or for a longer time than intended. The questions on abuse ask about problems at work, home, and school; problems with family or friends; physical danger; and trouble with the law due to substance use. Dependence is considered to be a more severe substance use problem than abuse because it involves the psychological and physiological effects of tolerance and withdrawal. Although individuals may meet the criteria specified for both dependence and abuse, persons meeting the criteria for both are classified as having dependence, but not abuse. Persons defined with abuse in this report do not meet the criteria for dependence.
This chapter provides estimates of the prevalence and patterns of substance use disorders occurring in the past year from the 2006 NSDUH and compares these estimates against the results from the 2002, 2003, 2004, and 2005 surveys. It also provides estimates of the prevalence and patterns of the receipt of treatment in the past year for problems related to substance use. This chapter concludes with a discussion of the need for and the receipt of treatment at specialty facilities for problems associated with substance use.
7.1 Substance Dependence or Abuse
- In 2006, an estimated 22.6 million persons aged 12 or older were classified with substance dependence or abuse in the past year (9.2 percent of the population aged 12 or older) (Figure 7.1). Of these, 3.2 million were classified with dependence on or abuse of both alcohol and illicit drugs, 3.8 million were dependent on or abused illicit drugs but not alcohol, and 15.6 million were dependent on or abused alcohol but not illicit drugs.
Below is a bar graph. Click here for the text describing this graph.
Figure 7.1 Substance Dependence or Abuse in the Past Year among Persons Aged 12 or Older: 2002-2006
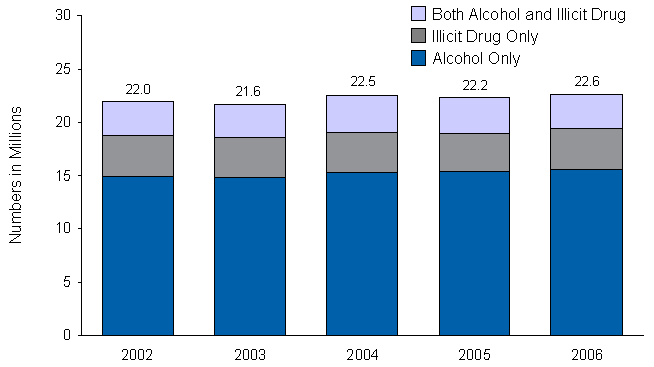
+Difference between this estimate and the 2006 estimate is statistically significant at the .05 level.
- The number of persons with substance dependence or abuse was stable between 2002 and 2006 (22.0 million in 2002, 21.6 million in 2003, 22.5 million in 2004, 22.2 million in 2005, and 22.6 million in 2006). In 2006, 18.8 million persons aged 12 or older were classified with dependence on or abuse of alcohol (7.6 percent), which has remained unchanged since 2002.
- The specific illicit drugs that had the highest levels of past year dependence or abuse in 2006 were marijuana, followed by cocaine and pain relievers. Of the 7.0 million persons aged 12 or older classified with dependence on or abuse of illicit drugs in 2006, 4.2 million were dependent on or abused marijuana and hashish (representing 1.7 percent of the total population aged 12 or older, and 59.4 percent of all those classified with illicit drug dependence or abuse), 1.7 million persons were classified with dependence on or abuse of cocaine, and 1.6 million persons were classified with dependence on or abuse of pain relievers (Figure 7.2).
- Between 2002 and 2006, the percentages of persons with dependence on or abuse of illicit drugs (3.0 percent in 2002, 2.9 percent in 2003, 3.0 percent in 2004, 2.8 percent in 2005, and 2.9 percent in 2006) and with dependence on or abuse of alcohol (7.7 percent in 2002, 7.5 percent in 2003, 7.8 percent in 2004, 7.7 percent in 2005, and 7.6 percent in 2006) remained unchanged.
Below is a bar graph. Click here for the text describing this graph.
Figure 7.2 Dependence on or Abuse of Specific Illicit Drugs in the Past Year among Persons Aged 12 or Older: 2006
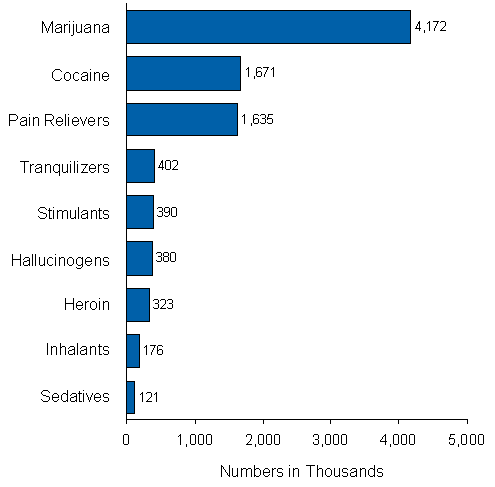
Age at First Use
- In 2006, among adults aged 18 or older who first tried marijuana at age 14 or younger, 12.9 percent were classified with illicit drug dependence or abuse, higher than the 2.2 percent of adults who had first used marijuana at age 18 or older.
- Among adults, age at first use of alcohol was associated with dependence on or abuse of alcohol in 2006. For example, among adults aged 18 or older who first tried alcohol at age 14 or younger, 17.5 percent were classified with alcohol dependence or abuse compared with only 3.7 percent of adults who had first used alcohol at age 18 or older. Adults aged 21 or older who had first used alcohol before age 21 were more likely than adults who had their first drink at age 21 or older to be classified with alcohol dependence or abuse (9.6 vs. 2.4 percent) (Figure 7.3).
Below is a bar graph. Click here for the text describing this graph.
Figure 7.3 Alcohol Dependence or Abuse in the Past Year among Adults Aged 21 or Older, by Age at First Use of Alcohol: 2006
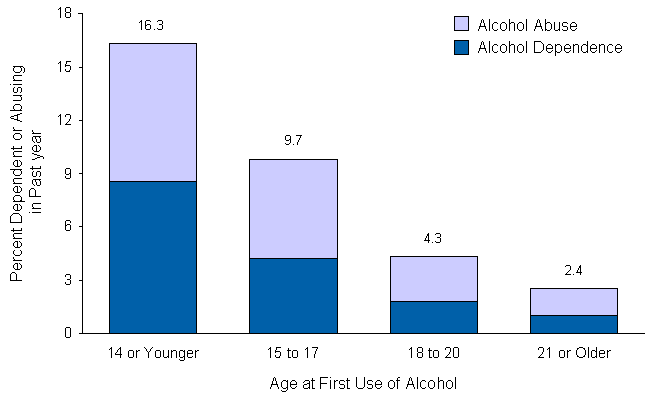
Age
- Rates of substance dependence or abuse were associated with age. In 2006, the rate of substance dependence or abuse among adults aged 18 to 25 (21.3 percent) was higher than that among youths aged 12 to 17 (8.0 percent) and among adults aged 26 or older (7.2 percent).
- In 2006, among persons with substance dependence or abuse, the proportion with dependence on or abuse of illicit drugs also was associated with age: 57.4 percent of youths aged 12 to 17, 36.9 percent of young adults aged 18 to 25, and 24.1 percent of adults aged 26 or older.
- The rate of substance dependence or abuse among youths aged 12 to 17 remained the same between 2005 and 2006 (8.0 percent in each year). The rate of alcohol dependence or abuse among youths aged 12 to 17 remained stable during the same period (5.5 percent in 2005 vs. 5.4 percent in 2006).
Gender
- As was the case from 2002 through 2005, the rate of substance dependence or abuse for males aged 12 or older in 2006 was about twice as high as the rate for females (12.3 vs. 6.3 percent) (Figure 7.4). Among youths aged 12 to 17, however, the rate of substance dependence or abuse among males was similar to the rate among females (8.0 vs. 8.1 percent).
Below is a bar graph. Click here for the text describing this graph.
Figure 7.4 Substance Dependence or Abuse in the Past Year, by Age and Gender: 2006
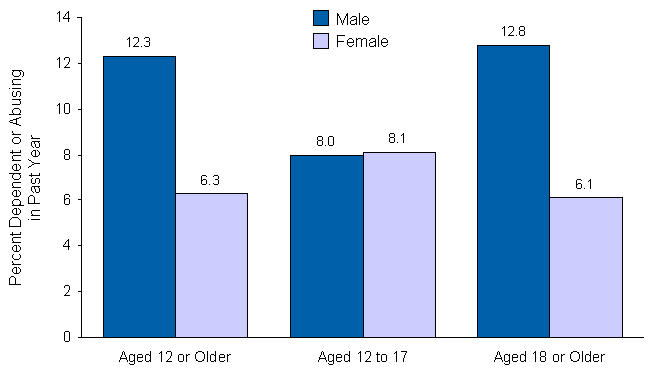
- The rate of illicit drug dependence or abuse among males aged 12 or older was similar between 2005 and 2006 (3.5 percent in 2005 and 3.7 percent in 2006). The rate for females remained unchanged during the same period (2.1 percent in 2005 vs. 2.0 percent in 2006).
Race/Ethnicity
- In 2006, among persons aged 12 or older, the rate of substance dependence or abuse was the lowest among Asians (4.3 percent). Racial/ethnic groups reporting similar rates included Native Hawaiians or Other Pacific Islanders (12.0 percent), persons reporting two or more races (12.0 percent), Hispanics (10.0 percent), whites (9.2 percent), and blacks (9.0 percent). The rate among American Indians or Alaska Natives (19.0 percent) was higher than the rates among Hispanics, whites, and blacks. These rates were all similar to the rates reported in 2005.
Education/Employment
- Rates of substance dependence or abuse were associated with level of education in 2006. Among adults aged 18 or older, those who graduated from a college or university had a lower rate of dependence or abuse (7.3 percent) than those who graduated from high school (9.4 percent), those who did not graduate from high school (10.3 percent), and those with some college (10.8 percent).
- Rates of substance dependence or abuse were associated with current employment status in 2006. A higher percentage of unemployed adults aged 18 or older were classified with dependence or abuse (19.5 percent) than were full-time employed adults (10.4 percent) or part-time employed adults (10.2 percent).
- Most adults aged 18 or older with substance dependence or abuse were employed full time in 2006. Of the 20.6 million adults classified with dependence or abuse, 12.7 million (61.5 percent) were employed full time.
Criminal Justice Populations
- In 2006, adults aged 18 or older who were on parole or a supervised release from jail during the past year had higher rates of dependence on or abuse of a substance (36.9 percent) than their counterparts who were not on parole or supervised release during the past year (9.1 percent).
- In 2006, probation status was associated with substance dependence or abuse. The rate of substance dependence or abuse was 39.7 percent among adults who were on probation during the past year, which was significantly higher than the rate among adults who were not on probation during the past year (8.7 percent).
Geographic Area
- In 2006, rates of substance dependence or abuse for persons aged 12 or older showed evidence of differences by region, with the West (10.2 percent) and Midwest (10.0 percent) having higher rates than the South (8.5 percent) and Northeast (8.4 percent). However, rates for substance dependence or abuse among persons aged 12 or older in 2006 did not vary significantly by county type (9.4 percent in large metropolitan counties, 9.0 percent in small metropolitan counties, and 8.9 percent in nonmetropolitan counties).
7.2 Past Year Treatment for a Substance Use Problem
Estimates described in this section refer to treatment received to reduce or stop illicit drug or alcohol use, or for medical problems associated with the use of illicit drugs or alcohol. This includes treatment received in the past year at any location, such as a hospital (inpatient), rehabilitation facility (outpatient or inpatient), mental health center, emergency room, private doctor's office, prison or jail, or a self-help group, such as Alcoholics Anonymous or Narcotics Anonymous. Persons could report receiving treatment at more than one location. Note that the definition of treatment in this section is different from the definition of specialty treatment described in Section 7.3. Specialty treatment only includes treatment at a hospital (inpatient), a rehabilitation facility (inpatient or outpatient), or a mental health center.
Individuals who reported receiving substance use treatment but were missing information on whether the treatment was specifically for alcohol use or illicit drug use were not counted in estimates of illicit drug use treatment or in estimates of alcohol use treatment; however, they were counted in estimates for "drug or alcohol use" treatment.
- In 2006, 4.0 million persons aged 12 or older (1.6 percent of the population) received some kind of treatment for a problem related to the use of alcohol or illicit drugs. Of these, 1.6 million received treatment for the use of both alcohol and illicit drugs, 0.9 million received treatment for the use of illicit drugs but not alcohol, and 1.2 million received treatment for the use of alcohol but not illicit drugs. (Note that estimates by substance do not add to the total number of persons receiving treatment because the total includes persons who reported receiving treatment but did not report for which substance the treatment was received.)
- The number and the percentage of the population receiving substance use treatment within the past year remained stable between 2005 and 2006 (3.9 million, 1.6 percent in 2005; 4.0 million, 1.6 percent in 2006).
- In 2006, among the 4.0 million persons aged 12 or older who received treatment for alcohol or illicit drug use in the past year, 2.2 million persons received treatment at a self-help group, and 1.6 million received treatment at a rehabilitation facility as an outpatient (Figure 7.5). There were 1.1 million persons who received treatment at a mental health center as an outpatient, 934,000 persons who received treatment at a rehabilitation facility as an inpatient, 816,000 at a hospital as an inpatient, 610,000 at a private doctor's office, 420,000 at a prison or jail, and 397,000 at an emergency room. None of these estimates changed significantly between 2005 and 2006.
- In 2006, during their most recent treatment in the past year, 2.5 million persons reported receiving treatment for alcohol use, and 1.2 million persons reported receiving treatment for marijuana use (Figure 7.6). Accordingly, estimates on receiving treatment for the use of other drugs were 928,000 persons for cocaine, 547,000 for pain relievers, 535,000 for stimulants, 466,000 for heroin, and 442,000 for hallucinogens. (Note that respondents could indicate that they received treatment for more than one substance during their most recent treatment.)
Below is a bar graph. Click here for the text describing this graph.
Figure 7.5 Locations Where Past Year Substance Use Treatment Was Received among Persons Aged 12 or Older: 2006
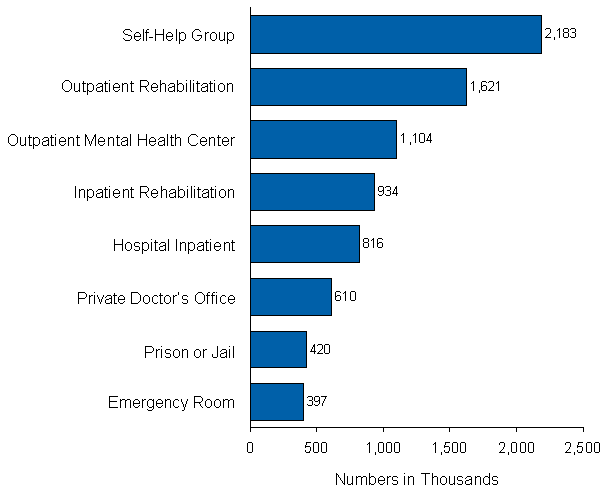
Below is a bar graph. Click here for the text describing this graph.
Figure 7.6 Substances for Which Most Recent Treatment Was Received in the Past Year among Persons Aged 12 or Older: 2006
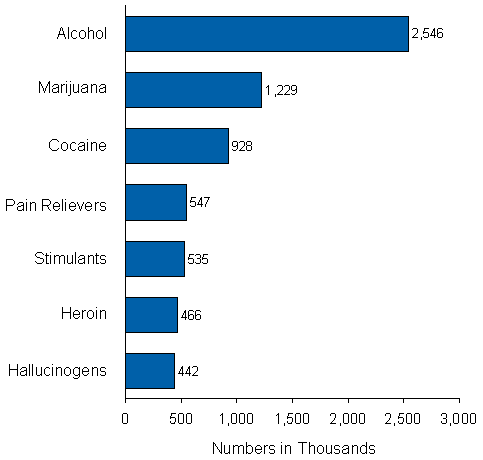
7.3 Need and Receipt of Specialty Treatment
This section discusses the need for and receipt of treatment for a substance use problem at a "specialty" treatment facility. Specialty treatment is defined as treatment received at any of the following types of facilities: hospitals (inpatient only), drug or alcohol rehabilitation facilities (inpatient or outpatient), or mental health centers. It does not include treatment at an emergency room, private doctor's office, self-help group, prison or jail, or hospital as an outpatient. An individual is defined as needing treatment for an alcohol or drug use problem if he or she met the DSM-IV (APA, 1994) diagnostic criteria for dependence on or abuse of alcohol or illicit drugs in the past 12 months or if he or she received specialty treatment for alcohol use or illicit drug use in the past 12 months.
In this section, an individual needing treatment for an illicit drug use problem is defined as receiving treatment for his or her drug use problem only if he or she reported receiving specialty treatment for drug use in the past year. Thus, an individual who needed treatment for illicit drug use but only received specialty treatment for alcohol use in the past year or who received treatment for illicit drug use only at a facility not classified as a specialty facility was not counted as receiving treatment for drug use. Similarly, an individual who needed treatment for an alcohol use problem was only counted as receiving alcohol use treatment if the treatment was received for alcohol use at a specialty treatment facility. Individuals who reported receiving specialty substance use treatment but were missing information on whether the treatment was specifically for alcohol use or drug use were not counted in estimates of specialty drug use treatment or in estimates of specialty alcohol use treatment; however, they were counted in estimates for "drug or alcohol use" treatment.
In addition to questions about symptoms of substance use problems that are used to classify respondents' need for treatment based on DSM-IV criteria, NSDUH includes questions asking respondents about their perceived need for treatment (i.e., whether they felt they needed treatment or counseling for illicit drug use or alcohol use). In this report, estimates for perceived need for treatment are only discussed for persons who were classified as needing treatment (based on DSM-IV criteria) but did not receive treatment at a specialty facility. Similarly, estimates for whether a person made an effort to get treatment are only discussed for persons who felt the need for treatment.
Illicit Drug or Alcohol Use Treatment and Treatment Need
- In 2006, 23.6 million persons aged 12 or older needed treatment for an illicit drug or alcohol use problem (9.6 percent of the persons aged 12 or older). Of these, 2.5 million (1.0 percent of persons aged 12 or older and 10.8 percent of those who needed treatment) received treatment at a specialty facility. Thus, 21.1 million persons (8.6 percent of the population aged 12 or older) needed treatment for an illicit drug or alcohol use problem but did not receive treatment at a specialty substance abuse facility in the past year. These estimates are similar to the estimates for 2005.
- Of the 2.5 million people aged 12 or older who received specialty substance use treatment in 2006, 731,000 persons received treatment for both alcohol and illicit drug use, 826,000 received treatment for alcohol use only, and 845,000 received treatment for illicit drug use only.
- In 2006, among persons who received their last or current substance use treatment at a specialty facility in the past year, 42.1 percent reported using their "own savings or earnings" as a source of payment for their most recent specialty treatment. In addition, 37.4 percent reported using private health insurance, 26.9 percent reported using Medicaid, 21.4 percent reported using public assistance other than Medicaid, 20.9 percent reported using Medicare, and 16.3 percent reported relying on family members. (Note that persons could report more than one source of payment.)
- In 2006, more than half of the 2.5 million persons aged 12 or older who received specialty substance use treatment in the past year also received treatment at a self-help group (1.5 million persons). In addition, among those who received specialty substance use treatment, 377,000 received treatment at a prison or jail and 369,000 received treatment at an emergency room. The number who received treatment at a private doctor's office in 2006 was higher than the number in 2005 (422,000 vs. 254,000, respectively).
- Of the 21.1 million persons in 2006 who were classified as needing substance use treatment but not receiving treatment at a specialty facility in the past year, 940,000 persons (4.5 percent) reported that they perceived a need for treatment for their illicit drug or alcohol use problem (Figure 7.7). Of these 940,000 persons who felt they needed treatment but did not receive treatment in 2006, 314,000 (33.5 percent) reported that they made an effort to get treatment, and 625,000 (66.5 percent) reported making no effort to get treatment. These estimates were similar to the numbers reported in 2005 (296,000 and 865,000, respectively).
Below is a pie chart. Click here for the text describing this graph.
Figure 7.7 Past Year Perceived Need for and Effort Made to Receive Specialty Treatment among Persons Aged 12 or Older Needing But Not Receiving Treatment for Illicit Drug or Alcohol Use: 2006
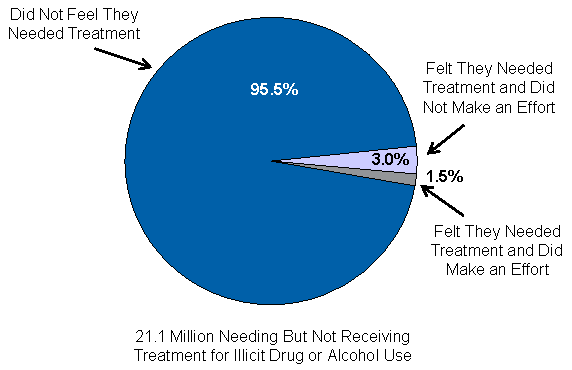
- The number and the percentage of youths aged 12 to 17 who needed treatment for an illicit drug or alcohol use problem remained unchanged between 2005 and 2006 (2.1 million youths, and 8.3 percent of the population in 2005; 2.1 million youths, and 8.2 percent of the population in 2006). Of the 2.1 million persons in 2006, only 181,000 youths received treatment at a specialty facility (about 8.7 percent of youths who needed treatment), leaving 1.9 million youths who needed treatment for a substance use problem but did not receive it at a specialty facility.
- Based on 2004-2006 combined data, the five most often reported reasons for not receiving illicit drug or alcohol use treatment among persons who needed but did not receive treatment at a specialty facility and perceived a need for treatment included (a) not ready to stop using (37.2 percent), (b) no health coverage and could not afford cost (30.9 percent), (c) possible negative effect on job (13.3 percent), (d) not knowing where to go for treatment (12.6 percent), and (e) concern that might cause neighbors/community to have negative opinion (11.0 percent).
- Based on 2004-2006 combined data, among persons who needed but did not receive illicit drug or alcohol use treatment, made an effort to receive treatment, and felt a need for treatment, the four most often reported reasons for not receiving treatment were (a) no health insurance and could not afford cost (36.3 percent), (b) not ready to stop using (23.9 percent), (c) able to handle the problem without treatment (11.2 percent), and (d) no transportation/inconvenient (10.0 percent) (Figure 7.8).
Below is a bar graph. Click here for the text describing this graph.
Figure 7.8 Reasons for Not Receiving Substance Use Treatment among Persons Aged 12 or Older Who Needed and Made an Effort to Get Treatment But Did Not Receive Treatment and Felt They Needed Treatment: 2004-2006 Combined
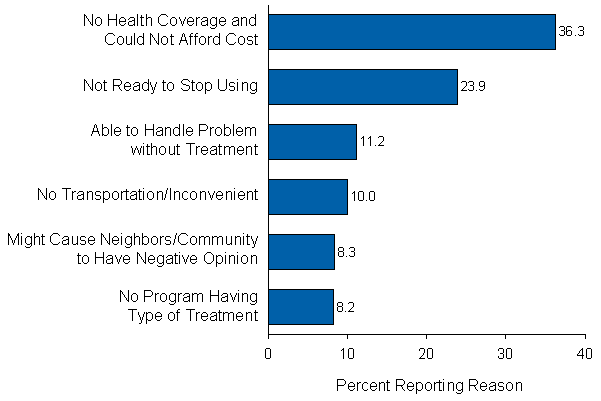
Illicit Drug Use Treatment and Treatment Need
- In 2006, the number of persons aged 12 or older needing treatment for an illicit drug use problem was 7.8 million (3.2 percent of the total population). Of these, 1.6 million (0.6 percent of the total population and 20.3 percent of the persons who needed treatment) received treatment at a specialty facility for an illicit drug use problem in the past year. Thus, there were 6.2 million persons (2.5 percent of the total population) who needed treatment but did not receive treatment at a specialty facility for an illicit drug use problem in 2006.
- The number of persons needing treatment for illicit drug use in 2006 (7.8 million) was similar to the number needing treatment in 2002 (7.7 million), 2003 (7.3 million), 2004 (8.1 million), and 2005 (7.6 million). Also, the number of persons needing but not receiving specialty treatment in the past year for an illicit drug use problem in 2006 (6.2 million) was similar to the estimates in 2002 (6.3 million), 2003 (6.2 million), 2004 (6.6 million), and 2005 (6.3 million).
- Of the 6.2 million people who needed but did not receive specialty treatment for illicit drug use in 2006, 496,000 (8.0 percent) reported that they perceived a need for treatment for their illicit drug use problem. Of the 496,000 persons who felt a need for treatment in 2006 (similar to the number reported in 2005, 601,000 persons), 182,000 (36.6 percent) reported that they made an effort and 314,000 (63.4 percent) reported making no effort to get treatment.
- Among youths aged 12 to 17, there were 1.2 million (4.8 percent) who needed treatment for an illicit drug use problem in 2006. Of this group, only 136,000 received treatment at a specialty facility (11.2 percent of youths aged 12 to 17 who needed treatment), leaving 1.1 million youths who needed treatment but did not receive it at a specialty facility.
- Among people who needed but did not receive illicit drug use treatment and felt they needed treatment (based on 2004-2006 combined data), the six most often reported reasons for not receiving treatment were (a) no health coverage and could not afford cost (35.1 percent), (b) not ready to stop using (31.8 percent), (c) not knowing where to go for treatment (14.7 percent), (d) concern that getting treatment might cause neighbors/community to have negative opinion (13.5 percent), (e) possible negative effect on job (12.8 percent), and (f) being able to handle the problem without treatment (12.4 percent).
Alcohol Use Treatment and Treatment Need
- In 2006, the number of persons aged 12 or older needing treatment for an alcohol use problem was 19.5 million (7.9 percent of the population aged 12 or older). Of these, 1.6 million (0.6 percent of the total population and 8.0 percent of the people who needed treatment for an alcohol use problem) received alcohol use treatment at a specialty facility. Thus, there were 18.0 million people who needed treatment but did not receive treatment at a specialty facility for an alcohol use problem. Between 2005 and 2006, there were no statistically significant changes in the number and the percentage of persons needing, receiving, or needing but not receiving treatment for an alcohol use problem.
- Among the 18.0 million people who needed but did not receive treatment for an alcohol use problem in 2006, there were 541,000 (3.0 percent) who felt they needed treatment for their alcohol use problem. Of these, 220,000 (40.6 percent) made an effort but were unable to get treatment, and 321,000 (59.4 percent) did not make an effort to get treatment.
- In 2006, there were 1.4 million youths (5.5 percent) aged 12 to 17 who needed treatment for an alcohol use problem. Of this group, only 101,000 received treatment at a specialty facility (0.4 percent of all youths and 7.2 percent of youths who needed treatment), leaving 1.3 million youths who needed but did not receive treatment.
|
| |
| |
|
|
2006
National Survey on Drug Use & Health: National Results
|
8. Prevalence and Treatment of Mental Health Problems
This chapter presents findings on mental health problems in the United States, including the prevalence and treatment of serious psychological distress (SPD) and major depressive episode (MDE) and the association of these problems with substance use and substance dependence or abuse (substance use disorder).
SPD is an overall indicator of past year psychological distress that is derived from the K6 scale administered to adults aged 18 or older in the National Survey on Drug Use and Health (NSDUH). Numerical scores derived from responses to these six questions range from 0 to 24. For this report, a score of 13 or higher is considered SPD. It is notable that the data related to SPD in 2005 and 2006 are not directly comparable with data from earlier years because of study design changes. Further information on the measurement of SPD, the scoring algorithm, and the study design changes is provided in Section B.4.4 of Appendix B.
A module of questions designed to obtain measures of lifetime and past year prevalence of MDE, severity of the MDE as measured by role impairments, and treatment for depression was administered to adults aged 18 or older and youths aged 12 to 17 in 2006. Some questions in the adolescent depression module were modified slightly to make them more appropriate for youths. Given these differences, adult and youth depression estimates are presented separately in this chapter.
MDE is defined as a period of at least 2 weeks when a person experienced a depressed mood or loss of interest or pleasure in daily activities and had symptoms that met the criteria for major depressive disorder as described in the 4th edition of the Diagnostic and Statistical Manual of Mental Disorders (DSM-IV) (American Psychiatric Association [APA], 1994). It should be noted that no exclusions were made for MDE caused by medical illness, bereavement, or substance use disorders.
Although there is substantial overlap in the populations classified with SPD and MDE, there are important distinctions between the definitions of the two. Meeting the criteria for SPD indicates that the respondent endorsed having symptoms at a level known to be indicative of having a mental disorder (i.e., any disorder such as an anxiety or mood disorder). Meeting the criteria for MDE indicates that the respondent had the specific physical and emotional symptom profile indicative of MDE in the past 12 months. MDE is known to be a fairly common disorder that often has a significant impact on a person’s work, home, and social life. The questions used to measure MDE and role impairment and the scoring algorithm for these responses are included in Section B.4.5 of Appendix B.
This chapter also presents data on the receipt of treatment for any type of mental health problem among adults and adolescents. This may be different from the treatment received specifically for MDE, and it is possible for a respondent to have indicated receipt of treatment for depression without having indicated that he or she received treatment for any mental health problems. Different questions and definitions of treatment and counseling are used for adults and youths. Treatment for adults aged 18 or older is defined as the receipt of treatment or counseling for any problem with emotions, "nerves," or mental health in the past year in any inpatient or outpatient setting or the use of prescription medication for a mental or emotional condition. Treatment for youths aged 12 to 17 is defined as receiving treatment or counseling for problems with behaviors or emotions from specific mental health or other health professionals in school, home, or from other outpatient or inpatient settings within the past year. Both the youth and the adult questions specifically exclude treatment for problems with substance use, which is asked about elsewhere in the interview. Estimates of unmet need for treatment are reported separately for all adults and for adults with SPD. Unmet need is defined using a question in the 2006 NSDUH that asks whether the respondent perceived a need for mental health treatment or counseling at any time in the 12 months prior to the interview but did not receive it.
It is important to note that because the survey covers only the U.S. civilian, noninstitutionalized population, persons who were residing in long-term psychiatric or other institutions at the time of the interview were not included in the NSDUH sample.
8.1 Adults Aged 18 or Older
Prevalence of Serious Psychological Distress
- In 2006, there were an estimated 24.9 million adults aged 18 or older in the United States with SPD in the past year. This represents 11.3 percent of all adults in this country, a rate equal the rate of SPD in 2005 (Figure 8.1).
Below is a bar graph. Click here for the text describing this graph.
Figure 8.1 Rates of Serious Psychological Distress in the Past Year among Adults Aged 18 or Older, by Age: 2005-2006
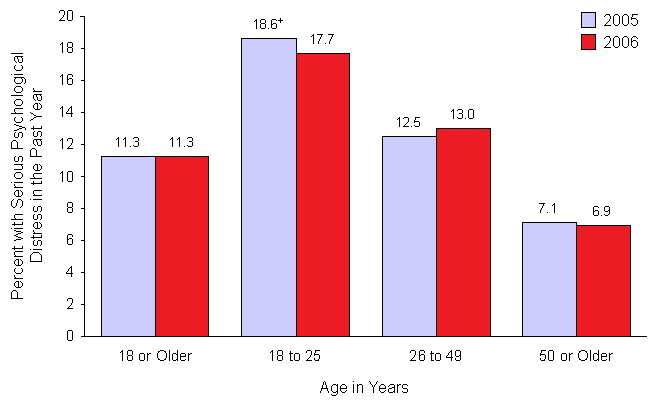
+Difference between this estimate and the 2006 estimate is statistically significant at the .05 level.
- Rates of SPD in 2006 were highest for adults aged 18 to 25 (17.7 percent) and lowest for adults aged 50 or older (6.9 percent).
- The prevalence of SPD among women aged 18 or older (13.7 percent) was significantly higher than that among men in that age group (8.7 percent).
- In 2006, rates of past year SPD were lowest among Asians at 7.8 percent. Rates for other racial/ethnic groups were 10.5 percent among blacks, 10.8 percent among Hispanics and among Native Hawaiians and Other Pacific Islanders, 11.4 percent among whites, 25.3 percent among persons reporting two or more races, and 25.9 percent among American Indians or Alaska Natives.
Treatment among Adults with Serious Psychological Distress
- Among the 24.9 million adults aged 18 or older with SPD in 2006, 10.9 million (44.0 percent) received treatment for a mental health problem in the past year. Among adults with SPD, 39.0 percent received a prescription medication, 27.2 percent received outpatient treatment, and 3.9 percent received inpatient treatment for a mental health problem in the past year. Respondents could report more than one type of treatment.
Serious Psychological Distress and Substance Use and Dependence or Abuse
- Past year illicit drug use was higher among adults aged 18 or older with SPD (27.2 percent) than among adults without SPD (12.3 percent). Similarly, the rate of past month cigarette use was higher among adults with SPD (44.2 percent) than among adults without SPD (24.5 percent).
- Among adults aged 18 or older with SPD, the rate of binge alcohol use (drinking five or more drinks on the same occasion on at least 1 day in the past 30 days) was 28.8 percent, higher than the 23.9 percent among adults who did not meet the criteria for SPD. Similarly, the rate of heavy alcohol use (drinking five or more drinks on the same occasion [i.e., at the same time or within a couple of hours of each other] on each of 5 or more days in the past 30 days) among adults with SPD in the past year was higher (9.4 percent) than the rate reported among adults without SPD in the past year (7.2 percent).
- SPD in the past year was associated with past year substance dependence or abuse in 2006. Among adults aged 18 or older with SPD, 22.3 percent were dependent on or abused illicit drugs or alcohol. The rate among adults without SPD was 7.7 percent.
Treatment among Adults with Co-Occurring Serious Psychological Distress and Substance Use Disorders
- Among the 5.6 million adults aged 18 or older with both SPD and substance dependence or abuse (i.e., a substance use disorder) in 2006, half (50.8 percent) received mental health treatment or substance use treatment at a specialty facility; 8.4 percent received both treatment for mental health problems and specialty substance use treatment, 39.6 percent received only treatment for mental health problems, and 2.8 percent received only specialty substance use treatment (Figure 8.2).
Below is a pie chart. Click here for the text describing this graph.
Figure 8.2 Past Year Treatment among Adults Aged 18 or Older with Both Serious Psychological Distress and a Substance Use Disorder: 2006
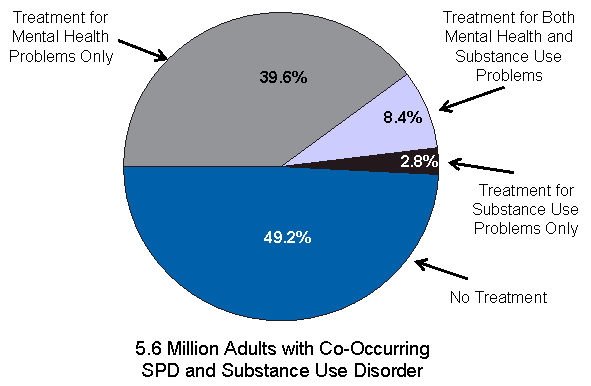
Prevalence of Major Depressive Episode
- In 2006, 15.8 million adults (7.2 percent of persons aged 18 or older) had at least one MDE in the past year. After a statistically significant decline in the rate of past year MDE between 2004 and 2005 (8.0 and 7.3 percent, respectively), the rate of past year MDE was stable between 2005 and 2006.
- In 2006, an estimated 30.4 million adults had at least one MDE in their lifetime (13.9 percent of persons aged 18 or older). The rate was 15.0 percent among persons aged 18 to 25, 15.9 percent among persons aged 26 to 49, and 11.1 percent among persons aged 50 or older.
- The past year prevalence of MDE in 2006 was lowest for those aged 50 or older (5.1 percent). The rates were similar among persons aged 18 to 25 (9.0 percent) and those aged 26 to 49 (8.5 percent).
- The past year prevalence of MDE was higher among adult females than among adult males (9.0 vs. 5.3 percent). Among women aged 18 to 25, the past year MDE rate decreased from 12.9 percent in 2005 to 11.7 percent in 2006 (Figure 8.3).
Below is a bar graph. Click here for the text describing this graph.
Figure 8.3 Major Depressive Episode in the Past Year among Adults Aged 18 or Older, by Age and Gender: 2005-2006
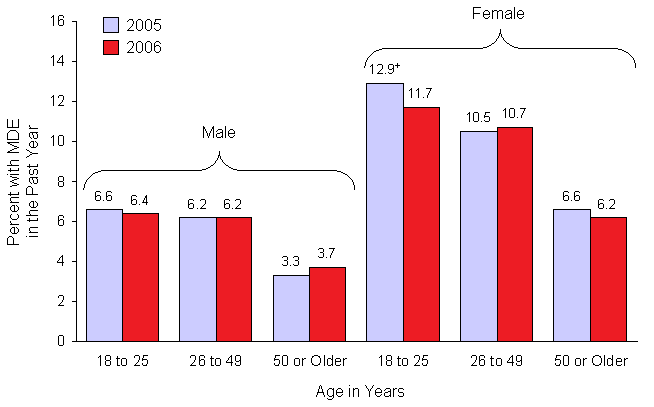
+Difference between this estimate and the 2006 estimate is statistically significant at the .05 level.
- Among adults aged 18 or older, past year prevalence of MDE varied by race/ethnicity in 2006. The rate of MDE was lowest among Asians (3.0 percent), while rates for other groups were 14.3 percent among persons reporting two or more races, 12.1 percent among American Indians or Alaska Natives, 7.8 percent among whites, 6.3 percent among blacks, 5.8 percent among Native Hawaiians or Other Pacific Islanders, and 5.4 percent among Hispanics.
- Among adults aged 18 or older, past year prevalence of MDE was higher among unemployed persons (11.6 percent) than among persons employed full time (6.6 percent), persons employed part time (7.6 percent), and persons not in the labor force (7.8 percent).
Major Depressive Episode and Substance Use and Dependence or Abuse
- In 2006, adults aged 18 or older with MDE in the past year were more likely than those without MDE to have used an illicit drug in the past year (27.7 vs. 12.9 percent) (Figure 8.4). A similar pattern was observed for specific types of past year illicit drug use, such as marijuana, cocaine, hallucinogens, inhalants, and the nonmedical use of prescription-type psychotherapeutics.
Below is a bar graph. Click here for the text describing this graph.
Figure 8.4 Substance Use among Adults Aged 18 or Older, by Major Depressive Episode in the Past Year: 2006
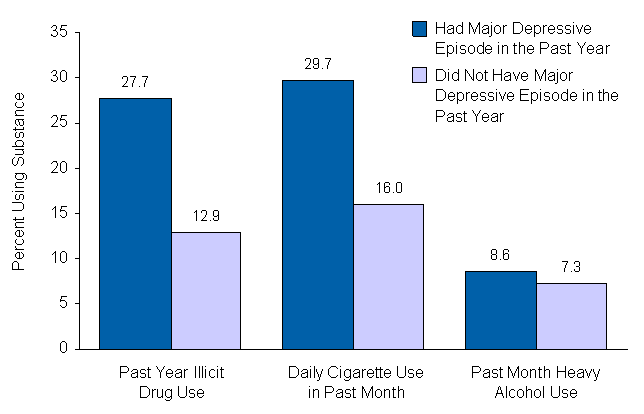
- Past month heavy alcohol use also was associated with MDE in the past year in 2006. Among adults aged 18 or older with MDE in the past year, 8.6 percent were heavy alcohol users, higher than the 7.3 percent of adults without MDE in the past year. Similarly, among adults with MDE, the rate of daily cigarette use in the past month was 29.7 percent, while the rate was 16.0 percent among adults without MDE.
- Having MDE in the past year was associated with past year substance dependence or abuse. Among adults aged 18 or older who had MDE in 2006, 24.3 percent were dependent on or abused alcohol or illicit drugs, while among adults without MDE only 8.1 percent were dependent on or abused alcohol or illicit drugs. Adults with MDE were more likely than those without MDE to be dependent on or abuse illicit drugs (9.4 vs. 2.1 percent) and alcohol (19.3 vs. 7.0 percent).
Treatment for Major Depressive Episode
- Among adults aged 18 or older who had MDE in the past year, 69.1 percent received treatment (i.e., saw or talked to a medical doctor or other professional or used prescription medication) for depression in the same time period. The treatment rate in 2006 was higher than in 2005 (65.6 percent), particularly for persons 50 years or older (85.4 vs. 78.2 percent).
- In 2006, women who had MDE in the past year were more likely than men to receive treatment for depression in the past year (73.7 vs. 60.8 percent).
- Among adults aged 18 or older with MDE in the past year, approximately half of those with no insurance (49.6 percent) received treatment for depression in the past year compared with higher rates for those with insurance: 71.1 percent of adults with private insurance, 79.9 percent of adults covered by Medicaid or CHIP, and 86.8 percent of adults with other health insurance (including Medicare, CHAMPUS, TRICARE, CHAMPVA, VA, and other sources of health care or insurance) (Figure 8.5).
Below is a bar graph. Click here for the text describing this graph.
Figure 8.5 Past Year Treatment for Major Depressive Episode (MDE) among Adults Aged 18 or Older with MDE in the Past Year, by Insurance Status: 2006
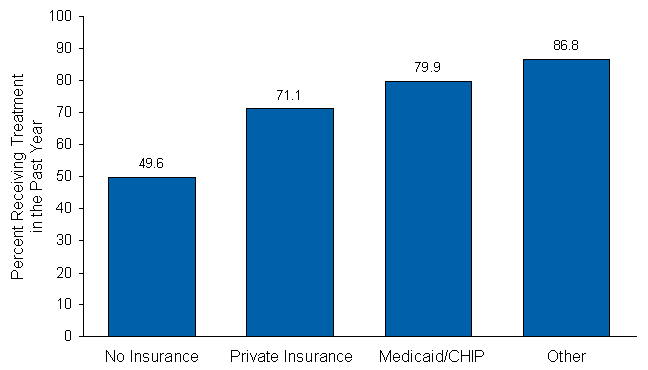
Treatment for Mental Health Problems and Unmet Treatment Need among Adults
- In 2006, 28.3 million adults (12.9 percent of the population 18 years or older) received treatment for mental health problems during the past 12 months (Figure 8.6). This is similar to the rate in 2005 (13.0 percent).
Below is a bar graph. Click here for the text describing this graph.
Figure 8.6 Past Year Treatment for Mental Health Problems among Adults Aged 18 or Older, by Type of Treatment: 2002-2006
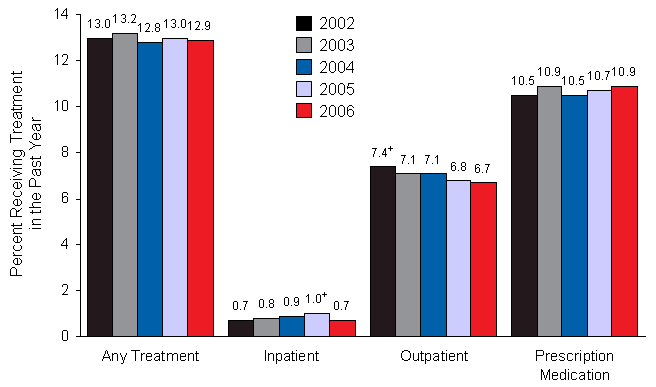
+Difference between this estimate and the 2006 estimate is statistically significant at the .05 level.
- In 2006, the treatment type most often reported by adults aged 18 or older was prescription medication (10.9 percent), followed by outpatient treatment (6.7 percent). Rates of prescription medication and outpatient treatment in 2006 were similar to the rates in 2005 (10.7 and 6.8 percent, respectively). Respondents could report more than one type of treatment.
- About 1.6 million adults (0.7 percent of the population 18 years or older) received inpatient care for mental health problems during the past year. This was significantly lower than the rate of inpatient treatment in 2005 (1.0 percent, or 2.1 million adults). Declines were particularly prominent among women (1.1 percent in 2005 vs. 0.7 percent in 2006), persons living in the South (1.3 vs. 0.7 percent), persons with a family income of less than $20,000 (2.7 vs. 1.9 percent), and persons receiving government assistance (3.3 vs. 2.2 percent).
- Rates of treatment for mental health problems varied by age for adults aged 18 or older: 10.8 percent for adults aged 18 to 25, 14.0 percent for adults aged 26 to 49, and 12.4 percent for adults aged 50 or older.
- Men were less likely than women to receive outpatient treatment (4.8 vs. 8.4 percent) and prescription medication (7.2 vs. 14.2 percent) for mental health problems in the past year. There was no significant gender difference in inpatient treatment (0.8 vs. 0.7 percent).
- Among racial/ethnic groups, the rates of treatment for adults aged 18 or older in 2006 were 21.6 percent for persons reporting two or more races, 15.2 percent for whites, 11.9 percent for American Indians or Alaska Natives, 7.4 percent for blacks, 7.0 percent for Native Hawaiians or Other Pacific Islanders, 7.0 percent for Hispanics, and 5.6 percent for Asians.
- In 2006, there were 10.5 million adults aged 18 or older (4.8 percent)
who reported an unmet need for treatment or counseling for mental health
problems in the past year. This included 4.8 million adults who did not
receive mental health treatment and 5.6 million adults who did receive some
type of treatment or counseling for a mental health problem in the past
year. That is, about 20 percent of the 23.8 million adults that received
treatment for a mental health problem in the past 12 months reported an
unmet need. (Unmet need among adults who received treatment may reflect
a delay in treatment or a perception of insufficient treatment.)
- Among the 4.8 million adults who reported an unmet need for treatment or counseling for mental health problems and did not receive treatment in the past year, several barriers to treatment were reported. These included an inability to afford treatment (41.5 percent), believing at the time that the problem could be handled without treatment (34.0 percent), not having the time to go for treatment (17.1 percent), and not knowing where to go for services (16.0 percent) (Figure 8.7).
Below is a bar graph. Click here for the text describing this graph.
Figure 8.7 Reasons for Not Receiving Mental Health Treatment in the Past Year among Adults Aged 18 or Older with an Unmet Need for Treatment Who Did Not Receive Treatment: 2006
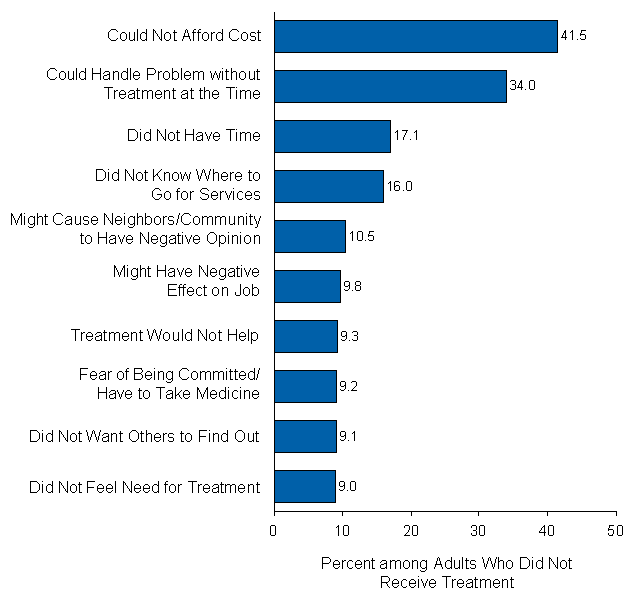
8.2 Youths Aged 12 to 17
Prevalence of Major Depressive Episode
- In 2006, there were 3.2 million youths (12.8 percent of the population aged 12 to 17) who reported at least one MDE in their lifetime and 2.0 million youths (7.9 percent) who had MDE during the past year. These rates are lower than 2005's estimates of 13.7 percent lifetime MDE and 8.8 percent past year MDE.
- Among youths aged 12 to 17, the past year prevalence of MDE ranged from 4.0 percent among 12 year olds to 11.1 percent among those aged 16 and 10.3 percent among those aged 17.
- The rate of MDE in the past year was lower for adolescent females in 2006 (11.8 percent) than in 2005 (13.3 percent). The rates for males were similar in 2006 and 2005 (4.2 and 4.5 percent, respectively).
- Among youths aged 12 to 17, 8.0 percent of Hispanics had MDE in the past year, similar to the rate for non-Hispanic youths (7.9 percent). Also, youths who reported two or more races had a lifetime MDE prevalence of 13.0 percent, while the rates for American Indians or Alaska Natives and whites were 9.3 and 8.1 percent, respectively.
Major Depressive Episode and Substance Use
- Among 12 to 17 year olds who had past year MDE, 34.6 percent had used illicit drugs during the same period (Figure 8.8). This was higher than the 18.2 percent of youths who did not have past year MDE who used illicit drugs during the past year. This pattern was similar for specific types of illicit drug use, including marijuana, cocaine, heroin, hallucinogens, inhalants, and the nonmedical use of prescription-type psychotherapeutics.
Below is a bar graph. Click here for the text describing this graph.
Figure 8.8 Substance Use among Youths Aged 12 to 17, by Major Depressive Episode in the Past Year: 2006
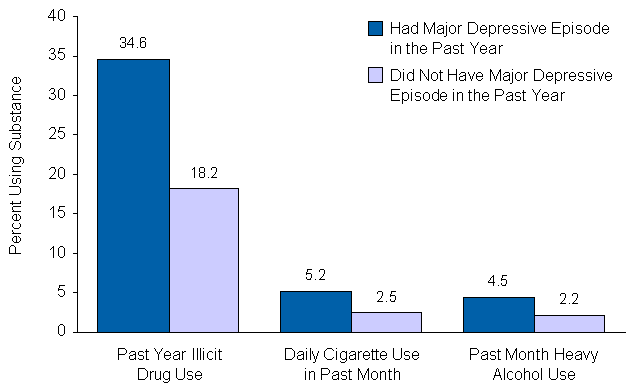
- In 2006, youths aged 12 to 17 who had MDE during the past year were more likely to report daily cigarette use in comparison with those who did not have MDE during the past year (5.2 vs. 2.5 percent). Similarly, youths who had past year MDE were more likely to report heavy use of alcohol than those who did not have MDE (4.5 vs. 2.2 percent).
- The occurrence of MDE in the past year among youths aged 12 to 17 was associated with a higher prevalence of illicit drug or alcohol dependence or abuse (18.8 percent). Among youths who did not report past year MDE, 7.1 percent had illicit drug or alcohol dependence or abuse during the same period.
Treatment for Major Depressive Episode
- In 2006, 38.9 percent of youths aged 12 to 17 with past year MDE received treatment for depression (saw or talked to a medical doctor or other professional or used prescription medication). Among youths with past year MDE, 23.9 percent saw or talked to a medical doctor or other professional only, 2.1 percent used prescription medication only, and 12.7 percent received treatment from both sources for depression in the past year.
Mental Health Treatment among Youths
- In 2006, there were 5.4 million youths (21.3 percent) who received treatment or counseling for emotional or behavior problems in the year prior to the interview (Figure 8.9). Adolescent females were more likely than adolescent males to report past year treatment for mental health problems (23.0 vs. 19.6 percent, respectively).
Below is a bar graph. Click here for the text describing this graph.
Figure 8.9 Past Year Treatment for Mental Health Problems among Youths Aged 12 to 17, by Gender: 2002-2006
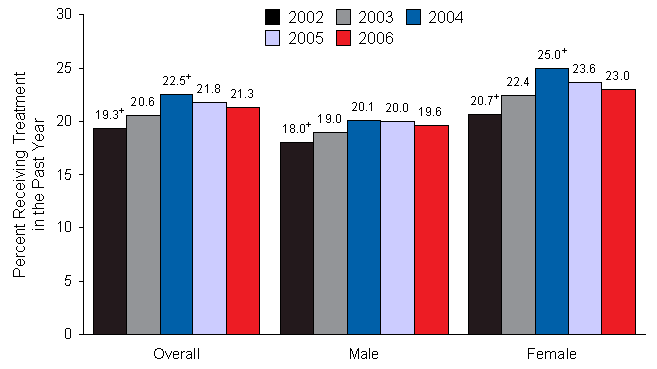
+Difference between this estimate and the 2006 estimate is statistically significant at the .05 level.
- The rate of illicit drug use in the past year was higher among youths aged 12 to 17 who received mental health treatment or counseling in the past year than among those who did not receive treatment or counseling (28.8 vs. 17.0 percent, respectively). This pattern also was observed for marijuana, cocaine, hallucinogens, inhalants, and the nonmedical use of prescription-type psychotherapeutics.
- Youths aged 12 to 17 who received mental health treatment or counseling in the past year were more likely to use alcohol in the past year than those who did not receive treatment or counseling (40.0 vs. 31.0 percent, respectively). Youths receiving mental health treatment or counseling in the past year also were more likely to have smoked cigarettes in the past year (25.2 vs. 14.7 percent).
- In 2006, 14.5 percent of youths aged 12 to 17 who received mental health treatment or counseling in the past year were dependent on or abused illicit drugs or alcohol in the past year, higher than the 6.3 percent who did not receive treatment or counseling.
|
| |
| |
|
|
2006
National Survey on Drug Use & Health: National Results
|
9. Discussion of Trends in Substance Use among Youths and Young Adults
This report presents findings from the 2006 National Survey on Drug Use and Health (NSDUH). Conducted since 1971 and previously named the National Household Survey on Drug Abuse (NHSDA), the survey underwent several methodological improvements in 2002 that have affected prevalence estimates. As a result, the 2002 through 2006 estimates are not comparable with estimates from 2001 and earlier surveys. Therefore, the primary focus of the report is on comparisons of measures of substance use and mental health problems across subgroups of the U.S. population in 2006 and changes between 2005 and 2006, as well as between 2002 and 2006. This chapter provides an additional discussion of the findings concerning a topic of great interest—trends in substance use among youths and young adults.
An important step in the analysis and interpretation of NSDUH or any other survey data is to compare the results with those from other data sources. This can be difficult sometimes because the other surveys typically have different purposes, definitions, and designs. Research has established that surveys of substance use and other sensitive topics often produce inconsistent results because of different methods used. Thus, it is important to understand that conflicting results often reflect differing methodologies, not incorrect results. Despite this limitation, comparisons can be very useful. Consistency across surveys can provide confirmation or support for conclusions about trends and patterns of use, and inconsistent results can point to areas for further study. Further discussion of this issue is included in Appendix D, along with descriptions of methods and results from other sources of substance use and mental health data.
Unfortunately, few additional data sources are available at this time to compare with NSDUH results. One established source is Monitoring the Future (MTF), a study sponsored by the National Institute on Drug Abuse (NIDA). MTF surveys students in the 8th, 10th, and 12th grades in classrooms during the spring of each year, and it also collects data by mail from a subsample of adults who had participated earlier in the study as 12th graders (Johnston, O'Malley, Bachman, & Schulenberg, 2007a, 2007b). Historically, NSDUH rates of substance use among youths have been lower than those of MTF, and occasionally the two surveys have shown different trends over a short time period. Nevertheless, the two sources have shown very similar long-term trends in prevalence. NSDUH and MTF rates of substance use generally have been similar among young adults, and the two sources also have shown similar trends.
A comparison of NSDUH and MTF estimates for 2002 to 2006 is shown in Table s 9.1 and 9.2 at the end of this chapter for several substances that are defined similarly in the two surveys. MTF data on 8th and 10th graders combined give the closest match on age to estimates for NSDUH youths aged 12 to 17, while MTF follow-up data on persons aged 19 to 24 provide the closest match on age to estimates for NSDUH young adults aged 18 to 25. The NSDUH results are remarkably consistent with MTF trends for both youths and young adults, as discussed below.
Both surveys generally show decreases between 2002 and 2006 in the percentages of youths who used marijuana, Ecstasy, LSD, alcohol, and cigarettes in the lifetime, past year, and past month (Table 9.1). Exceptions were for LSD in the past month for MTF and cigarettes in the past year for MTF. For the latter, an estimate is not available. Both surveys show no difference in the rates of past month cocaine and inhalant use among youths between 2002 and 2006, although NSDUH does show a significant decrease from 2003 to 2006 in past month cocaine use. Declines between 2002 and 2006 in past year and lifetime cocaine use are evident in NSDUH data, but not in MTF. The consistency between NSDUH and MTF trend data is found not only in terms of the specific drugs showing decreases, but also in terms of the magnitude of the decreases. Despite the higher levels of prevalence estimated from MTF, the two surveys show very similar rates of change in prevalence, especially for the three substances used most commonly by youths: alcohol, cigarettes, and marijuana. Between 2002 and 2006, the rate of current alcohol use among youths declined 6 percent according to NSDUH and 7 percent according to MTF. Current cigarette use prevalence rates in 2006 were 20 percent lower in NSDUH and 18 percent lower in MTF compared with 2002 rates. For past month marijuana use, the NSDUH decline was 18 percent, and the MTF decline was 21 percent.
Data on young adults also show similar trends in the two surveys, although not as consistent as for the youth data (Table 9.2). Potential reasons for differences are the relatively smaller MTF sample size for young adults and possible bias in the MTF sample due to noncoverage of school dropouts and a low overall response rate, considering nonresponse by schools, by students in the 12th grade survey, and in the follow-up mail survey. Both surveys show declines from 2002 to 2006 in past year and past month cigarette and marijuana use among young adults. However, the NSDUH rates of decline in current cigarette and marijuana use were less than for youths and were less in the NSDUH data than in MTF. Past month marijuana prevalence declined 6 percent according to NSDUH and 14 percent according to MTF. For past month cigarette use, declines were 6 percent in NSDUH and 15 percent in MTF. Both surveys show stable trends in past month cocaine, LSD, and inhalant use among young adults, although in NSDUH there was a small but statistically significant increase for current alcohol use, from 60.5 percent in 2002 to 61.9 percent in 2006.
Considering past year prevalence data, both NSDUH and MTF generally show large decreases in the use of Ecstasy and LSD between 2002 and 2004, then a leveling in 2005 (Figure 9.1). These trends occurred for both youths and young adults. The 2006 data from both surveys show a continued leveling among youths, but suggest a possible resurgence in the use of these two hallucinogens among young adults. Although the only statistically significant change between 2005 and 2006 was for past year Ecstasy use among young adults in NSDUH (from 3.1 to 3.8 percent), rates were higher in 2006 than in 2005 among young adults for past month Ecstasy use in NSDUH, past month and past year Ecstasy use in MTF, past year LSD use in NSDUH, and past month and past year LSD use in MTF.
Because of the lack of statistical significance for most of these results, they should not be considered conclusive. Nevertheless, the consistency in the results from these two independent surveys serves as evidence of a possible increase in hallucinogen use. This resurgence is further supported in NSDUH by a statistically significant increase between 2005 and 2006 in past year initiation of Ecstasy use. The number of initiates increased from 615,000 in 2005 to 860,000 in 2006. There was no increase in LSD initiation.
Below is a line graph. Click here for the text describing this graph.
Figure 9.1 Past Year Ecstasy and LSD Use among Young Adults in NSDUH and MTF: 2002-2006
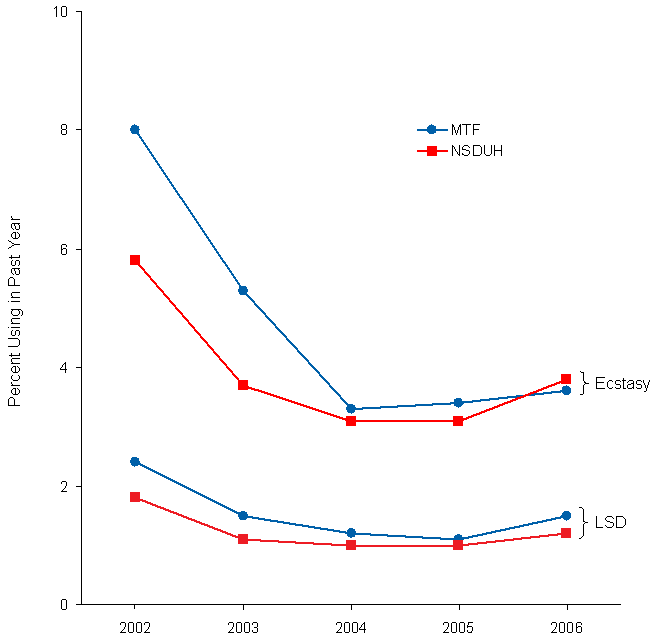
NOTE: Young adults are defined as respondents aged 18 to 25 for NSDUH and aged 19 to 24 for MTF.
Table 9.1 Comparison of NSDUH and MTF Prevalence Estimates among Youths: 2002-2006
Substance/
Time Period |
NSDUH |
MTF |
| Ages 12-17 |
8th and 10th Grades |
| 2002 |
2003 |
2004 |
2005 |
2006 |
2002 |
2003 |
2004 |
2005 |
2006 |
-- Not available.
NOTE: MTF data for 8th and 10th graders are simple averages of estimates for those two grades. Data for 8th and 10th graders are reported in Johnston, O'Malley, Bachman, and Schulenberg (2007b). Design effects used for variance estimation are reported in Johnston, O'Malley, Bachman, and Schulenberg (2006c).
a Difference between this estimate and the 2006 estimate is statistically significant at the .05 level.
Sources: SAMHSA, Office of Applied Studies, National Survey on Drug Use and Health, 2002, 2003, 2004, 2005, and 2006. University of Michigan, The Monitoring the Future Study, 2002, 2003, 2004, 2005, and 2006. |
| Marijuana |
|
|
|
|
|
|
|
|
|
|
| Lifetime |
17.4 |
17.3 |
23.8 |
| Past Year |
13.3 |
13.2 |
19.7 |
19.4 |
18.5 |
| Past Month |
6.8 |
6.7 |
11.2 |
10.9 |
10.4 |
| Cocaine |
|
|
|
|
|
|
|
|
|
|
| Lifetime |
2.6 |
2.4 |
2.3 |
2.2 |
4.9 |
4.4 |
4.4 |
4.5 |
4.1 |
| Past Year |
1.8 |
1.6 |
1.7 |
1.6 |
3.2 |
2.8 |
2.9 |
2.9 |
2.6 |
| Past Month |
0.6 |
0.5 |
0.6 |
0.4 |
1.4 |
1.1 |
1.3 |
1.3 |
1.3 |
| Ecstasy |
|
|
|
|
|
|
|
|
|
|
| Lifetime |
2.1 |
1.6 |
1.9 |
3.6 |
3.4 |
3.5 |
| Past Year |
1.3 |
1.2 |
1.0 |
1.2 |
2.6 |
2.1 |
2.2 |
2.1 |
| Past Month |
0.4 |
0.3 |
0.3 |
0.3 |
0.9 |
0.8 |
0.8 |
1.0 |
| LSD |
|
|
|
|
|
|
|
|
|
|
| Lifetime |
0.9 |
2.3 |
2.2 |
2.2 |
| Past Year |
0.6 |
0.4 |
1.5 |
1.4 |
1.4 |
1.3 |
| Past Month |
0.2 |
0.2 |
0.1 |
0.1 |
0.7 |
0.6 |
0.6 |
0.6 |
0.6 |
| Inhalants |
|
|
|
|
|
|
|
|
|
|
| Lifetime |
10.5 |
10.7 |
10.5 |
10.1 |
14.4 |
14.3 |
14.9 |
15.1 |
14.7 |
| Past Year |
4.4 |
4.5 |
4.6 |
4.5 |
4.4 |
7.1 |
7.8 |
7.8 |
7.8 |
| Past Month |
1.2 |
1.3 |
1.2 |
1.2 |
1.3 |
3.1 |
3.2 |
3.5 |
3.2 |
3.2 |
| Alcohol |
|
|
|
|
|
|
|
|
|
|
| Lifetime |
40.6 |
40.4 |
52.1 |
51.0 |
| Past Year |
33.9 |
33.3 |
32.9 |
45.3 |
44.7 |
| Past Month |
16.5 |
16.6 |
26.9 |
25.2 |
25.5 |
| Cigarettes |
|
|
|
|
|
|
|
|
|
|
| Lifetime |
26.7 |
25.8 |
30.4 |
| Past Year |
17.3 |
17.0 |
-- |
-- |
-- |
-- |
-- |
| Past Month |
10.8 |
10.4 |
12.6 |
12.1 |
11.6 |
Table 9.2 Comparison of NSDUH and MTF Prevalence Estimates among Young Adults: 2002-2006
Substance/
Time Period |
NSDUH |
MTF |
| Ages 18-25 |
Ages 19-24 |
| 2002 |
2003 |
2004 |
2005 |
2006 |
2002 |
2003 |
2004 |
2005 |
2006 |
-- Not available.
NOTE: MTF data for persons aged 19 to 24 are simple averages of modal age groups 19-20, 21-22, and 23-24 as reported in Johnston, O'Malley, and Bachman (2003c) and Johnston, O'Malley, Bachman, and Schulenberg (2004a, 2005a, 2006b, 2007a).
NOTE: For the 19 to 24 age group in the MTF data, significance tests were performed assuming independent samples across years. Although appropriate for comparisons of 2003 and 2005 estimates with 2006 estimates, this assumption results in conservative tests for comparisons of 2002 and 2004 estimates with 2006 estimates because it does not take into account covariances that are associated with repeated observations from the longitudinal samples. Estimates of covariances were not available.
a Difference between this estimate and the 2006 estimate is statistically significant at the .05 level.
Sources: SAMHSA, Office of Applied Studies, National Survey on Drug Use and Health, 2002, 2003, 2004, 2005, and 2006. University of Michigan, The Monitoring the Future Study, 2002, 2003, 2004, 2005, and 2006. |
| Marijuana |
|
|
|
|
|
|
|
|
|
|
| Lifetime |
53.8 |
52.8 |
52.4 |
52.4 |
56.1 |
55.6 |
54.4 |
53.8 |
| Past Year |
28.5 |
27.8 |
28.0 |
28.0 |
33.0 |
31.6 |
31.4 |
30.9 |
| Past Month |
17.0 |
16.1 |
16.6 |
16.3 |
18.2 |
17.0 |
17.0 |
| Cocaine |
|
|
|
|
|
|
|
|
|
|
| Lifetime |
15.4 |
15.0 |
15.2 |
15.1 |
15.7 |
12.9 |
14.5 |
14.3 |
12.6 |
13.6 |
| Past Year |
6.7 |
6.6 |
6.6 |
6.9 |
6.9 |
6.5 |
7.3 |
7.8 |
6.9 |
7.0 |
| Past Month |
2.0 |
2.2 |
2.1 |
2.6 |
2.2 |
2.5 |
2.6 |
2.4 |
2.1 |
2.4 |
| Ecstasy |
|
|
|
|
|
|
|
|
|
|
| Lifetime |
13.8 |
13.7 |
13.4 |
12.4 |
11.5 |
| Past Year |
3.7 |
3.8 |
3.3 |
3.4 |
3.6 |
| Past Month |
1.1 |
0.8 |
1.0 |
1.0 |
0.8 |
0.6 |
0.9 |
| LSD |
|
|
|
|
|
|
|
|
|
|
| Lifetime |
8.9 |
7.9 |
6.7 |
| Past Year |
1.1 |
1.0 |
1.0 |
1.2 |
1.5 |
1.2 |
1.1 |
1.5 |
| Past Month |
0.1 |
0.2 |
0.3 |
0.2 |
0.2 |
0.4 |
0.2 |
0.2 |
0.2 |
0.3 |
| Inhalants |
|
|
|
|
|
|
|
|
|
|
| Lifetime |
13.3 |
12.5 |
10.6 |
9.3 |
9.7 |
| Past Year |
2.1 |
2.1 |
1.8 |
2.2 |
1.5 |
2.3 |
1.6 |
1.8 |
| Past Month |
0.5 |
0.4 |
0.4 |
0.5 |
0.4 |
0.8 |
0.3 |
0.4 |
0.3 |
0.4 |
| Alcohol |
|
|
|
|
|
|
|
|
|
|
| Lifetime |
86.7 |
87.1 |
86.2 |
85.7 |
86.5 |
88.4 |
87.6 |
87.2 |
87.1 |
87.0 |
| Past Year |
77.9 |
78.1 |
78.0 |
77.9 |
78.8 |
83.9 |
82.3 |
83.1 |
82.8 |
83.2 |
| Past Month |
61.4 |
60.9 |
61.9 |
67.7 |
66.3 |
67.3 |
66.8 |
67.0 |
| Cigarettes |
|
|
|
|
|
|
|
|
|
|
| Lifetime |
67.3 |
66.6 |
-- |
-- |
-- |
-- |
-- |
| Past Year |
47.6 |
47.5 |
47.2 |
47.0 |
37.1 |
| Past Month |
39.5 |
39.0 |
38.4 |
28.7 |
26.7 |
End Notes
1 RTI International is a trade name of Research Triangle Institute.


|

This page has been accessed
410964
times since 9/5/07.
This page was last updated on May 5, 2008.
|