Department of Health and Human Services
Centers for Disease Control and Prevention
|
|
||||||||||||||||
|
|
|
|
|
|||||||||||||
|
|
Control and Prevention Division of Cancer Prevention and Control 4770 Buford Hwy, NE MS K-64 Atlanta, GA 30341-3717 Call: 1 (800) CDC-INFO TTY: 1 (888) 232-6348 FAX: (770) 488-4760 E-mail: cdcinfo@cdc.gov Submit a Question Online |
|
|
|
Ovarian Cancer: Compare by StateRelated Information: Compare by Race and Ethnicity In the following maps, information from all the U.S. states are divided into groups based on the rates at which women developed or died from ovarian cancer in 2004, the most recent year for which statistics are available. Incidence Rates by StateIncidence refers to the number of women who get a disease each year. In the United States, the number of women who get ovarian cancer varies from state to state. The map below shows the incidence of ovarian cancer by state in 2004. Ovarian Cancer 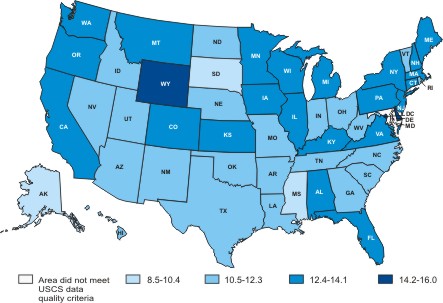 The states with ovarian cancer incidence rates in the first interval (8.5 to 10.4 per 100,000) include Alaska, Mississippi, and South Dakota. The states with incidence rates in the second interval (10.5 to 12.3 per 100,000) include Arizona, Arkansas, Georgia, Hawaii, Idaho, Indiana, Louisiana, Missouri, Nebraska, Nevada, New Mexico, North Carolina, North Dakota, Ohio, Oklahoma, Rhode Island, South Carolina, Tennessee, Texas, Utah, Vermont, and West Virginia. The states with incidence rates in the third interval (12.4 to 14.1 per 100,000) include Alabama, California, Colorado, Connecticut, Florida, Illinois, Iowa, Kansas, Kentucky, Maine, Massachusetts, Michigan, Minnesota, Montana, New Hampshire, New Jersey, New York, Oregon, Pennsylvania, Virginia, Washington, and Wisconsin. The incidence rates for Delaware, the District of Columbia, and Wyoming are in the fourth interval (14.2 to 16.0 per 100,000). Maryland did not meet United States Cancer Statistics: 2004 Incidence andMortality publication criteria. *Rates are per 100,000 and are age-adjusted to the 2000 U.S. standard population. Mortality Rates by StateMortality refers to the number of women who die from a disease each year. In the United States, the number of women who die from ovarian cancer varies from state to state. The following map shows the ovarian cancer mortality rates by state in 2004. Ovarian Cancer 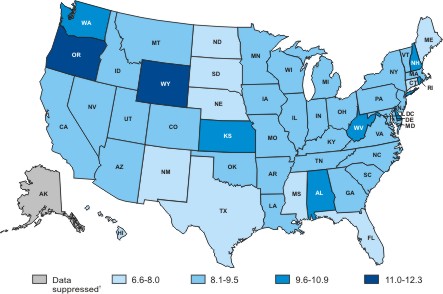 The ovarian cancer death rate for Alaska is suppressed since there were fewer than 16 cases reported in 2004. The states with death rates in the first interval (6.6 to 8.0 per 100,000) include Connecticut, Florida, Hawaii, Maine, Mississippi, Nebraska, New Mexico, North Dakota, South Dakota, and Texas. The states with death rates in the second interval (8.1 to 9.5 per 100,000) include Arizona, Arkansas, California, Colorado, Georgia, Idaho, Illinois, Indiana, Kentucky, Louisiana, Maryland, Massachusetts, Michigan, Minnesota, Missouri, Montana, New Jersey, New York, North Carolina, Ohio, Oklahoma, Pennsylvania, South Carolina, Tennessee, Utah, Vermont, Virginia, and Wisconsin; the death rate for the District of Columbia is included in the second interval. The states with death rates in the third interval (9.6 to 10.9 per 100,000) include Alabama, Delaware, Iowa, Kansas, Nevada, New Hampshire, Rhode Island, Washington, and West Virginia. The death rates for Oregon and Wyoming are in the fourth interval (11.0 to 12.3 per 100,000). *Rates are per 100,000 and are age-adjusted to the 2000 U.S. standard population.
Page last reviewed: March 14, 2008
Page last updated: March 14, 2008 Content source: Division of Cancer Prevention and Control, National Center for Chronic Disease Prevention and Health Promotion |
|
|||||||||||||||||||||||||||||||||||||||||||||||||||||||||||||||||||||||||||||||||||||||||||||||||||||||
|
|
|
||||||||||||
|