
The widespread and systematic influence of ENSO on the ocean-atmosphere system led to initiation of the Tropical Ocean-Global Atmosphere (TOGA) Program, a 10-y study (1985-1994) of climate variability on seasonal to interannual time scales. Key to the success of TOGA is the accurate determination of basin scale fluctuations in surface winds, sea surface temperature (SST), upper ocean heat content, near-surface currents, and sea level in the tropical Pacific. Measurement of these oceanographic fields is required to describe fully the variability related to ENSO, to understand the physical processes responsible for that variability, and to initialize and verify short-term climate prediction models.
Plans for TOGA in the early 1980s called for an ocean observing system that would rely on an increased utilization of satellite products, in particular for SST, surface winds and sea level, and on the development of a "thin monitoring" array of in situ measurements based on an enhancement of existing capabilities. The in situ array would specifically include a volunteer observing ship (VOS) expendable bathythermograph (XBT) program, a tide gauge network, a drifting buoy program and about 15 moorings located principally in the eastern Pacific (U.S. TOGA Project Office, 1988). Unfortunately, even with the planned enhancement of existing in situ measurements, it was recognized that large areas of the tropical Pacific would still be poorly sampled and that important processes like wind-forced excitation and propagation of equatorial Kelvin waves would not be well resolved. The reliance on in situ measurements was further heightened by delays in satellite missions and/or temporal discontinuities in satellite data coverage. For example, launch of the U.S. National Aeronautics and Space Administration's scatterometer (NSCAT) for surface wind velocity estimates, originally scheduled for 1989, has been delayed until after the end of TOGA; and there was a 2-y hiatus in satellite sea level altimetry measurements between the end of the US Navy's GEOSAT (Geodetic Satellite) mission in 1989 and the launch of European Space Agency's Environmental Research Satellite (ERS-1) in 1991.
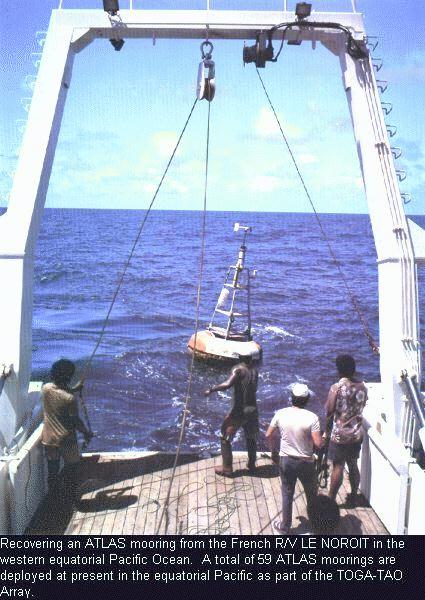
The need for improved in situ observational capabilities in TOGA motivated Dr. Stanley P. Hayes of the National Oceanic and Atmospheric Administration's Pacific Marine Environmental Laboratory (NOAA/PMEL) to develop a wind and thermistor-chain mooring capable of telemetering its data to shore in real-time. He also conceived and, until his untimely death in July 1992, directed the implementation of a basin-scale network of these moorings, which he called the TOGA Tropical Atmosphere Ocean (TAO) Array (Hayes et al., 1991b). TOGA-TAO far exceeded in scope what had been originally anticipated as a moored array component to the TOGA observing system. In April 1993, TAO consisted of 65 moorings; the array will expand to nearly 70 moorings by the end of 1994 (Fig. 1). Hayes also established a multi-national base of support for TOGA-TAO, which at present involves cooperation between the United States, France, Japan, Korea and Taiwan.

Fig. 1: The TOGA-TAO Array in August 1993 and in its final configuration December 1994. ATLAS moorings (diamond), and current-meter moorings (square).
Prototype ATLAS moorings providing measurements of air temperature, SST and subsurface temperature to 500 m were first deployed in 1984 at 2°N, 108°W and 2°S, 110°W. All data were transmitted to shore in real-time via Service Argos, utilizing NOAA's polar orbiting weather satellites for data relay. These initial deployments were followed in 1985 by the installation of regional scale meridional arrays that spanned the equator along 110°W and along 165°E, the latter in collaboration with the Institut Français de Récherche Scientifique pour le Développement en Coopération (ORSTOM) in Noumea, New Caledonia. Realizing the importance of the surface wind field in driving the tropical ocean circulation lead to the addition of real-time wind measurements to ATLAS moorings in 1986. Beginning in 1989, relative humidity sensors were added for studies of atmospheric boundary layer dynamics and air-sea exchange processes. The early technical successes of the ATLAS mooring program and the recognized value of the data for short-term climate studies led to multi-national plans for a basin-scale expansion of the array during the second half of TOGA (1990-1994). This expansion was feasible because the relatively low cost of the ATLAS mooring allowed for its deployment in large numbers.
TOGA-TAO as it is now constituted also includes a small number of Profile Telemetry of Upper Ocean Currents (PROTEUS) and conventional current-meter moorings along the equator. PROTEUS and ATLAS moorings are similar in design and instrumentation. PROTEUS in addition measures and telemeters current profiles in the upper 250 m from a downward-looking acoustic Doppler current meter mounted in the surface buoy (McPhaden et al., 1991b).
Design criteria for TOGA-TAO are based on general
circulation model simulations
of wind-forced oceanic variability and on empirical studies of
space/time correlation
scales. These
studies indicate that basin-scale wind measurements within
~7° of the equator are
required
to simulate accurately the seasonal to interannual evolution of
SST variability in the
cold-tongue
region of the equatorial Pacific and that the ocean responds most
sensitively to zonal
wind rather than meridional wind forcing on these time scales
(Harrison, 1989). Zonal
wind field variations
are minimally coherent over 2-3° latitude and 10-15°
longitude (Harrison and
Luther, 1990), and
approximately one sample per day is required to achieve an
accuracy of 0.5-1.0 m s
for monthly
mean zonal wind speeds at a particular location (Halpern, 1988;
Mangum et al.,
1992).
The space/time scales of upper ocean thermal structure are depth
dependent and
nonstationary in time. However, the most stringent thermal field
sampling
requirements (for thermocline temperature during non-ENSO
periods) are comparable to
those for zonal winds (e.g., Meyers et al., 1991; Hayes
and McPhaden, 1992).
Zonal current variations are coherent over 20-
30° longitude on monthly time scales along the equator
(McPhaden and Taft, 1988),
where direct
velocity measurements are required because of the limited utility
of the geostrophic
approximation.
Enhancements to the TAO array at present include additional moorings west of the date line as part of the TOGA Coupled Ocean Atmosphere Response Experiment (COARE; Webster and Lukas, 1992) to provide finer than 10° zonal resolution of surface winds, upper ocean temperatures, and currents along the equator over a 2-y period beginning in early 1992 (Fig. 1). Also, sensors have been added to several moorings in the western Pacific to measure salinity, rainfall, and incoming shortwave radiation for specialized research purposes. Similarly, bio-optical sensors have been added to the 0°, 140°W PROTEUS mooring for the Equatorial Pacific Joint Global Ocean Flux Study (Murray et al., 1993).
TAO data are made available to the research community directly from PMEL via Internet anonymous file transfer protocol (ftp) procedures, and via a dial-up phone line data base. In addition, PMEL distributes TAO Workstation Display software, which allows remote users to display interactively real-time TAO data and animations on Unix workstations using a point-and-click windows interface (Soreide and McPhaden, 1993). A subset of the real-time TAO data stream is retransmitted on the Global Telecommunications System (GTS) by Service Argos, so that the meteorological measurements are available for assimilation into atmospheric numerical weather prediction models at, for example, the European Center for Medium Range Weather Forecasting (ECMWF), the Fleet Numerical Oceanography Center (FNOC), and the U.S. National Meteorological Center (NMC). Real-time TAO SST measurements are included in weekly blended analyses of in situ and satellite data at NMC (Reynolds, 1991), subsurface thermal data are assimilated directly into the NMC operational ocean model (e.g., Leetmaa and Ji, 1989), and wind data are incorporated into the Florida State University (FSU) monthly ship wind analyses (Legler, 1991). Data from the TAO Array have also been used to validate satellite-derived estimates of SST (e.g., Liu, 1988), wind speed (e.g., Atlas et al., 1991; Bates, 1991), sea level (e.g., Cheney et al., 1989; Picaut et al., 1992), surface geostrophic currents (Picaut et al., 1990), rainfall (McPhaden et al., 1993) and most recently estimates of surface wind velocity from the ERS-1 scatterometer (Halpern et al., 1993).
A skeletal version of the TAO Array was used to describe the evolution of the 1986-87 ENSO event (McPhaden et al., 1990; McPhaden and Hayes, 1990), and the mechanisms responsible for SST variability along the equator (Hayes et al., 1991a; McPhaden and Picaut, 1990). The array in late 1987 consisted of 15 moorings, primarily concentrated along 110°W, 140°W, and 165°E. In the following section, we present a preliminary description of the 1991-93 ENSO from a much more extensive array of buoy measurements across the Pacific basin.

Fig. 2: Time series of (A) surface winds and (B)
sea-surface temperature
at selected locations along the equator. Daily data have been
lightly smoothed with a 5-day
Hanning filter for clearer presentation. Island wind data from
Kapingamarangi (1°00N,
154°50
E)
and Naura (0°32
E,
166°54
E) have been
substituted where gaps exist in the mooring
time series. Dashed lines are long-term monthly averages based
on the Comprehensive Ocean Atmosphere Data
Set (COADS) for winds in (A) and on COADS-Ice analyses for
SST (Reynolds, 1988) in (B).
Fig. 3: (A) Monthly mean SST (in °C) averaged between 2°N and 2°S as a function of time and longitude based on TAO buoy data. Contour interval is 0.5°C. Symbols along the top abscissa indicate longitudes where data were available at the start of the record (August 1986); symbols along the bottom abscissa indicate longitudes where data were available at the end of the record (mid-August 1993). The actual distribution with time is shown in (B). Months with data at 2°S, 0°N, and 2°N are indicated by a square, triangle, and circle, respectively.
Fig. 4: Monthly mean anomalies averaged between 2°N and
2°S for (A) zonal winds (m s)
and (B) SST (°C) as a function of time and longitude.
Symbols along the top abscissa
indicate longitudes where data were available at the start of the
record (August 1986); symbols
along the bottom abscissa indicate longitudes where data were
available at the end of the record
(mid-August 1993). Contour intervals are 1 m s
in (A) and 0.5°C in
(B).
Warm SST anomalies <=1°C subsequently began to appear in the central and eastern Pacific in mid-1991. However, the ENSO really began to take shape in September 1991, when an abrupt SST increase (e.g., 2°C at 0°, 140°W) interrupted the normal seasonal evolution of the equatorial cold tongue (Fig. 2b). This sharp rise in SST was associated with a westerly wind burst of several weeks duration west of the dateline in August- September (Fig. 2a). A second pronounced episode of westerly winds penetrated eastward to 170°W during November and December 1991, followed by a third westerly wind event that reached all the way to 140°W for a few days in January 1992. SST anomalies east of the date line grew in response to the amplification and eastward extension of these westerly wind anomalies, peaking at >2°C near 155°W in the first quarter of 1992. By March, 28°C SSTs, values usually confined to west of 170°W along the equator, appeared as far east as 110°W (Fig. 3a). Conversely, under the influence of intense local westerly wind forcing, SST decreased to near-normal temperatures in the western Pacific (Figs. 2b and 4b). The lowest monthly values of the SOI during the event (-3.4 and -3.0) were reached in January and March 1992 (Climate Analysis Center, 1993).
Fig. 5: Contour plots of zonal velocity (cm s) in the top 250 m from PROTEUS
moorings
on the equator at (A) 165°E, (B) 140°W
and (C) 110°W for
September 1991 to August 1992. Westward (negative) flow is
shaded blue; eastward (positive)
flow is shaded yellow to red. Data have been smoothed with an
11-d Hanning filter.
The observed changes in SST for late 1991 and early 1992
were mediated by
large-scale adjustments in the upper-ocean heat content and
current structures. The
eastward expansion of
the western Pacific warm pool was associated with a reversal of
the westward flowing
South Equatorial Current across the basin. This surface current
reversal was
modulated on the time scale of the westerly wind bursts in
response to direct wind
forcing west of the date line (Fig. 5a), and in
response to the passage of remotely wind-forced
equatorial Kelvin waves east of the date line (Fig. 5a and
c). At 165°E, the maximum eastward flow in the surface
layer was over 100 cm
s in January 1992.
Current fluctuations on monthly time scales at 140°W led
those at 110°W by
~2-3 wk, consistent with the 2-3 m s
phase speeds expected for first
baroclinic
mode equatorial Kelvin
waves in the eastern Pacific (Johnson and McPhaden, 1993).
Peak-to-peak fluctuations
in the depth of the upper thermocline (as characterized by the
depth of the 20°C
isotherm) were 25-50 m
in the central and eastern Pacific between October 1991 and March
1992 in association
with the
passage of these Kelvin waves (Fig. 6b).
Fig. 6: Anomalies in the depth of the 20°C isotherm (in m) averaged between 2°N and 2°S for July 1991 to mid-August 1993. Anomalies are based on TAO buoy data smoothed to 5-day averages and differenced from an XBT climatology (Kessler, 1990). Contour interval is 10 m. Symbols along the top abscissa indicate longitudes where data were available at the start of the record; symbols along the bottom abscissa indicate longitudes where data were available at the end of the record.
The thermocline normally slopes downward from east to west across the Pacific in response to large-scale tradewind forcing. In August 1991, for example, the 20°C isotherm was 100 m deeper at 165°E than at 110°W (Table 1). However, relaxation of the trades and anomalous eastward displacement of the warm surface layer elevated the thermocline west of the date line by 25-30 m in November-December 1991, and depressed the thermocline in the eastern Pacific by 40-50 m during September-November 1991 (Fig. 6b). Depression of the thermocline in the cold tongue region limits the effectiveness of local equatorial upwelling (i.e., upward mass flux near the equator associated with Ekman divergence in the surface layer) in cooling SST. Hence, warm SST anomalies developed in the eastern equatorial Pacific even at those longitudes where local zonal winds were near to or slightly stronger than normal throughout the event, e.g., east of 125°W (Fig. 4). A similar relationship between SST and local zonal wind anomalies was evident at 110W in the eastern Pacific during the 1986-87 ENSO (McPhaden and Hayes, 1990; see also Fig. 4).
By February 1992, the 20°C isotherm was only ~35 m deeper at 165°E than at 110°W; moreover, the slope of the 20°C isotherm had reversed between 140°W and 170°W (Table 1). This flattening and reversal of the east-west slope to the thermocline weakened the baroclinic zonal pressure gradient, which is the driving force for the Equatorial Undercurrent. As a consequence, the Undercurrent at 140°W was reduced to about one-half its typical strength from December 1991 to March 1992 (Fig. 5b). Weakening of the Undercurrent at 110°W was also evident (particularly in March 1992) but less pronounced than at 140°W, because the slope of the thermocline remained upward to the east throughout the ENSO at 110°W where the tradewinds were locally stronger than normal (e.g., Figs. 2a and 4a; Table 1).
Westerly
wind anomalies began to abate
in the central and western Pacific in February-March 1992. At
the same time, a
stronger than usual westward South Equatorial Current appeared
west of the dateline
(Fig. 5a) and the normal
"springtime reversal" of the
South Equatorial Current failed to materialize (i.e., eastward
flow ~50 cm s in the
surface layer along the equator that usually occurs during boreal
spring in the
eastern Pacific;
Halpern, 1987; McPhaden et al., 1991b) (Fig. 5, b
and c). Hence, the surface currents along the equator were
anomalously westward
across the basin by March-April 1992. In response to these large
scale zonal wind and
current changes, the 28-29°C surface waters began a retreat
to the western
Pacific
(Fig. 3a) and the
thermocline began to rise in the
eastern Pacific (Fig.
6). By April 1992, the SOI was
also on the rise.
Surface cooling abruptly accelerated in June 1992 with a 2-4°C drop of SST in the cold tongue (Fig. 2b). This resulted in slightly colder than normal SSTs between 110°W and 140°W (Figs. 2b and 4b), and the development of a more pronounced cold tongue in mid-1992 compared with mid-1991 (Figs. 3a and 7). The sharpness of the June drop in SST was particularly pronounced at 110°W (4°C in a week) where the thermocline had shoaled to within 50 m of the surface.

Fig. 7: Monthly mean SST (°C) and monthly mean surface wind vectors from TAO buoy data for August 1991 and August 1992. SST data are gridded using an objective analysis procedure with the Reynolds (1988) averages as a first guess field.
In August 1992, the SOI became positive for the first time
since 1990. SST,
thermocline depth, and surface easterlies were near normal in the
eastern and central
Pacific, and it appeared
that the event had terminated. However, west of the date line,
SSTs near the equator
remained
0.5-1.0°C warmer than normal, 1-2 m s westerly wind anomalies persisted,
and
the thermocline
remained 25 m shallower than normal. Then late in 1992, westerly
wind anomalies began
to intensify in the central and western Pacific, and a trend
toward warmer than normal
SSTs developed anew in the cold tongue region (Figs. 4
and 6). By April
1993, ENSO conditions had clearly returned, though they were not
quite as pronounced
as in early 1992. The SOI had dipped to -1.6 and, in the eastern
Pacific, near
equatorial SST anomalies had grown to 1.0°-1.5°C and
the 20°C isotherm
depth was 20 m deeper than normal. Subsequently, these ENSO
anomalies diminished,
with near normal SSTs appearing along the equatorial between
110°W and
155°W
in July 1993. Whether the observed tendencies toward cooler
climatic conditions in
the tropical Pacific will continue is unknown at present, since
existing ENSO
prediction schemes give conflicting forecasts for the next 6 mo
(Climate Analysis
Center, 1993)
There are precedents for large scale anomalous climatic conditions associated with ENSO to span three calendar years (e.g., mid-1957 to early-1959; mid-1986 to early-1988). However, data from 1991-93 provide the best documentation of such prolonged warm conditions in the tropical Pacific, and indicate a detailed evolution of the coupled system unlike that of any event in the recent past. In particular, the second major amplification of basin scale westerly wind and SST anomalies in early 1993 has no apparent analogue in the past 40 y for which enough data exist to make reasonable comparisons (cf. Harrison, 1987; Kousky and Leetmaa, 1989; Rasmusson and Carpenter, 1982). The previous two events (1982-83 and 1986-87) like-wise evolved differently than any in the past 40 y.
The unusual evolution of the coupled ocean-atmosphere system in the tropical Pacific during 1991-93 highlights the complexity of the phenomenon we call ENSO. While there are aspects of ENSO common to all events (e.g., a seasonal time scale weakening of the tradewinds and basin scale warming of SST along the equator), significant event-to- event differences challenge attempts to characterize ENSO variability in terms of regularly occurring stages of development. Moreover, event-to-event differences, which are not well understood, emphasize the need for more research into ENSO dynamics. A better understanding of the mechanisms responsible for the onset, intensity, duration, and decay of ENSO anomalies will likely lead to improvements in our ability to predict ENSO using coupled ocean-atmosphere models.
Progress has likewise been made in the development of models for ENSO prediction (e.g., Barnett et al., 1988; Cane et al., 1986; Ji and Leetmaa, 1992). However, existing prediction schemes have limited forecast skill, and initialization procedures for dynamic climate forecast models have not yet been developed to take full advantage of available oceanic and atmospheric data sets. Moreover, TOGA-TAO will not be completed until 1994, so that sufficient time will not be available before the scheduled end of TOGA to evaluate critically its utility for ENSO predictions. As a result, planning is in progress to continue the TAO Array in support of the World Climate Research Program's CLIVAR (Climate Variability) study, and in support of a U.S. contribution to CLIVAR, namely the Global Ocean Atmosphere Land System (GOALS) program. GOALS and CLIVAR, research programs scheduled for the 15-year period 1995-2010, will build on the success of TOGA to understand and predict better the coupled ocean-atmosphere variability originating in the tropics on time scales of seasons to a few years. TOGA-TAO is also being considered as a contribution to the proposed Global Climate Observing System (World Meteorological Organization, 1992), the proposed Global Ocean Observing System (Joint Oceanographic Institutions, 1993), and the proposed International Research Institute for Climate Prediction (IRICP Task Group, 1992).
Barber, R.T. and Chavez, F.P., 1983: Biological consequences of El Niño. Science, 222, 1203-1210.
Barnett, T., Graham, N., Cane, M.E., Zebiak, S.E., Dolan, S.C., O'Brien, J. and Legler, D., 1988: On the prediction of the El Niño of 1986-1987. Science, 241, 192-196.
Bates, J., 1991: High-frequency variability of special sensor microwave/imager derived wind speed and moisture during an intraseasonal oscillation. J. Geophys. Res. 96, 3411-3423. Cane, M.E., Zebiak, S.E. and Dolan, S.C., 1986: Experimental forecasts of El Niño. Nature, 322, 827-832.
Cheney, R.E., Douglas, B.C. and Miller, L., 1989: Evaluation of GEOSAT altimeter data with application to tropical Pacific sea level variability. J. Geophys. Res., 94, 4737-4748.
Climate Analysis Center, 1993: Climate Diagnostics Bulletin, Near Real-time Analyses, April 1993. U.S. Department of Commerce, National Oceanic and Atmospheric Administration, Washington, D.C., 76 pp.
Halpern, D., 1987: Observations of annual and El Niño thermal and flow variations at 0°, 110°W and 0°, 95°W during 1980-1985. J. Geophys. Res., 92, 8197-8212.
__________, 1988: On the accuracy of monthly mean wind speeds over the equatorial Pacific. J. Atmos. Ocean. Tech., 5, 362-367.
__________, Frielich, M.H. and R.S. Dunbar, 1993: Evaluation of two Jaunary-June 1992 ERS-1 AMI wind vector data sets. Proc. First ERS-1 Symp., Cannes, 4-6 November 1992, European Space Agency, Paris, in press.
Harrison, D. E., 1987: Monthly mean island surface winds in the central tropical Pacific and El Niño events. Mon. Wea. Rev., 115, 3133-3145.
__________, 1989: Local and remote forcing of ENSO ocean waveguide response. J. Phys. Oceanogr., 19, 691-695.
__________ and Luther, D.S., 1990: Surface winds from tropical Pacific islands: climatological statistics. J. Climate, 3, 251-271.
Hayes, S.P., Chang, P. and McPhaden, M.J., 1991a: Variability in sea surface temperature in the eastern equatorial Pacific. J. Geophys. Res., 96, 10,553-10,566.
__________, Mangum, L.J., Picaut, J., Sumi, A. and Takeuchi, K., 1991b: TOGA-TAO: A moored array for real-time measurements in the tropical Pacific Ocean. Bull. Am. Met. Soc., 72, 339-347.
__________ and McPhaden, M.J., 1992: Temporal sampling requirements for low frequency temperature variability in the eastern equatorial Pacific Ocean. NOAA Technical Report, ERL PMEL-96, 17 pp.
IRICP Task Group, 1992: International Research Institute for Climate Prediction: A proposal. NOAA Office of Global Programs, Silver Spring, MD, 51 pp.
Ji, M. and Leetmaa, A., 1992: Impact of TAO Array on ocean model based climate diagnostics and prediction. Proc. of the MTS '92 Conference, Washington, D.C., October 19-21, 1992, Vol. II, 464-470.
Johnson, E.S. and McPhaden, M.J., 1993: On the structure of equatorial Kelvin waves in the Pacific Ocean. J. Phys. Oceanogr., 13, 608-625.
Joint Oceanographic Institutions, 1993: First Steps Towards a U.S. GOOS: Report of a Workshop on Priorities for U.S. Contributions to a Global Ocean Observing System, Woods Hole, Massachusetts, 14-16 October 1992. Joint Oceanographic Institutions Incorporated, Washington, D.C., 48 pp.
Kessler, W.S., 1990: Observations of long Rossby waves in the northern tropical Pacific. J. Geophys. Res., 95, 5183-5217.
Kousky, V.E. and Leetmaa, A., 1989: The 1986-87 Pacific warm episode: evolution of oceanic and atmospheric anomaly fields. J. Climate, 2, 254-267.
Leetmaa, A. and Ji, M., 1989: Operational hindcasting of the tropical Pacific. Dyn. Atmos. Ocean., 13, 465-490.
Legler, D.M., 1991: Producing surface wind products for oceanographers. Proc. IGOSS/IOC Ocean Products Workshop, Tokyo, Japan, April 1991, 59-76.
Liu, T., 1988: Moisture and latent heat flux variabilities in the
tropical Pacific
derived from satellite data.
Mangum, L.J., Hayes, S.P. and Stratton, L.D., 1992: Sampling
requirements for the
surface wind
field over the tropical Pacific Ocean. J. Climate, 9,
668-679.
McPhaden, M.J., Hansen, D.V., and Richardson, P.L., 1991a: A
comparison of ship
drift, drifting buoy and current meter mooring velocities in the
Pacific South
Equatorial Current. J.
Geophys. Res., 96, 775-782.
__________ and Hayes, S.P., 1990: Variability in the eastern
equatorial Pacific
during 1986-88. J. Geophys. Res., 95, 13,195-13,208.
__________, Hayes, S.P., Mangum, L.J. and Toole, J.M., 1990:
Variability in the
western
equatorial Pacific Ocean during the 1986-87 El
Niño/Southern Oscillation event.
J. Phys. Oceanogr., 20, 190-208.
__________, Milburn, H.B., Arkin, P.A., Thiele, O.W., Wilkerson,
J. and Krajewski,
W.F.,
1993: Moored optical rain-gauge measurements from the equatorial
Pacific Ocean.
Proc. of
the Fourth International Conference on Precipitation, Iowa
City, Iowa, April
26-28, 1993, pp.
32-33.
__________, Milburn, H.B., Nakamura, A.I. and Shepherd, A.J.,
1991b: PROTEUS--Profile
telemetry of upper ocean currents. Sea Technology, 32,
10-19.
__________ and Picaut, J., 1990: El Niño/Southern
Oscillation displacements of
the
western equatorial Pacific warm pool. Science, 250,
1385-1388.
__________ and Taft, B.A., 1988: On the dynamics of seasonal and
intra-seasonal
variability
in the eastern equatorial Pacific Ocean. J. Phys. Oceanogr.,
18, 1713-1732.
Meyers, G., Phillips, H., Smith, N. and Sprintall, J., 1991:
Space and time scales
for optimal interpolation of temperature-tropical Pacific Ocean.
Prog. Oceanogr.,
28, 189-219.
Murray, J.W., Leinen, M.W., Feely, R.A., Toggweiler, J.R., and
Wanninkhof, R., 1993:
EqPac:
a process study in the central equatorial Pacific.
Oceanography, 5,
134-142.
Picaut, J., Busalacchi, A.J., Delcroix, T. and McPhaden, M.J.,
1992: Rigorous
open-ocean validation of TOPEX/POSEIDON sea level in the western
equatorial Pacific.
TOPEX/POSEIDON Joint Verification Plan, NASA, Jet Propulsion
Laboratory. JPL,
92-2, pp. V-14 to V-16.
__________, Busalacchi, A.J., McPhaden, M.J. and Camusat, B.,
1990: Validation of the
geostrophic method for estimating zonal currents at the equator
from GEOSAT altimeter
data.
J. Geophys. Res., 95, 3015-3024.
Rasmusson, E.M. and Carpenter, T.H., 1982: Variations in
tropical sea surface
temperature and
surface wind fields associated with the Southern Oscillation/El
Niñ Mon.
Wea. Rev.,
110, 354-384.
__________ and Wallace, J.M., 1983: Meteorological aspects of El
Niño/Southern
Oscillation. Science, 222, 1195-1202.
Reynolds, R.W., 1988: A real-time global sea surface temperature
analysis. J.
Climate, 1, 75-86.
__________, 1991: Sea surface temperature analyses from in situ
data. TOGA Notes,
No.
5, 8-12.
Ropelewski, C.F. and Halpert, M.S., 1987: Global and regional
scale precipitation
patterns associated with the El Niño/Southern Oscillation.
Mon. Wea. Rev.,
115, 1606-1626.
Soreide, N.N. and McPhaden, M.J., 1993: TAO display software for
real-time data from
the TOGA-TAO Array. Proceedings of the Third Scientific
Meeting of The
Oceanographic Society, Seattle, WA, April 13-16, 1993, 53
pp.
US TOGA Project Office, 1988: Report on a drafting workshop,
AOML, Miami, on elements
of the ten-year monitoring component of El Niño and the
Southern Oscillation
(ENSO).
Tech. Rept. USTOGA-1, University Corporation for
Atmospheric Research, Boulder,
Colorado, 42 pp.
Webster, P.J. and Lukas, R., 1992: TOGA-COARE: The Coupled
Ocean-Atmosphere
Response
Experiment. Bull. Am. Meteor. Soc., 73, 1377-1416.
World Meteorological Organization, 1992: The Global Climate
Observing System (GCOS).
WMO Publication No. 777, Geneva, Switzerland, 12 pp.
Fig. 2: Time series of
(A) surface winds and (B) sea-surface temperature
at selected locations along the equator. Daily data have been
lightly smoothed with a 5-day
Hanning filter for clearer presentation. Island wind data from
Kapingamarangi (1°00
Fig. 3: (A)
Monthly mean SST (in °C) averaged between 2°N and
2°S as a function
of time and longitude based on TAO buoy data. Contour interval
is 0.5°C. Symbols along the top
abscissa indicate longitudes where data were available at the
start of the record (August 1986); symbols
along the bottom abscissa indicate longitudes where data
were available at the end of the record
(mid-August 1993). The actual distribution with time is shown in
(B). Months with data at
2°S, 0°N, and 2°N are indicated by a square,
triangle, and circle, respectively.
Fig. 4: Monthly mean
anomalies averaged between 2°N and 2°S for (A)
zonal winds (m s
Fig. 5: Contour plots of
zonal velocity (cm s
Fig. 6: Anomalies in the
depth of the 20°C isotherm (in m) averaged between 2°N
and 2°S for July 1991 to mid-August 1993. Anomalies are
based on TAO buoy data
smoothed to 5-day averages and differenced from an XBT
climatology (Kessler, 1990). Contour
interval is 10 m. Symbols along the top abscissa indicate
longitudes where data were
available at the start of the record; symbols along the bottom
abscissa indicate longitudes where
data were available at the end of the record.
Fig. 7: Monthly mean SST
(°C) and monthly mean surface wind vectors from TAO
buoy data for August 1991 and August 1992. SST data are gridded
using an objective
analysis procedure with the Reynolds (1988) averages as a first
guess field.
Return to Publications and Abstracts
pageFigure Captions
Fig. 1: The TOGA-TAO
Array in August 1993 and in its final configuration December
1994. ATLAS
moorings (diamond), and current-meter moorings (square).N,
154°50
E)
and Naura (0°32
E,
166°54
E) have been
substituted where gaps exist in the mooring
time series. Dashed lines are long-term monthly averages based
on the Comprehensive Ocean Atmosphere Data
Set (COADS) for winds in (A) and on COADS-Ice analyses for
SST (Reynolds, 1988) in (B).
)
and (B) SST (°C) as a function of time and longitude.
Symbols along the top abscissa
indicate longitudes where data were available at the start of the
record (August 1986); symbols
along the bottom abscissa indicate longitudes where data were
available at the end of the record
(mid-August 1993). Contour intervals are 1 m s
in (A) and 0.5°C in
(B).
) in the top 250 m from PROTEUS
moorings
on the equator at (A) 165°E, (B) 140°W
and (C) 110°W for
September 1991 to August 1992. Westward (negative) flow is
shaded blue; eastward (positive)
flow is shaded yellow to red. Data have been smoothed with an
11-d Hanning filter.
Return to
Introduction
ryan@pmel.noaa.gov